Lutfullayev G. U.1, Yunusova N. A.2
1DSc, Professor, Samarkand State Medical University, Samarkand, Uzbekistan
2PhD-Student, Samarkand State Medical University, Samarkand, Uzbekistan
Copyright © 2026 The Author(s). Published by Scientific & Academic Publishing.
This work is licensed under the Creative Commons Attribution International License (CC BY).
http://creativecommons.org/licenses/by/4.0/

Abstract
The morphological types of benign tumors located in the nose, paranasal sinuses, and nasopharynx, their features of detection by CT-scan, and their significance as a clinical pathogenetic factor affecting hearing were analyzed. Based on the conclusions of Mouangue-Mbonjo et al. about the correspondence of CT-SCAN results with histopathology in 90.9% of cases, the effectiveness of CT-SCAN in assessing tumor localization and types was also confirmed in this study. The study evaluated 101 patients (groups I and II) based on CT-scan and clinical data. Among them, polyps were the main cause of hearing impairment in group I, while in group II, vascular and epithelial tumors (hemangioma, papilloma, fibroma) prevailed.
Keywords:
Paranasal sinuses, Nasopharynx, Benign tumor, CT-scan, Polyp, Hearing impairment, Hemangioma, Papilloma, Fibroma
Cite this paper: Lutfullayev G. U., Yunusova N. A., Pathogenetic Characteristics of Hearing Disorders in Benign Rhinosinusal Tumors and the Clinical Significance of CT-Scan Information, American Journal of Medicine and Medical Sciences, Vol. 16 No. 1, 2026, pp. 162-165. doi: 10.5923/j.ajmms.20261601.36.
1. Introduction
Hearing impairment is one of the functional disorders that occurs in individuals of different ages and is of significant importance in the global healthcare system [1,5]. According to the World Health Organization (WHO) in 2021, approximately 1.5 billion people in the world have a certain degree of hearing impairment, of which more than 430 million have clinically significant hearing loss. According to WHO forecasts, by 2050 the number of people in such a condition may reach 2.5 billion, of which approximately 700 million will need rehabilitation assistance [2,3,4]. Also, in the population over 65 years of age, hearing loss was noted in at least 33% of cases. In children, perinatal infections, ototoxic drugs, and congenital malformations can cause premature hearing loss [6,7].Purpose of the study. to determine the pathogenetic characteristics of hearing impairment in patients with benign rhinosinusal tumors and to evaluate the clinical significance of CT-SCAN in identifying their morphological types, localization, and their role in the development of auditory dysfunction.
2. Materials and Methods
A total of 101 patients with benign tumors of the nasal cavity, paranasal sinuses, and nasopharynx were examined. According to clinical characteristics and CT-SCAN findings, the patients were divided into two main groups (Group I and Group II), each consisting of two subgroups (IA, IB and IIA, IIB). Group I included patients with predominantly polypoid formations, while Group II consisted of patients with vascular and epithelial benign tumors (hemangioma, papilloma, fibroma, angiofibroma).All patients underwent multislice computed tomography (CT-SCAN) to assess the localization, structure, and morphological type of the tumor. CT-SCAN results were evaluated with reference to previously reported data confirming a 90.9% correlation between CT-SCAN and histopathological findings. Tumors were classified according to their type and anatomical localization.Clinical evaluation included analysis of hearing-related complaints (hearing loss, ear fullness, tinnitus) and respiratory symptoms. Statistical analysis was performed to determine the frequency of tumor types, their anatomical distribution, and their association with auditory dysfunction. Comparative assessment between groups and subgroups was conducted using χ², RR, OR, and 95% Confidence Interval. Statistical significance was considered at P<0.05.
3. Results and Discussion
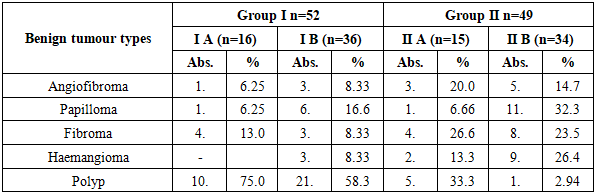
Mouangue-Mbonjo and co-authors, in their studies, proved that CT-SCAN and histopathological findings have a 90.9% correspondence and are an effective method for differentiating benign and malignant tumors Based on this data, we used CT-SCAN in our study to determine the location and type of benign tumors.The types of benign tumors of the nose and paranasal sinuses by CT-SCAN in patients of the study group are presented in Table 1.Table 1. Distribution of patients in the study group by the frequency of benign tumor type
 |
| |
|
According to the analysis of the research results, it was established that benign tumors of the nose and paranasal area (angiofibroma, papilloma, fibroma, hemangioma, polyps), which were noted as an etiological factor causing hearing impairment in patients of groups I and II, have a different frequency of occurrence. In group I, polyps were the most common tumor as an etiological factor, occurring in 75.0% of cases in subgroup IA and 58.3% in subgroup IV. In group II (n=49), the diversity of pathology was wider: the proportion of polyps decreased (IIA - 33.3%, IIB - 2.94%), on the contrary, the frequency of hemangiomas, papillomas, and fibromas was higher.In conclusion, in group I, polypoid tumors played the main role in hearing impairment, while in group II, vascular and epithelial tumors (hemangioma, papilloma, fibroma) prevailed. This condition may be associated with pathogenetic differences between groups, as well as with the age of patients, background diseases, or immunological status. At the same time, the prevalence of histomorphological types indicates the need to organize diagnostic and therapeutic approaches in accordance with the type of tumor.According to statistical analysis, according to angiofibroma analysis, χ2=0.82, RR=0.60, OR=0.44, CI (RR: 0.20-1.81; OR: 0.10-1.92), P<0.05. As a result of papilloma analysis, χ2=4.26, RR=0.34, OR=0.27, CI (RR: 0.13-0.88; OR: 0.08-0.96), P<0.05. For fibroma χ2=0.29, RR=1.38, OR=1.43, CI (RR: 0.62-3.09; OR: 0.44-4.59), P>0.05. In the analysis of hemangioma, χ2=3.76, RR=0.15, OR=0.12, CI (RR: 0.02-1,11; OR: 0.01-1.01), P≈0.05. For polyps χ2=22.88, RR=2.83, OR=8.11, CI (RR: 1.64-4.87; OR: 2.87-22.89), P<0.001.As a result of studying the duration of clinical symptoms in patients of the study group, the following results were obtained (Figure 1).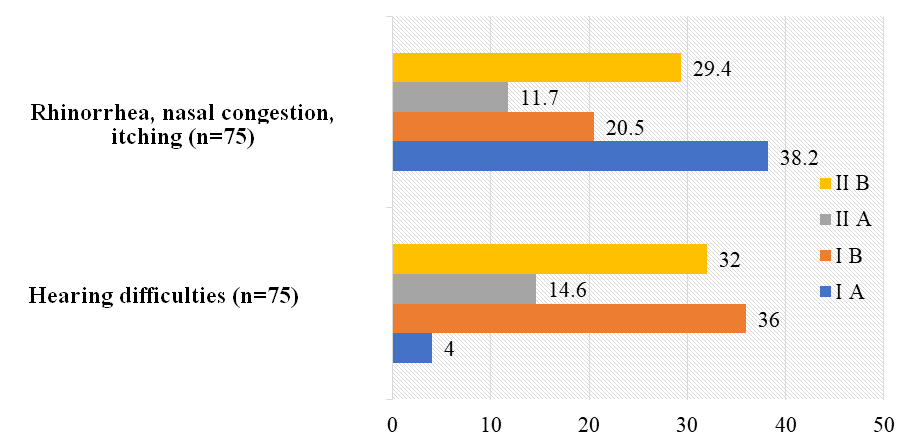 | Figure 1. Frequency of occurrence of clinical symptoms associated with hearing and the auditory system in patients of the study group, % |
According to the examination results, hearing-related symptoms were noted in 3 (4.0%) patients in group I A, 27 (36.0%) in group I B, 11 (14.6%) in group II A, and 24 (32.0%) in group II B. This indicates a significantly higher frequency of auditory complaints in groups I B and II B. Symptoms related to the respiratory system were observed in 13 (38.2%) patients in group I A, 7 (20.5%) in group I B, 4 (11.7%) in group II A, and 10 (29.4%) in group II B. Based on these data, it was found that respiratory symptoms were more common in group IA.In the statistical analysis of hearing-related symptoms, the difference between groups I A and I B was significant, with χ2=14.5, RR=0.11, OR=0.07, 95% confidence interval [RR: 0.03-0.38; OR: 0.02-0.3] and P=0.001. This result indicates that in group I B, auditory symptoms were significantly higher than in group I A. There was also a difference between groups II A and II B, with χ2=6.93, RR=0.45, OR=0.35, 95% CI [RR: 0.22-0.91; OR: 0.13-0.91] and P=0.05. This confirms the predominance of hearing impairments in group IIB.A statistical difference was also revealed between groups I A and I B in terms of respiratory symptoms: χ2=2.66, RR=1.86, OR=2.4, 95% CI [RR: 0.83-4.18; OR: 0.76-7.76], P=0.05. This result indicates that respiratory symptoms in group I A occur almost twice as often as in group I B. And between groups II A and II B, no statistical differences were noted - χ2=0.64, RR=0.40, OR=0.31, 95% CI [RR: 0.14-1.12; OR: 0.08-1.17], P=0.05.In conclusion, it was established that auditory symptoms were significantly more common in groups I B and II B. It was noted that respiratory symptoms predominated mainly in group I A, while in group II the differences were statistically insignificant.Based on the results of the distribution of benign tumors identified by CT-SCAN by anatomical areas, clear differences were observed between the categories (Figure 2).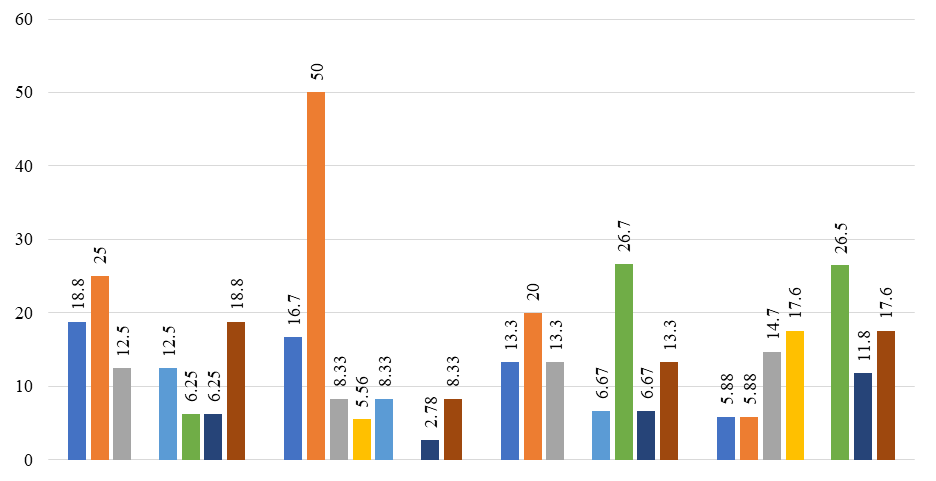 | Figure 2. Distribution of benign tumors by area of occurrence, % (CT-SCAN) |
In patients of group IA (n=16), the most frequent area of tumors was the nasal passages, which were detected in 4 (25.0%) cases. Also, tumors were noted in the nasal septum and Eustachian tube - 3 (18.8%), in the maxillary and sphenoid cavities - 2 (12.5%), in the ethmoid cavity and nasopharynx - 1 (6.25%).In patients of group IV (n=36), the frequency of tumor detection in the nasal passages was significantly higher and was noted in 18 (50.0%) cases. Nasal septum - 6 (16.7%), frontal sinus - 2 (5.56%), maxillary sinus, sphenoid sinus and Eustachian tube - 3 (8.33%), and nasopharynx - 1 (2.78%).In patients of group IIA (n=15), the tumors were mainly located in the ethmoid cavity (4 patients, 26.7%) and nasal passages (3 patients, 20%). Also, the nasal septum, maxillary sinus, Eustachian tube - in 2 (13.3%) cases each, the sphenoid sinus and nasopharynx - in 1 (6.67%).In patients of group IIV (n=34), the tumor was most often localized in the ethmoid cavity (9 cases, 26.5%) and frontal cavity (6 cases, 17.6%). Eustachian tube - in 6 (17.6%), maxillary sinus - in 5 (14.7%), nasopharynx - in 4 (11.8%), nasal septum and nasal passages - in 2 (5.88%) patients.According to the results of statistical analysis in the context of anatomical areas, significant differences were observed between groups IA-IB and IIA-IIB in a number of areas. In particular, for tumors located in the nasal septum in groups IA and IB, χ2=0.00, RR=1.12, OR=1.15, CI (RR: 0.32-3.94; OR: 0.25-5.33), P=1.00. In groups IIA and IIB, χ2=0.10, RR=2.27, OR=2.46, CI (RR: 0.35-14.61; OR: 0.31-19.38), P=0.76.For tumors of the nasal passages in groups IA and IB, χ2=1.90, RR=0.50, OR=0.33, CI (RR: 0.20-1.24; OR: 0.09-1.23), P=0.17; In groups IIA and IIB, χ2=0.99, RR=3.40, OR=4.00, CI (RR: 0.63-18.30; OR: 0.59-26.97), P=0.32.In the analysis of tumors located in the maxillary sinus, in groups IA and IB, χ2=0.00, RR=1.50, OR=1.57, CI (RR: 0.28-8.13; OR: 0.24-10.46), P=1.00; In groups IIA and IIB, χ2=0.00, RR=0.91, OR=0.89, CI (RR: 0.20-4.16; OR: 0.15-5.22), P=1.00.For tumors of the frontal sinus in groups IA and IB, χ2=0.03, RR=0.00, OR=NaN, CI (NaN), P=0.86; In groups IIA and IIB, it was noted that χ2=1.60, P=0.21.For tumors of the sphenoid sinus in groups IA and IB, χ2=0.00, RR=1.50, OR=1.57, CI (RR: 0.28-8.13; OR: 0.24-10.46), P=1.00; In groups IIA and IIB, χ2=0.18, P=0.67 were noted.For tumors of the ethmoid space in groups IA and IB, χ2=0.00, RR=1.50, OR=1.57, CI (RR: 0.28-8.13; OR: 0.24-10.46), P=1.00; In groups IIA and IIB, χ2=0.00, RR=0.91, OR=0.89, CI (RR: 0.20-4.16; OR: 0.15-5.22), P=1.00.For nasopharyngeal tumors in groups IA and IB, χ2=0.01, RR=1.41, OR=2.29, CI (RR: 0.14-13.81; OR: 0.14-37.27), P=0.91; In groups IIA and IIB, χ2=0.23, RR=0.57, OR=0.54, CI (RR: 0.06-5.56; OR: 0.05-6.04), P=0.63.In the analysis of tumors around the Eustachian tube in groups IA and IB, χ2=0.81, RR=2.25, OR=2.55, CI (RR: 0.61-8.23; OR: 0.60-10.77), P=0.37; In groups IIA and IIB, χ2=0.14, RR=1.13, OR=1.15, CI (RR: 0.25-5.15; OR: 0.22-6.11), P=0.71.The results of the analysis of anatomical tumors of benign tumors showed that the differences between groups IA-IB and IIA-IIB were not statistically significant in most cases, i.e., the values of χ2 and P did not exceed the normal range (P<0.05). The conclusion from this is that the localization of benign tumors in specific anatomical areas did not differ significantly depending on the groups.At the same time, in the group IIA-IIB for tumors of the nasal passages, RR=3.40 and OR=4.00 indicate a high risk, however, due to P=0.32, it was also not assessed as statistically significant. For tumors around the Eustachian tube, RR=2.25 and OR=2.55 were registered in group IA, but the result P=0.37 indicates that this difference is not significant. In the analysis of tumors in the remaining areas, including the maxillary, frontal, sphenoid, and ethmoid cavities, as well as the nasopharynx, a statistically significant difference between the groups was not revealed, since P>0.05.
4. Conclusions
1. CT-scan has high efficiency in detecting benign tumors (polyps, hemangiomas, papillomas, fibromas, etc.) in the nasal and paranasal area, and the results of Mouangue-Mbonjo et al. showed a 90.9% correspondence with histopathology, which was also confirmed in this study. This method allows for a quick and accurate assessment of the tumor type and its anatomical localization, which is important for the individual formation of a clinical diagnosis and treatment plan.2. Cases of hearing impairment in the study group were mainly high in subgroups I B and II B, while respiratory symptoms predominated mainly in group I A. In group I, polyps were the main cause of hearing impairment, while in group II, vascular and epithelial tumors (hemangioma, papilloma, fibroma) prevailed. This indicates the need to form pathogenetic differences between groups and individual therapeutic and diagnostic approaches.
References
| [1] | World Health Organization. Deafness and Hearing Loss. // World Health Organization Official Website. - 2023. - https://www.who.int/news-room/fact-sheets/detail/deafness-and-hearing-loss. |
| [2] | Haile L. M. et al. Hearing loss prevalence and years lived with disability, 1990-2019: findings from the Global Burden of Disease Study 2019. // The Lancet. - 2021. - Vol. 397. Issue 10278. - P. 996-1009. |
| [3] | Goman A. M., Lin F. R. Prevalence of hearing loss and years lived with disability, United States, 1990-2019. // Ear and Hearing. - 2021. - Vol. 45. - No. 1. - P. 24-32. |
| [4] | Centers for Disease Control and Prevention (CDC). Data and Statistics on Hearing Loss in Children. - 2022. - https://www.cdc.gov/hearing-loss-children/data/index.html. |
| [5] | Verywell Health. Young People at Risk of Hearing Loss Due to Unsafe Listening. - 2023. - https://www.verywellhealth.com/young-people-at-risk-of-hearing-loss-6833949. |
| [6] | National Institute on Deafness and Other Communication Disorders (NIDCD). Quick Statistics About Hearing. - 2023. - https://www.nidcd.nih.gov/health/statistics/quick-statistics-hearing. |
| [7] | Al-Salim H. et al. Hearing Loss and Cognitive Decline: Pathophysiological Links and Clinical Implications. // Life (MDPI). - 2021. - Vol. 11. - No. 10. - Article ID: 1102. |

 Abstract
 Reference
 Full-Text PDF
 Full-text HTML