Teshabayev Muhammadkodir Gulamovich, Mavlyanov Iskandar Rakhimovich
Republican Scientific and Practical Center of Sports Medicine, Uzbekistan
Copyright © 2025 The Author(s). Published by Scientific & Academic Publishing.
This work is licensed under the Creative Commons Attribution International License (CC BY).
http://creativecommons.org/licenses/by/4.0/

Abstract
This scientific article investigates the dynamic changes in cardiovascular functional indicators among young swimmers throughout different stages of their annual training cycle—preparatory, basic, and pre-competition periods. The research focuses on identifying gender-specific variations in the development of adaptive and hemodynamic capacities in boys and girls aged 11–12 years. The study employs an integrated physiological assessment using indices such as the Robinson Index, Ruffier Test, Endurance Coefficient, Functional Changes Index (FCI), Adaptation Potential (AP), Stroke Volume (SV), Cardiac Output (CO), and Total Peripheral Resistance (TPR). Statistical and comparative analyses revealed that regular swimming training contributes to the stabilization of cardiovascular parameters, enhancement of cardiac efficiency, and improved endurance. The findings demonstrate that female swimmers exhibited more pronounced improvements in endurance and adaptive mechanisms, while male swimmers showed higher gains in overall physical performance. The results emphasize the importance of individualized monitoring of cardiovascular responses in young athletes to prevent overtraining and to optimize training loads based on age and gender characteristics. These insights can serve as practical recommendations for coaches, sports physicians, and physical education specialists in designing effective training programs for children and adolescents engaged in aquatic sports.
Keywords:
Young swimmers, Cardiovascular system, Hemodynamics, Physical performance, Endurance coefficient, Adaptation potential, Robinson index, Ruffier test, Stroke volume, Cardiac output
Cite this paper: Teshabayev Muhammadkodir Gulamovich, Mavlyanov Iskandar Rakhimovich, Characteristics of Functional Parameters of the Body of Young Swimmers, American Journal of Medicine and Medical Sciences, Vol. 15 No. 10, 2025, pp. 3631-3643. doi: 10.5923/j.ajmms.20251510.76.
1. Introduction
According to numerous studies, athletic performance largely depends on the functional indicators of the body. Each type of sport has its own specific model functional characteristics that contribute to performing physical maneuvers quickly, skillfully, and efficiently. Therefore, in order to be selected for a particular sport, athletes must meet the functional requirements necessary to achieve excellent athletic results. Functional criteria differ at various stages of age-related maturation in both boys and girls. There are also distinctive features of the cardiovascular system in children and adolescents compared to adults. In children, the mass and volume of the heart increase, the proportions of its chambers and its position in the chest change, and the histological structure of the heart muscle and blood vessels becomes more differentiated. By the age of 10, the heart mass becomes six times greater than at birth. By the ages of 13–14, the thickness of the heart walls doubles. The increase in heart size occurs mainly due to the growth of the left ventricle.Age-related characteristics must be taken into account when determining physical activity levels, and particular attention should be given to excessive sports loads in children and adolescents. The hearts of children and adolescents adapt easily to physical exertion and recover quickly; however, their cardiac activity is unstable—many coaches overlook this feature and increase training loads excessively [5]. It should also be remembered that the growing bodies of young athletes are more sensitive to external influences compared to adult athletes [12].Knowledge of age-related characteristics and the periods of greatest development of various cardiovascular parameters helps to identify signs of overtraining in time. Considering these data allows for timely adjustments to the training process of young athletes, preventing functional system breakdowns in the developing body and enabling the child to continue participating in sports.Previously, many sports medicine physicians and coaches assessed the activity of the cardiovascular system (CVS) solely by measuring heart rate (HR). It is well known that with age and increased experience in sports activity, the heart rate decreases. This parameter is individual for each athlete; therefore, daily monitoring of the morning pulse should be conducted, taking age into account. For some athletes, a heart rate of 50 beats per minute represents athletic adaptation, while for some children, it already indicates pronounced bradycardia.An increase in heart rate above the athlete’s individual norm is considered a sign of overfatigue, provided there are no other somatic diseases such as diffuse goiter, helminthic invasion, and so on. Knowledge of the pulse rate enables the coach to plan the training process properly or to involve the necessary medical specialist when required.Numerous studies show that the assessment of the cardiovascular system (CVS) is best carried out comprehensively. For this purpose, during the training process, graded physical activity and hemodynamic indices are used. The state of the cardiovascular system can be evaluated based on arterial pressure (systolic (SAP), diastolic (DAP), pulse (PP), and mean dynamic pressure (MDP)), stroke volume (SV) and cardiac output (CO), proper cardiac output (PCO), peripheral vascular resistance (PVR), Kvas’ index, Kerdo’s vegetative index, Robinson index, Ruffier test, endurance coefficient, cardiac index (CI), index of functional changes in the cardiovascular system (IFC), as well as the type of circulatory self-regulation, etc. [10].There are many modern studies assessing the cardiovascular system under clinical conditions; however, such a study as cardiopulmonary testing is not always applicable to 11-year-old children and is rarely conducted among children and adolescents, considering the remoteness of some sports schools from the capital of our country. Lactate testing is also not always approved by parents, as this method is considered invasive. Therefore, the empirical method of heart examination — such as measuring pulse rate and blood pressure at rest, at the peak of physical exertion, and after it — remains relevant. Over time, this method has become part of many hemodynamic indices used to assess the fitness level of athletes [1,8].Monitoring functional indicators as a child grows and develops contributes to the timely implementation of measures aimed at preserving and strengthening the health of the younger generation [9].In adolescents, there is often a mismatch between the size of the heart and the diameter of blood vessels and heart valves, as well as a lag in heart development compared to the rate of increase in overall body dimensions. All of this can lead to the occurrence of functional murmurs and the development of the so-called “drooping heart.” These changes are associated with age-related morphological and physiological restructuring of the endocrine and nervous systems [16].These processes occurring in the cardiovascular system of adolescents increase the risk of developing vegetovascular dystonia and adolescent hypertension [13]. To prevent these undesirable phenomena, a comprehensive assessment of the cardiovascular system is necessary. For example, the mean dynamic arterial pressure is a practically stable value that reflects the degree of elasticity of the arterial wall and indicates the coordination between cardiac output regulation and peripheral vascular resistance. The normal value of mean dynamic pressure (MDP) is 75–85 mmHg [2].Total peripheral vascular resistance (TPR) is the resistance of the blood vessels to blood flow, which arises due to blood viscosity, friction against the vessel walls, and vortex movements. TPR is mainly determined by the degree of constriction of the resistance vessels, which include arterioles and venules located in the pre- and postcapillary regions of the vascular bed. An increase in TPR leads to a significant rise in systolic and especially diastolic pressure, while pulse pressure decreases [6].One of the main indicators of heart function is the cardiac output (CO), which represents the amount of blood ejected into the systemic circulation per minute. CO can vary widely: from 4–5 L/min at rest to 25–30 L/min during intense physical exertion. Cardiac output depends on the stroke volume and heart rate, as well as on body position, gender, age, physical fitness, environmental conditions, and many other factors.The mechanism of the muscle pump plays an important role in increasing cardiac output during physical activity. Muscle contractions compress the veins within them, which immediately increases the venous outflow from the muscles of the lower limbs. Postcapillary vessels (mainly veins) of the systemic circulation (such as those in the liver, spleen, etc.) also act as part of the overall reserve system, and the contraction of their walls increases venous return. All these factors contribute to enhanced blood flow to the right ventricle and the rapid filling of the heart.Objective: To study the functional parameters of the bodies of young swimmers throughout the dynamics of their annual training cycle.
2. Materials and Methods
The study was conducted at the Andijan City Specialized Children’s and Youth Sports School of Swimming. The main group consisted of 60 boys aged 11.8 ± 0.43 years and 56 girls aged 11.6 ± 0.40 years engaged in swimming. The obtained results were analyzed in comparison with generally accepted standards.The Ruffier test was performed after 5–10 minutes of rest. The pulse rate was measured at rest in a sitting position (P1). Then, the subject performed 30 squats in 45 seconds, after which, while sitting, the pulse readings were recorded during the first 15 seconds (P2). The third indicator (P3) was the number of heartbeats during the last 15 seconds of the first minute of rest after the squats. The Ruffier Index (I) was calculated using the following formula: I = 4 × (P1 + P2 + P3) – 200 / 10. Interpretation of the Ruffier Index for 11-year-olds: 18 and above – unsatisfactory, 14–18 – low physical performance, 9–13 – satisfactory performance, 3.5–9 – good, up to 3 – excellent.To assess the endurance coefficient (EC), regional standards were used, according to which the normal EC value for preschool and primary school children corresponds to 22–24 conventional units, and for middle school children – 19–22 conventional units. An increase in this indicator indicates a decrease in the functional capabilities of the cardiovascular system, while a decrease, on the contrary, indicates an improvement [11].The Robinson Index characterizes the state of regulation of the cardiovascular system and reflects the degree of adaptation to loads. The Robinson Index characterizes the state of regulation of the cardiovascular system and was calculated using the formula: DP = HR × SAP / 100 [4,7]. According to the level of the Robinson Index at rest, the level of physical health and the functional state of the cardiovascular system are characterized as low at DP >111 conventional units, below average – 95–100 conventional units, average – 85–94 conventional units.Pulse pressure was calculated using the formula: PP = SAP – DAP, where SAP – systolic arterial pressure, mmHg; DAP – diastolic arterial pressure, mmHg. The mean dynamic pressure was calculated using the formula: MDP = DAP + 0.42PP, where DAP – diastolic pressure, mmHg; PP – pulse pressure, mmHg. Total peripheral resistance was calculated using the formula: TPR = MDP × 1333 × 60 / CO, where MDP – mean dynamic pressure, mmHg; CO – cardiac output, ml; 1333 – coefficient for conversion to dynes; 60 – number of seconds in a minute.Cardiac output (CO) was calculated using the formula: CO = SV × HR, where SV – stroke volume, ml; HR – heart rate, beats/min. The stroke volume value was determined by calculation using the formula: SV = 100 + 0.5PP – 0.6SAP – 0.6A, where PP – pulse pressure, mmHg; SAP – systolic arterial pressure, mmHg; A – age, years.The Functional Changes Index (FCI) is an indicator of the adaptive potential of the circulatory system. It was calculated using the following formula:FCI = 0.011×HR + 0.014×SAP + 0.008×DAP + 0.014×A + 0.009×BW – 0.009×H – 0.27,where HR – resting heart rate (beats/min), SAP – systolic arterial pressure (mmHg), DAP – diastolic arterial pressure (mmHg), A – age (years), BW – body weight (kg), H – height (cm).An FCI value up to 2.6 indicates satisfactory functioning of the circulatory system. An FCI from 2.6 to 3.1 indicates functional strain, from 3.1 to 3.5 – unsatisfactory function, and above 3.5 – a breakdown in the function of the circulatory system.To calculate the adaptive potential (AP), many authors use the equation of L.A. Konevskikh (Patent RU 2314019 “Method for Assessing Adaptive Potential” / L.A. Konevskikh, I.E. Oransky, E.I. Likhacheva) [3]:AP = 1.238 + 0.09×HR,where AP – adaptive potential in conventional units (points); HR – heart rate (beats/min); 1.238 and 0.09 – coefficients of the equation.If the value is less than 7.2 points, the adaptive potential is considered satisfactory. The tension of adaptive mechanisms is observed at values from 7.21 to 8.24 points. With AP values ranging from 8.25 to 9.85 points, adaptation is considered unsatisfactory, and values above 9.86 points indicate a breakdown of adaptive mechanisms.Statistical analysis methods included frequency analysis (%), variation statistics (arithmetic mean – M, standard error – ±m). To determine the significance of differences between mean values, Student’s t-test was used. Differences between mean arithmetic values were considered statistically significant at p ≤ 0.05.
3. Results and Discussion
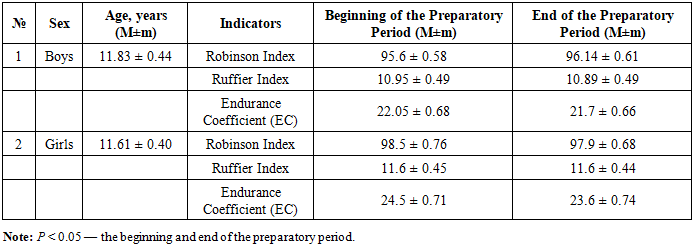
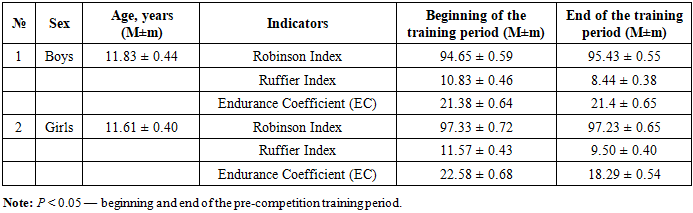
Functional tests make it possible to assess the general condition of the body, its reserve capacities, and the features of adaptation of various systems to physical loads [15]. One of the simplest tests is the Ruffier test, which helps to evaluate the level of adaptive reserves and the functional performance of the cardiovascular system using a single standardized physical load, based on heart rate values at different recovery times after exercise. Changes in heart rate ensure the adaptation of the circulatory system to the body’s needs and environmental conditions. The increase in heart rate follows a linear dependence: the better the heart is adapted to the load, the smaller the tachycardia after it, and vice versa [14]. Hence, there is an inverse relationship between the Ruffier index and performance capacity: the higher the Ruffier index, the poorer the adaptive capabilities of the cardiovascular system. High performance capacity serves as an indicator of stable health, while low values are considered a health risk factor [14,17].At the beginning and at the end of the preparatory training period, the Robinson Index in boys was below the average value, as in girls. However, in boys, the index increased by 0.56% by the end of the preparatory period. In girls, on the contrary, the Robinson Index decreased by 0.6%. This indicates that the systolic work of the heart and its functional capacity in the preparatory period improved in girls, unlike in boys.The Ruffier Index during the preparatory training period was assessed as satisfactory in both boys and girls, both at the beginning and at the end of this period. However, by the end of the preparatory period, this index decreased by 0.55% in boys, indicating an increase in physical performance, while in girls it remained stable.The endurance coefficient during the preparatory training period decreased dynamically in all athletes from the beginning to the end of the period: by 1.58% in boys and by 3.67% in girls, which indicates an improvement in the functional capabilities of the cardiovascular system of the athletes (Table 1).Table 1. Characteristics of Performance and Endurance Indicators of Young Swimmers during the Preparatory Training Period (M±m)
 |
| |
|
It is noteworthy that among young swimmers, the indices within the groups were inconsistent: in boys, an increase in the Robinson Index was observed in 16.6% of athletes, a decrease in 30%, and no dynamics in 53.3%. Among girls, a similar pattern was observed with the following ratio: 21.4%: 66%: 12.5%.The endurance coefficient within each study group also showed inconsistent dynamics: in boys, an increase in the index was observed in 8.3% of cases, a decrease in 38.3%, and no dynamics in 53.3% of athletes. Among girls, the corresponding ratio was 8.92%: 78.5%: 12.5%.The dynamics of the Ruffier Index from the beginning to the end of the preparatory period in boys were positive in 3.33% of cases, negative in 33.3%, and showed no change in 63.3% of male athletes. Among girls, an increase in the Ruffier Index was observed in 44.6% of cases, a decrease in 25%, and no dynamics were found in 30.3% of the participants (Figure 1).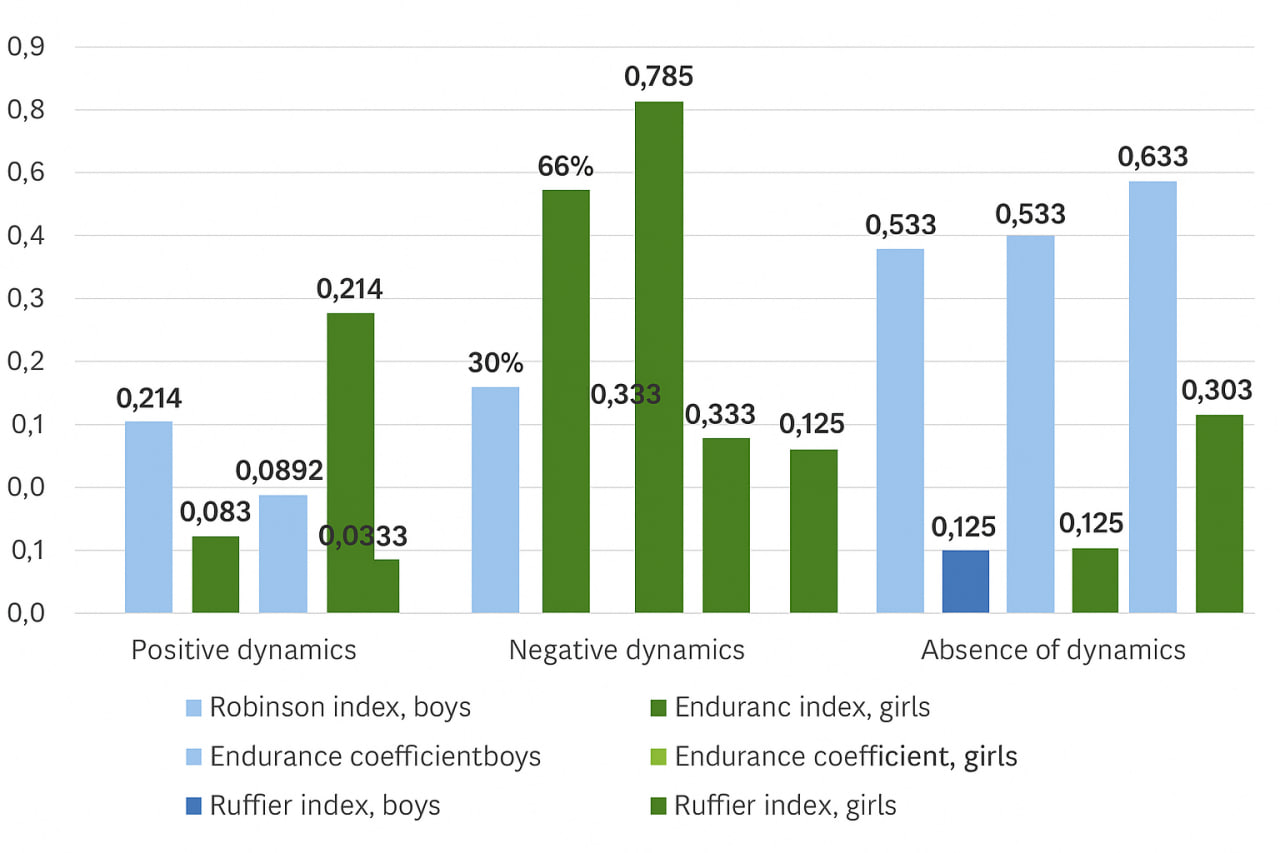 | Figure 1. The specific ratio of athletes with positive, negative, and absent dynamics of hemodynamic indices during the preparatory training period |
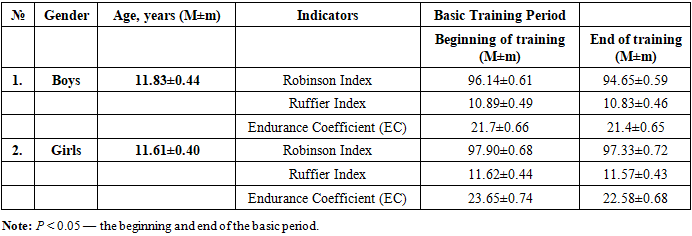
We conducted an analysis of the basic training period of the athletes. According to our research, it was found that both boys and girls demonstrated satisfactory physical performance at the beginning and at the end of the basic training period; however, by the end of this period, all indicators decreased, indicating an improvement in fitness levels.The Robinson Index (RI), or “double product,” is also used to assess the level of metabolic and energy processes in the myocardium. An increase in this criterion indicates an improvement in the contractile function of the heart and the overall condition of the circulatory system during physical exertion [5].In boys, the dynamics of this index during the basic training period ranged from below average to average values, whereas in girls, the index remained within below-average limits throughout the period. The Robinson Index decreased from the beginning to the end of the basic training period by 1.55% in boys and by 0.58% in girls, which indicates improved cardiac adaptation to physical loads during the basic training period.The next indicator of the state of the circulatory system, which depends on physical activity, is the endurance coefficient (EC), an integral value combining the heart rate (HR) and the values of systolic and diastolic blood pressure. Its increase indicates a weakening of the cardiovascular system, while its decrease reflects its strengthening.As shown in Table 2, the EC in boys corresponds to age norms both at the beginning and at the end of the basic training period, and in dynamics, a decrease in this index is observed, which indicates an enhancement of cardiovascular system activity. In girls, at the beginning of the basic training period, the EC value exceeds the norm for this age, however, by the end of the basic period, this index returns to normal, which indicates good adaptation of the cardiovascular system of girls by the end of the basic training period.Table 2. Characteristics of performance and endurance indicators of young swimmers during the basic training period (M±m)
 |
| |
|
It is noteworthy that among young swimmers, both boys and girls, the dynamics of the indices within the groups are ambiguous. As shown in Figure 2, an increase in the Robinson index from the beginning to the end of the basic training period was not observed; a decrease in this index was noted in 80% of athletes within the group, and in 20% there were practically no changes in the Robinson index by the end of the basic period. In girls, the following results were obtained: 12.5%: 60.7%: 26.7%, respectively.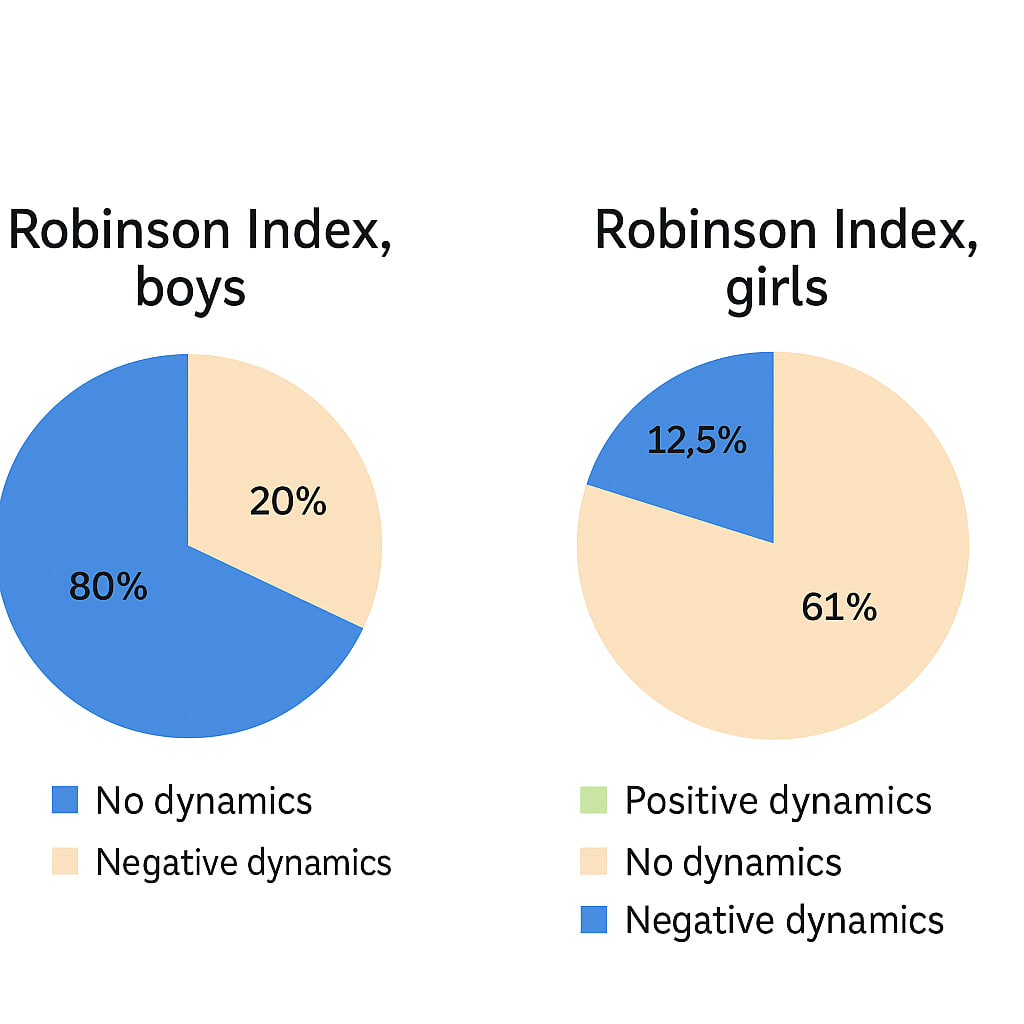 | Figure 2. The specific ratio of athletes with positive, negative, and no dynamics of the Robinson Index during the basic training period |
The dynamics of the Ruffier Index among boys showed a somewhat different pattern: in 16.6% of cases, the Ruffier Index increased, in 45% of swimmers it decreased, and in 38.3% it showed no changes. Among girls, this ratio was 10.7%: 35.7%: 53.5% (Figure 3).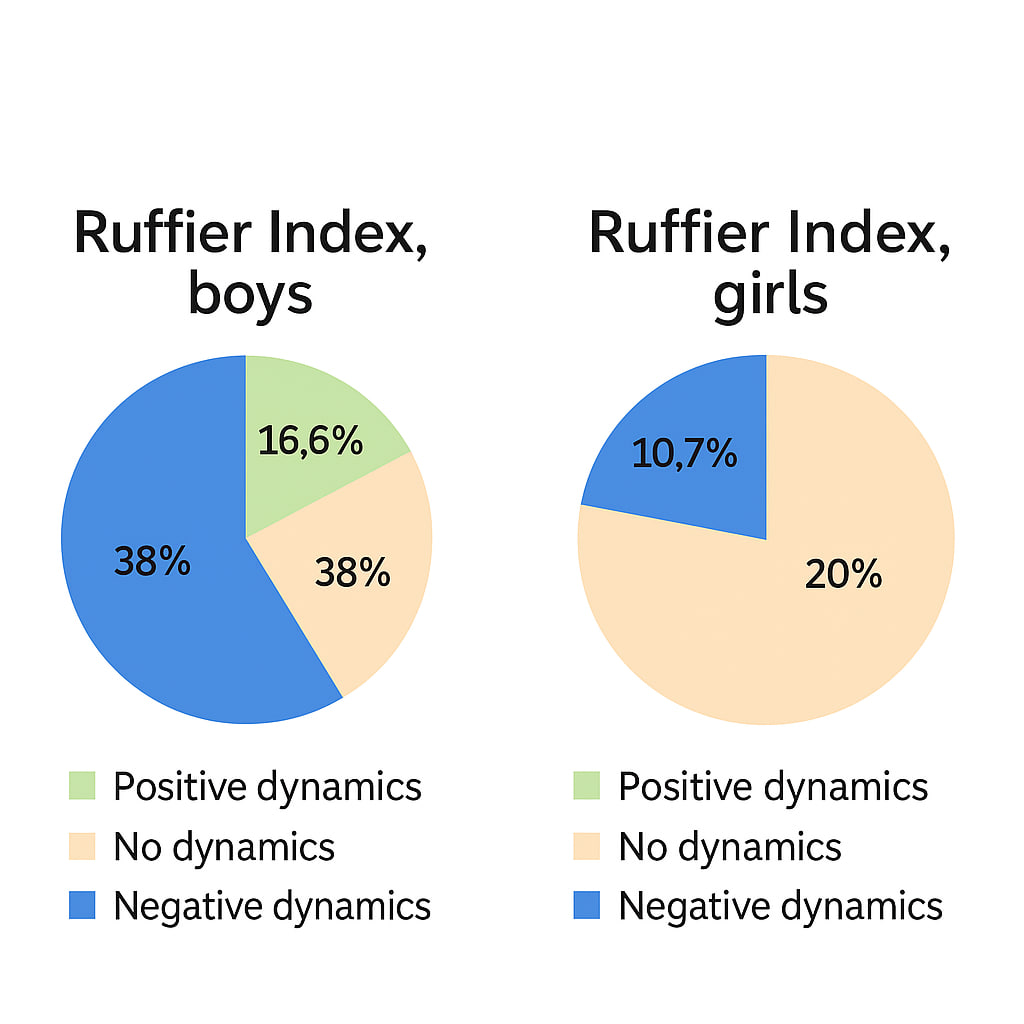 | Figure 3. The specific ratio of athletes with positive, negative, and no dynamics of the Ruffier Index during the basic training period |
The Endurance Coefficient (EC) in boys did not increase; 80% showed a negative trend, while 20% showed neither an increase nor a decrease in the index throuhout the basic training period. Among girls, this ratio was 5.3%: 67.8%: 26.7% (Figure 4). 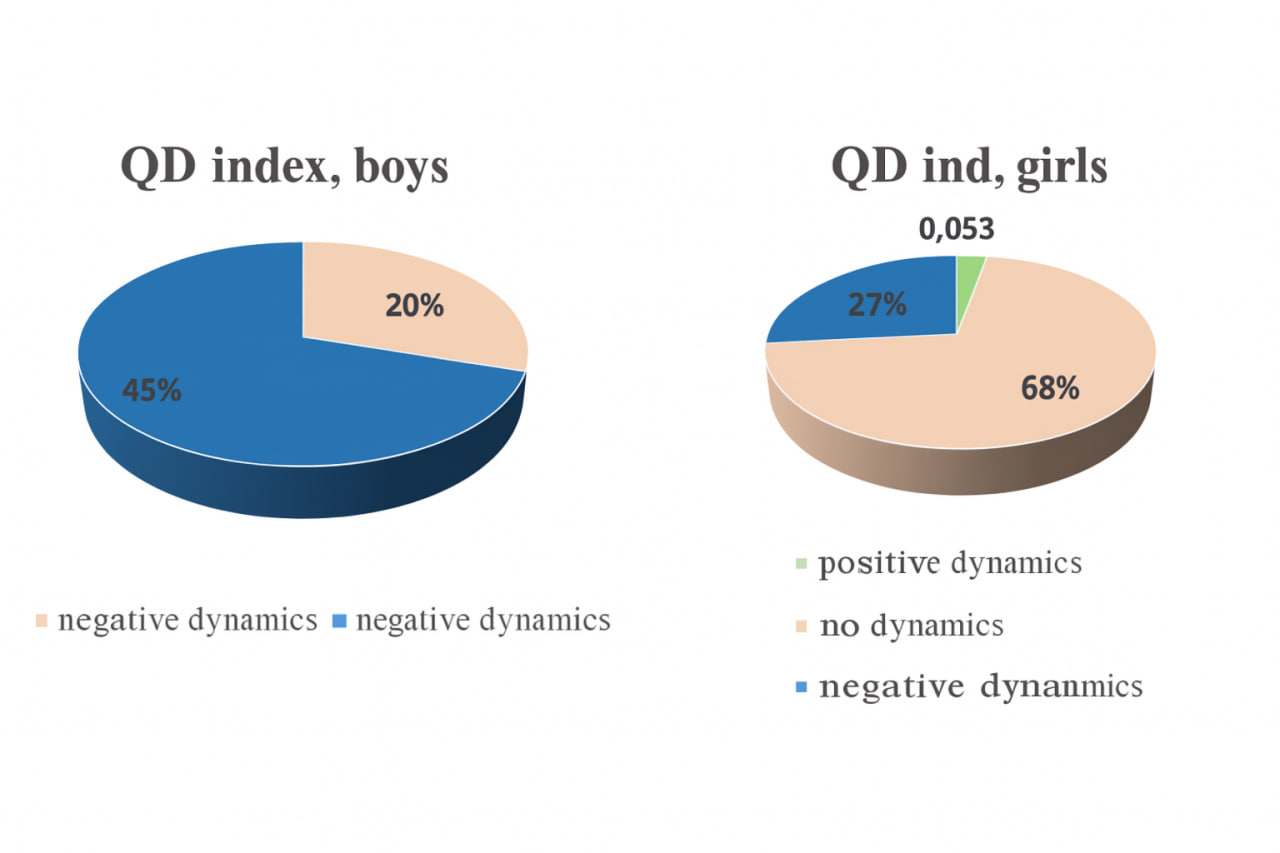 | Figure 4. The specific ratio of athletes with positive, negative, and no dynamics of the cardiovascular index during the basic training period |
If we analyze the indices across the two training periods, we can observe a decrease in the Ruffier index from the beginning of the preparatory period to the end of the basic training period in boys. In girls, the Ruffier index remains stable during the preparatory period, but by the end of the basic period, it decreases, indicating an improvement in physical performance.When assessing the dynamics of the Robinson index during the preparatory and basic training periods, there is an increase in the index among boys during the preparatory period and a decrease during the basic period, which indicates an improvement in endurance by the end of the basic period. In girls, starting from the preparatory period, a decrease in this index is observed by the end of the basic period, reflecting good adaptation and endurance among female athletes.The cardiovascular index (CI) showed a decreasing trend in both training periods for both boys and girls. Consequently, endurance among athletes in all groups significantly increased.In male swimmers, the Robinson index had average values at the beginning of the pre-competition period; however, by the end of this period, it fell within the below-average range, indicating cardiovascular system strain immediately before the competition. In female swimmers, the index remained within the below-average range both at the beginning and at the end of the pre-competition period. Nevertheless, it showed a decreasing trend starting from the basic training period.It is noteworthy that the dynamics of the Robinson index in boys display a wave-like pattern: the index increased by the end of the preparatory period, decreased by the end of the basic period, and again showed a tendency to rise immediately before the competitions.During the pre-competition period, the Ruffier index in boys improved from a satisfactory to a good level, which indicates an increase in their physical performance approaching the competitions. When analyzing from the preparatory stage, over the course of three periods, the physical performance of boys increased by 23.1%. In girls, although the Ruffier index remained within satisfactory values at all stages of preparation, it decreased by 18.1% by the competition stage — which, in our view, is still an acceptable result.The endurance coefficient among all athletes during the pre-competition period remained within normal limits, except for the girls at the beginning of this period, when a temporary decline in functional capacity was observed. However, if analyzed from the beginning of the preparatory period, endurance increased by 2.9% in boys and by 25.3% in girls.It is noteworthy that among young swimmers, both boys and girls, the dynamics of indices within the groups were inconsistent. In boys, an increase in the Robinson index was observed in 53.36% of athletes, a decrease in 31.6%, and no changes in 15%. In girls, the same indicator showed the following pattern: 41.07% increased, 58.9% decreased, and no cases without changes were observed.The endurance coefficient also demonstrated uneven dynamics within each group: in boys, an increase was recorded in 0%, a decrease in 98.3%, and no change in 1.6% of athletes. In girls, the corresponding figures were 5.3%, 94.6%, and 0%, respectively.The Ruffier index dynamics within each group were similarly variable: in 98.3% of boys, a decrease was recorded, in 1.6%, the index remained almost unchanged, and no positive dynamics were observed. Among girls, 1.78% demonstrated a positive trend from the beginning to the end of the pre-competition period, while 98.2% showed a decrease, with no cases of stability.Table 3. Characteristics of Performance and Endurance Indicators of Young Swimmers during the Pre-Competition Training Period (M±m)
 |
| |
|
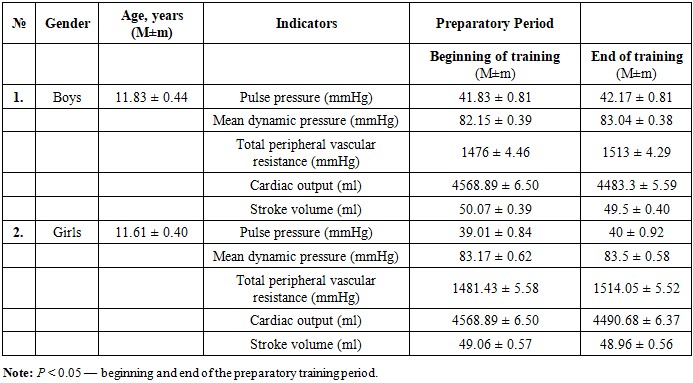
In physiological practice, after determining the values of heart rate (HR) and blood pressure (BP), special attention is given to calculating such indicators as pulse pressure (PP), mean dynamic pressure (MDP) according to the Hickam formula, total peripheral vascular resistance (TPR) according to the Poiseuille formula, and cardiac output (CO).Table 4. Characteristics of general hemodynamic indicators of young swimmers during the preparatory training period (M±m)
 |
| |
|
By the end of the preparatory training period, boys showed an increase in pulse pressure by 0.8%, mean dynamic pressure (MDP) by 1.1%, and total peripheral vascular resistance (TPVR) by 2.5%, along with a decrease in cardiac output (CO) by 1.8% and stroke volume (SV) by 1.14%. In girls, by the end of the preparatory period, there was an increase in pulse pressure by 2.53%, mean dynamic pressure by 0.39%, and total peripheral vascular resistance by 0.15%, with a decrease in cardiac output by 1.73% and stroke volume by 0.2% (Table 5).It should be noted that among young male and female swimmers, the dynamics of indices within the group were ambiguous for all athletes: in boys, an increase in pulse pressure was observed in 10% of athletes, a decrease in 8.33%, and no dynamics were observed in 81.6%. In girls, similar dynamics were observed in the following ratio: 16.07%:1.78%:82.14%.Positive, negative, and absent dynamic changes in mean dynamic pressure among boys had the following pattern: 12.2%:3.33%:76.6%, and in girls — 16.07%:1.78%:85.7%.An increase in total peripheral vascular resistance among boys was observed in 43.3% of cases, a decrease was found in 3.33% of athletes, and no changes by the end of the preparatory training period were observed in 53.3%. Among girls, the ratio of the above-mentioned changes was as follows: 76.78%:10.7%:12.5%.The minute blood volume in 1.66% of boys increased by the end of the preparatory training period, decreased in 27.45%, and remained unchanged in 53.3%. In girls, the above changes were in the ratio of 10.7%:76.78%:12.5%.The stroke volume in young male swimmers underwent the following changes: an increase in 3.33% of boys, a decrease in 20%, and no change in 76.6% of athletes. The stroke volume in girls also showed uneven dynamics: in 1.78% of cases, it increased, in 16.7% decreased, and in 82.1% of female athletes, no changes were found.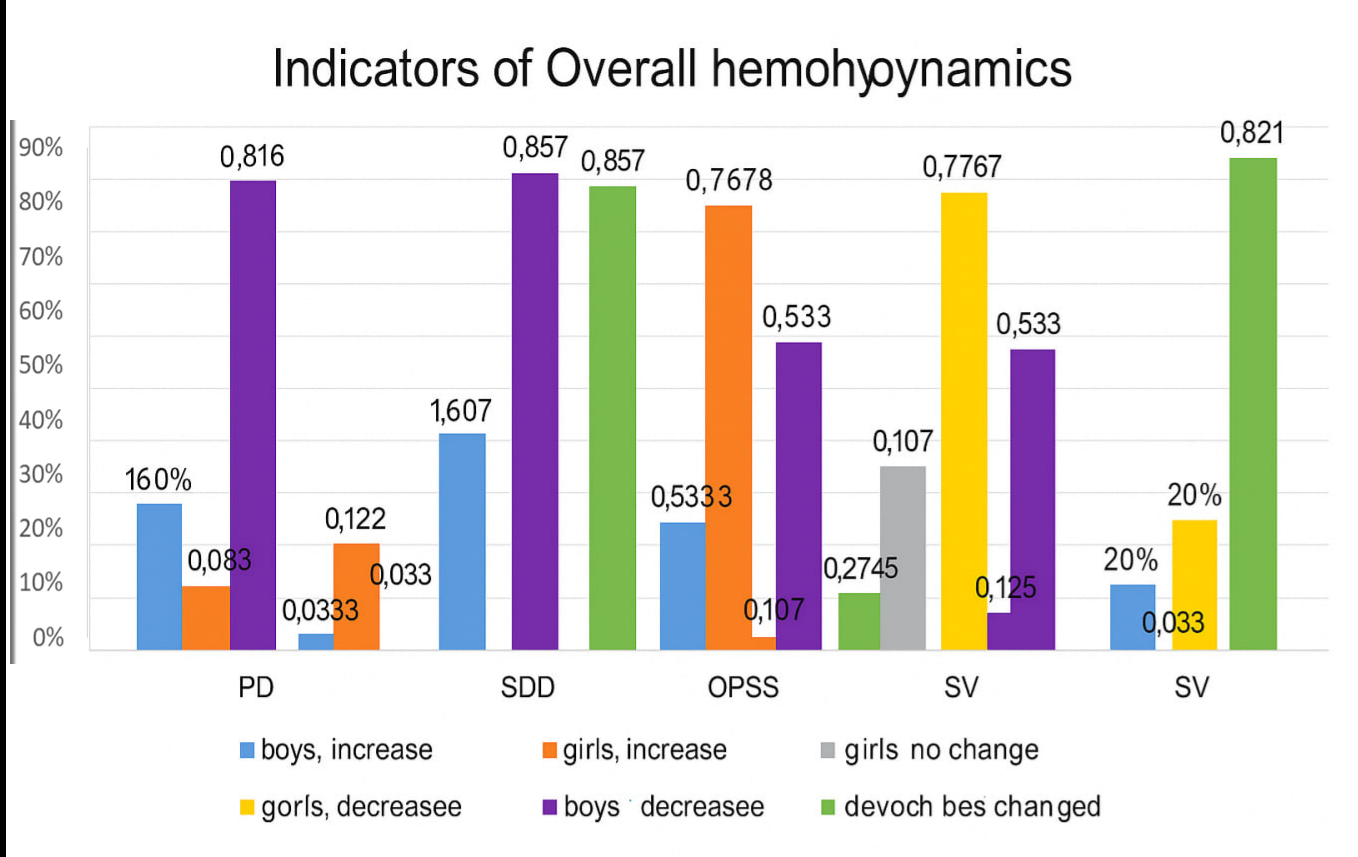 | Figure 5. The specific ratio of athletes with positive, negative, and no changes in general hemodynamic indicators during the preparatory training period |
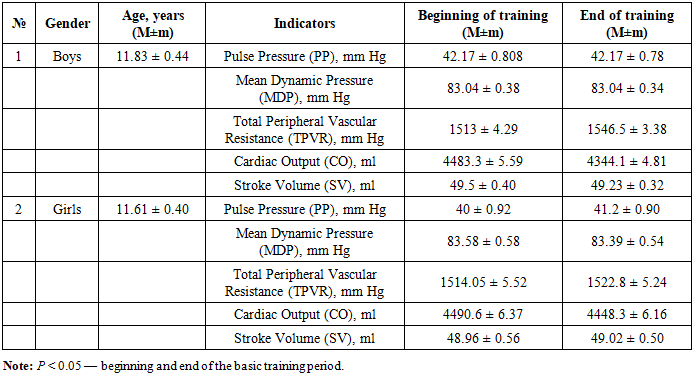
Table 5. Characteristics of general hemodynamic indicators of young swimmers during the basic training period (M±m)
 |
| |
|
By the end of the basic training period, in boys, the following hemodynamic indices were observed: pulse pressure and mean dynamic pressure remained practically unchanged, total peripheral resistance (TPR) increased by 2.21%, cardiac output (CO) decreased by 3.10%, and stroke volume (SV) decreased by 0.54%. In girls, by the end of the preparatory period, there was an increase in pulse pressure (PP) by 3%, TPR by 0.57%, SV by 0.125, and a decrease in systolic blood pressure (SBP) by 0.22%, CO by 0.94% (Table 5).It is noteworthy that among young swimmers, the dynamics of indices within each group were inconsistent. In girls, an increase in pulse pressure was observed in 19.6% of cases, while in 80.3% of athletes, the indicator remained almost unchanged from the beginning to the end of the basic training period. SBP increased in 10.7% of girls, decreased in 16.07%, and remained practically unchanged in 73.2%.An increase in total peripheral resistance was observed in 95% of boys, no decrease was detected, and no change by the end of the basic training period was observed in 3.5% of athletes. In girls, the distribution of these changes was as follows: 53.5%: 19.6%: 26.7%.Cardiac output in boys did not increase during the basic training period; it decreased in 96.6% and remained unchanged in 3.33%. In girls, the distribution of these changes was as follows: 19.6%: 53.5%: 26.7%.Stroke volume in male swimmers did not increase; in 50% it decreased and in 50% it remained practically unchanged. In girls, stroke volume also changed inconsistently: it increased in 16.07% of cases, decreased in 32.1%, and remained unchanged in 51.7% of athletes.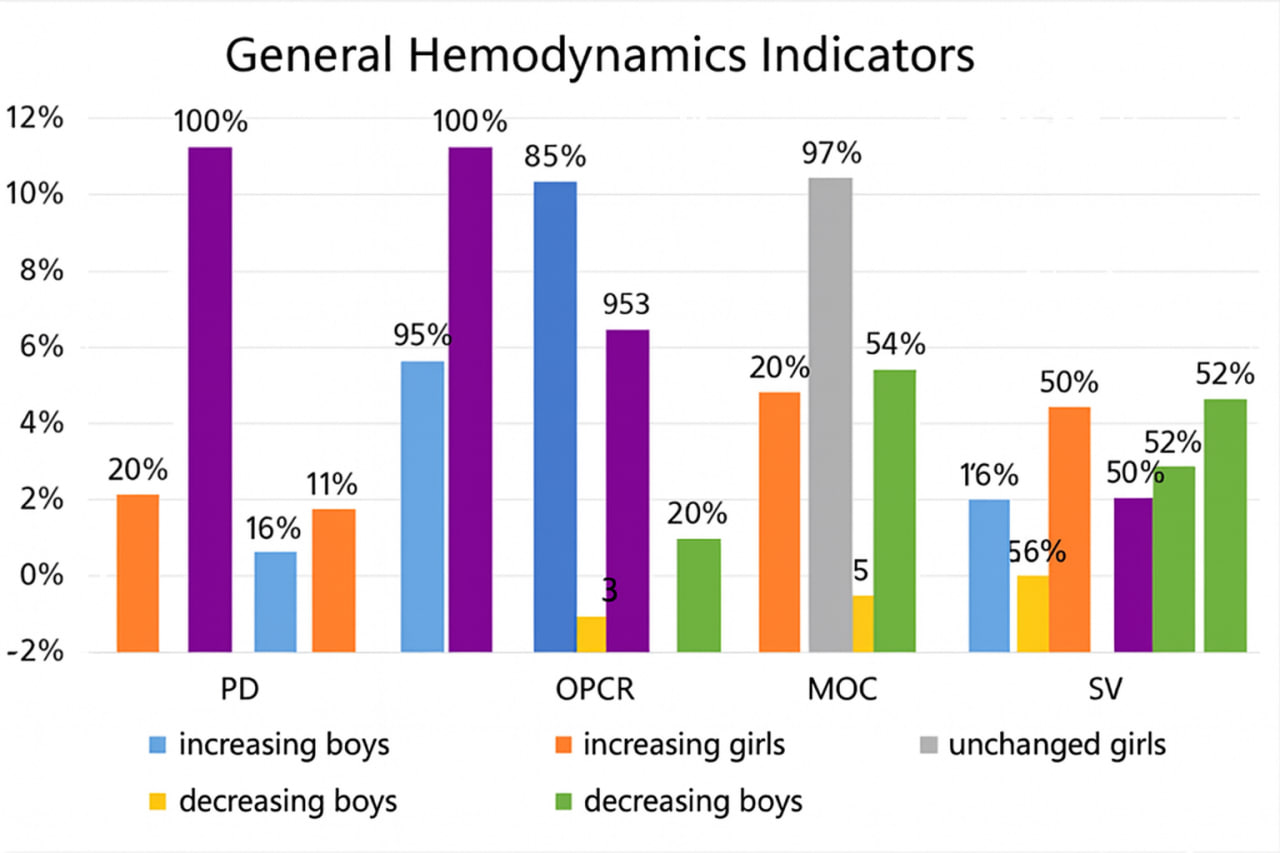 | Figure 6. Relative distribution of athletes with positive, negative, and unchanged indicators of overall hemodynamics during the basic training period |
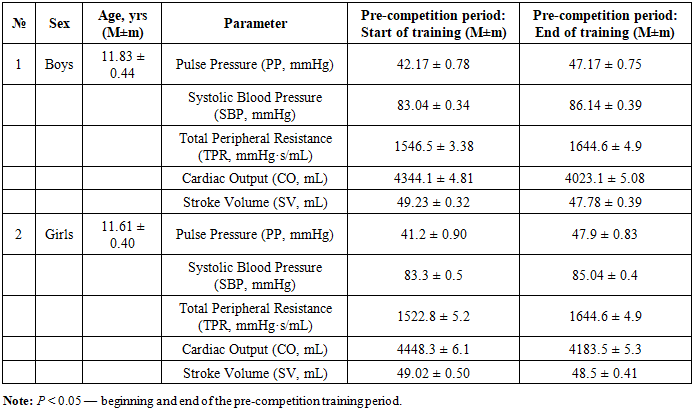
Table 6. Characteristics of overall hemodynamic indicators in young swimmers during the pre-competition period of their training (M ± m)
 |
| |
|
By the end of the pre-competition training period, in boys, pulse pressure (PP) remained unchanged, mean dynamic pressure increased by 3.73%, total peripheral resistance (TPR) increased by 0.41%, while cardiac output (CO) decreased by 7.38% and stroke volume (SV) decreased by 2.94%. In girls, by the end of the pre-competition period, there was an increase in PP by 16.26%, systolic blood pressure (SBP) by 2.08%, TPR by 7.99%, and a decrease in SV by 1.06% and CO by 0.13% (Table 6).It is noteworthy that the dynamics of hemodynamic indices within each group were inconsistent. In boys, an increase in PP was observed in 66% of cases, a decrease in 3.57%, and no change in 30.3% of athletes. In girls, PP increased in 66% of cases, decreased in 3.57%, and remained practically unchanged in 30.3%.SBP increased in 57.1% of boys, decreased in 17.8%, and remained almost unchanged in 25%. In girls, SBP increased in 57.1%, decreased in 17.8%, and remained unchanged in 25% of athletes.An increase in TPR was observed in 91.07% of boys, while a decrease was detected in 8.9%. In girls, the distribution of these changes was identical: 91.07%: 8.9%. No athletes, either boys or girls, showed unchanged TPR by the end of the pre-competition period.CO in boys increased in 7.14% of cases and decreased in 92.8%. In girls, the distribution was the same: 7.14%: 92.8%. No athletes in either group showed unchanged CO by the end of the pre-competition period.Stroke volume in male swimmers increased in 23.2% of cases, decreased in 60.7%, and remained practically unchanged in 16.07%. In girls, SV changed similarly: it increased in 23.2%, decreased in 60.7%, and remained unchanged in 16.07% of athletes.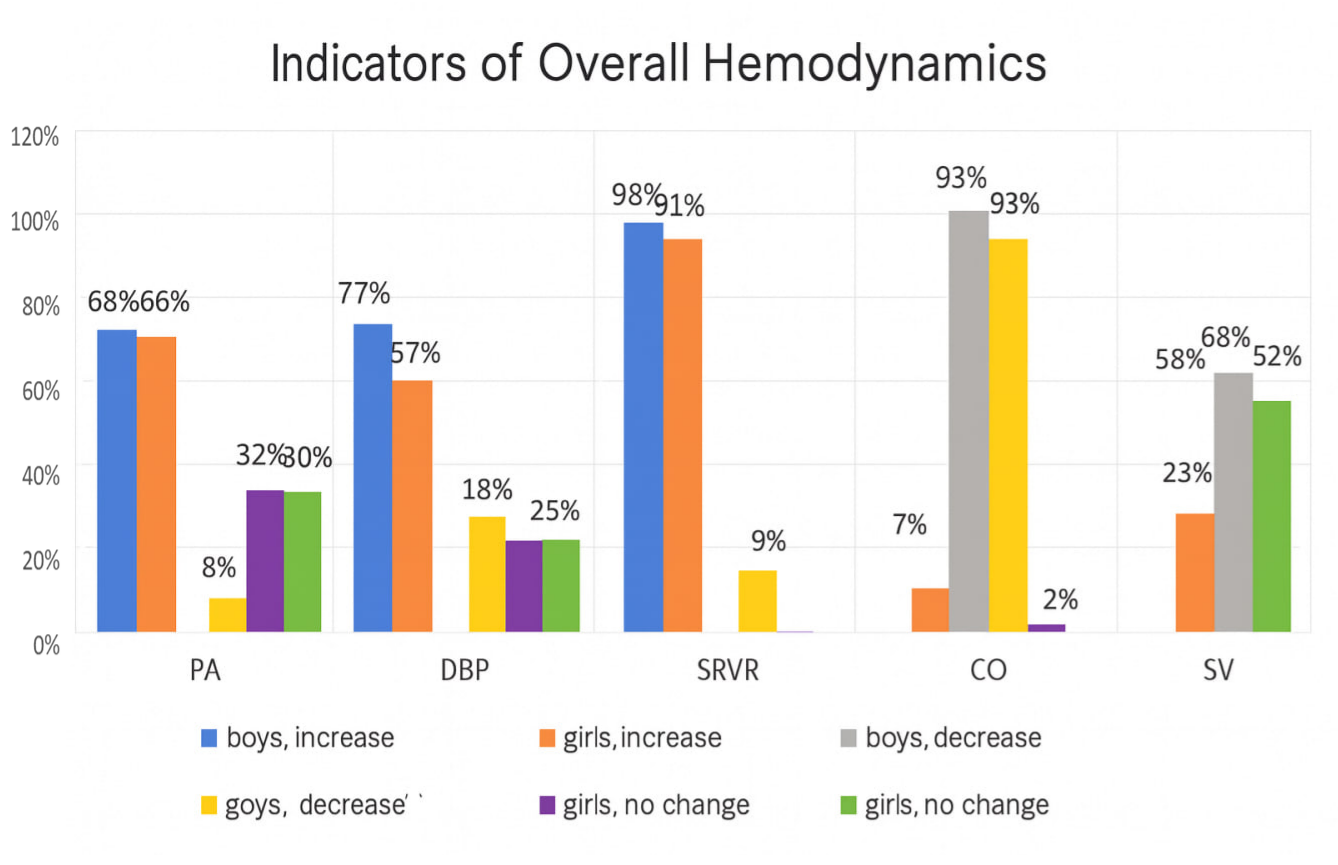 | Figure 7. Relative distribution of athletes with positive, negative, and unchanged indicators of overall hemodynamics during the pre-competition training period |
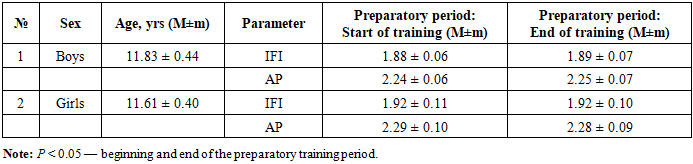
Table 7. Characteristics of overall hemodynamic indicators in young swimmers during the preparatory period of their training (M ± m)
 |
| |
|
By the end of the preparatory period, in boys, the Individual Functional Index (IFI) remained practically unchanged, increasing only by 0.53%, while Adaptation Potential (AP) increased slightly by 0.44%. In girls, IFI did not change from the beginning to the end of the preparatory period, and AP increased by 0.44% (Table 7).It is noteworthy that the dynamics of indices within each group were inconsistent. In boys, IFI increased in 20% of cases, decreased in 21.6%, and remained unchanged in 58.3%. In girls, IFI increased in 21.4% of cases, decreased in 53.5%, and remained practically unchanged in 14.25% of athletes.AP in boys increased in 20% of cases, decreased in 18.3%, and remained practically unchanged in 61.6%. In girls, AP increased in 21.4%, decreased in 60.7%, and remained unchanged in 17.85% of athletes.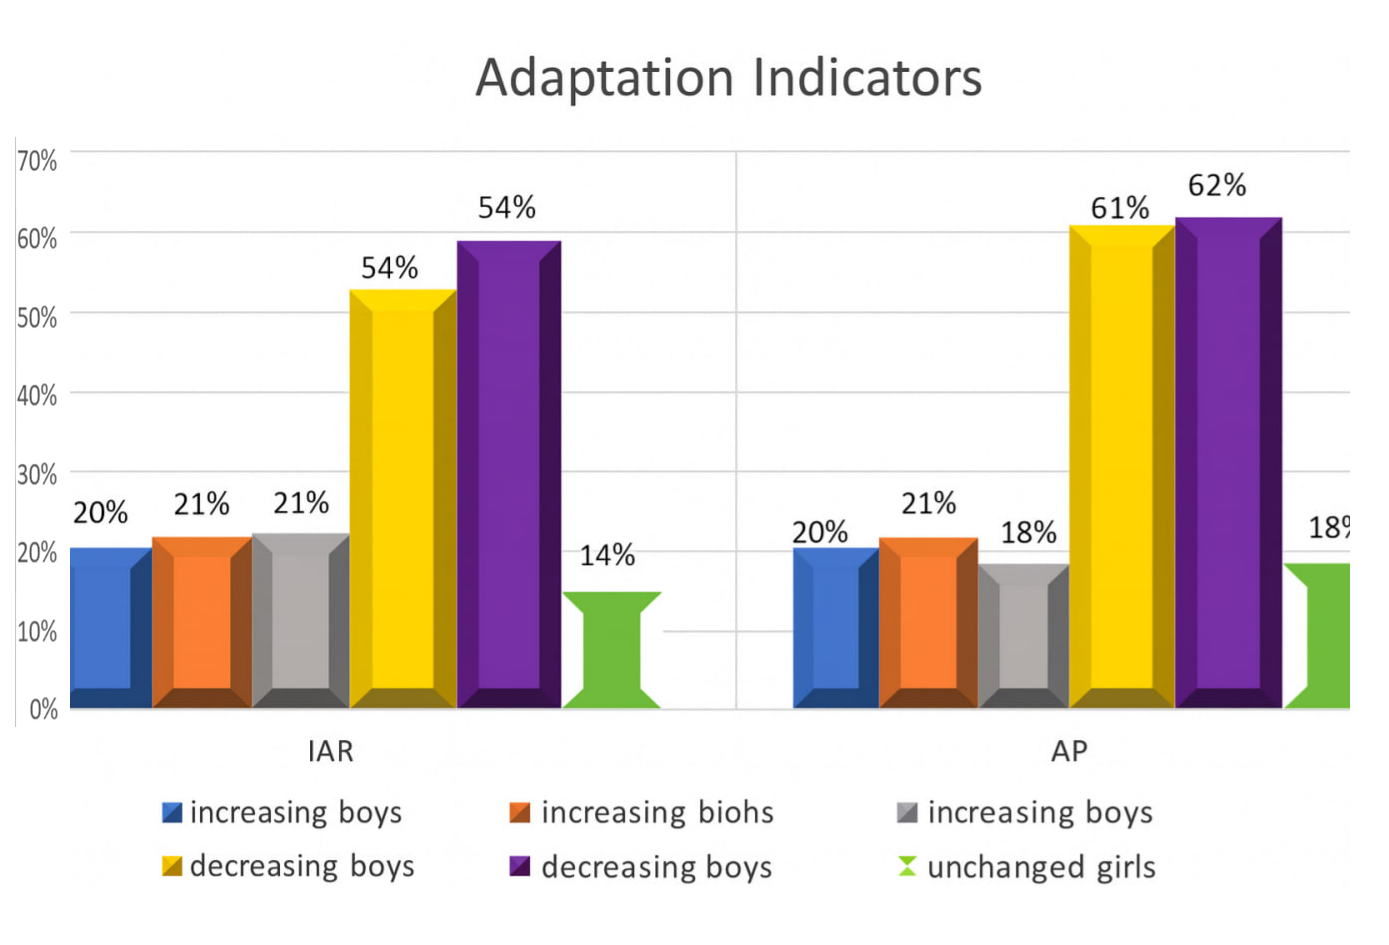 | Figure 8. Relative distribution of athletes with positive, negative, and unchanged adaptation indicators during the preparatory training period |
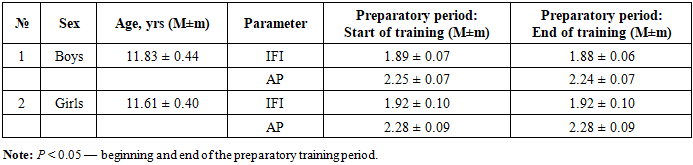
Table 8. Characteristics of overall hemodynamic indicators in young swimmers during the basic period of their training (M ± m)
 |
| |
|
By the end of the basic training period, in boys, the Individual Functional Index (IFI) decreased by 0.53%, and Adaptation Potential (AP) decreased by 0.44%. In girls, IFI and AP remained unchanged from the beginning to the end of the basic period (Table 8).It is noteworthy that the dynamics of indices within each group were inconsistent. In boys, IFI increased in 11.6% of cases, decreased in 43.3%, and remained unchanged in 45%. In girls, IFI increased in 35.7% of cases, decreased in 44.6%, and remained practically unchanged in 19.6% of athletes.AP in boys increased in 3.3% of cases, decreased in 56.6%, and remained practically unchanged in 40%. In girls, AP increased in 30.3% of cases, decreased in 44.6%, and remained unchanged in 25% of athletes.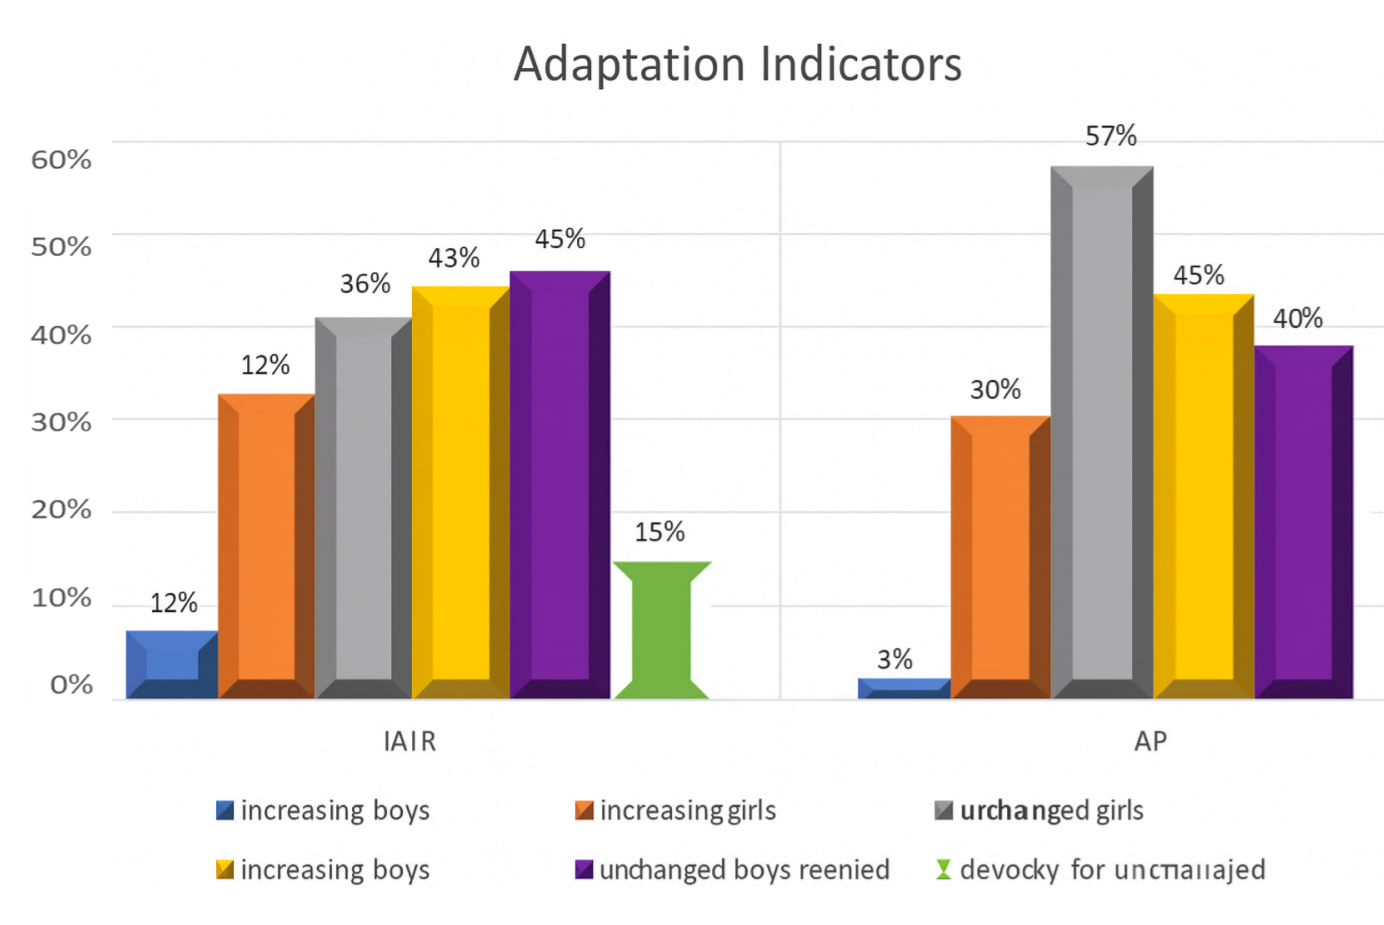 | Figure 9. Relative distribution of athletes with positive, negative, and unchanged adaptation indicators during the basic training period |
Table 9. Characteristics of overall hemodynamic indicators in young swimmers during the pre-competition period of their training (M ± m)
 |
| |
|
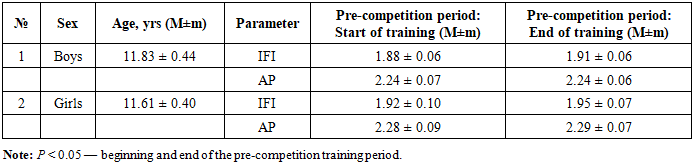
By the end of the pre-competition period, in boys, the Individual Functional Index (IFI) increased by 1.59%, while Adaptation Potential (AP) remained unchanged. In girls, IFI increased by 1.56% and AP by 0.44% (Table 9).It is noteworthy that the dynamics of indices within each group were inconsistent. In boys, IFI increased in 53.3% of cases, decreased in 31.6%, and remained unchanged in 15%. In girls, IFI increased in 50% of cases, decreased in 41%, and remained practically unchanged in 8.9% of athletes.AP in boys increased in 46.6% of cases, decreased in 38.3%, and remained practically unchanged in 15%. In girls, AP increased in 42.8%, decreased in 51.7%, and remained unchanged in 5.3% of athletes.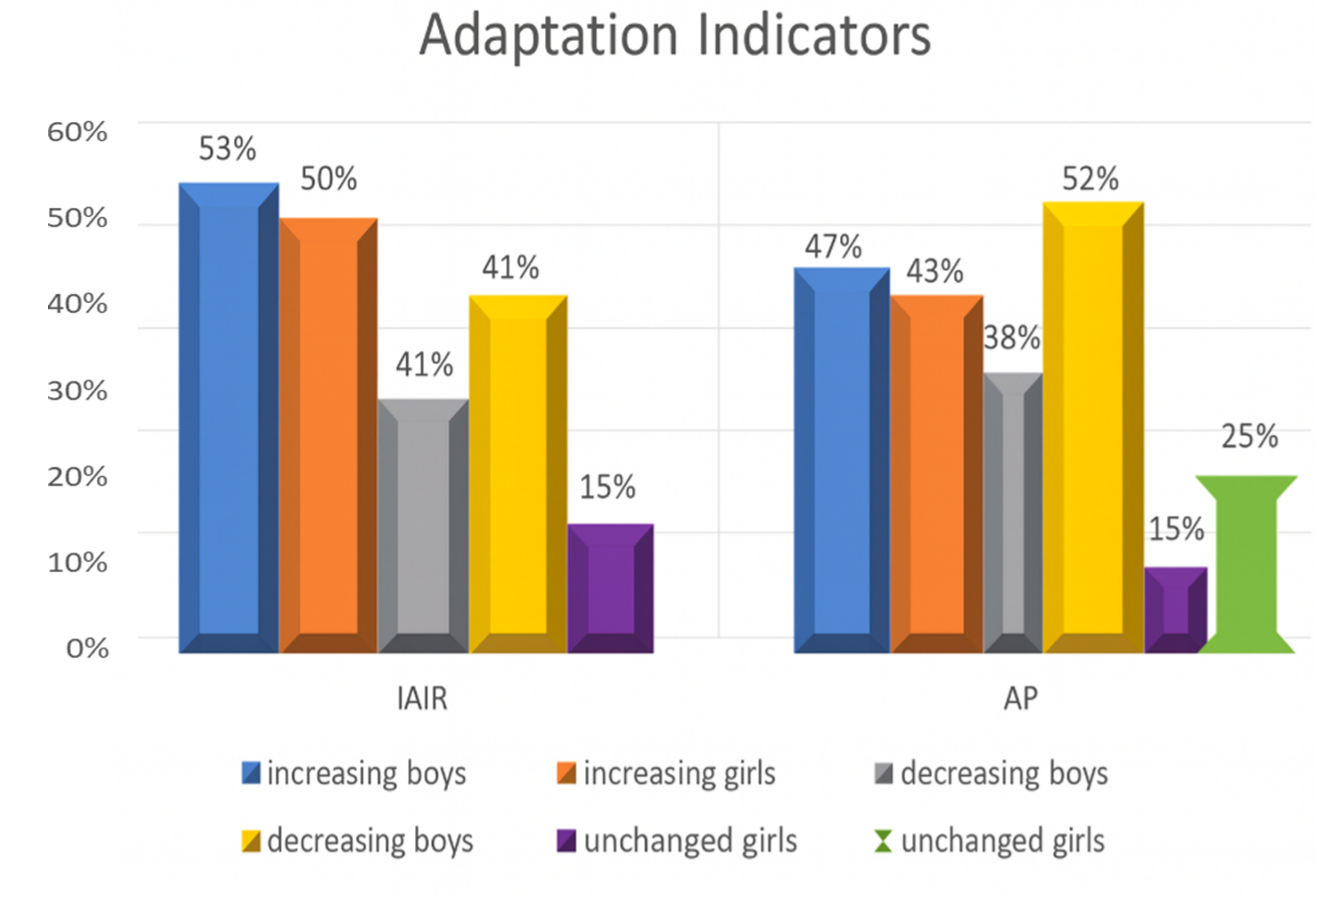 | Figure 10. Relative distribution of athletes with positive, negative, and unchanged adaptation indicators during the basic training period |
4. Conclusions
Analysis of the dynamics of hemodynamic indices demonstrated that all athletes experienced improvements in physical performance, endurance, and cardiovascular system adaptation to physical loads throughout the training process. Gender differences in swimmers’ adaptation were identified: endurance improvement was more pronounced in girls, whereas boys showed a greater increase in physical performance across the three periods of training leading up to competitions.
References
| [1] | Abzalov R.A., Ziyatdinova A.I., Abzalov N.I. Regulation of the pumping function of the heart in a developing organism. I.M. Sechenov Russian Physiological Journal, 2004, Vol. 90, No. 8, p. 174. |
| [2] | Alekseeva V.A., Guryeva A.B. Functional state of the cardiovascular system of Yakut athletes engaged in martial arts aged 14–19 years. Human. Sport. Medicine., 2022, Vol. 22, No. S2, pp. 30–36. DOI: 10.14529/hsm22s204. |
| [3] | Garkavi L.Kh., Kvakina E.B., Kuzmenko T.S. Antistress Reactions and Activation Therapy. In: Antistress Reactions and Activation Therapy. Moscow: Kniga po Trebovaniyu Publishing, 2015, p. 559(4). |
| [4] | Zulkarnaev T.R., Agafonov A.I., Kazak A.A., Khisamiev I.I., Povargo E.A., Zulkarnaeva A.T. Hygienic assessment of hemodynamic indicators in schoolchildren and students with different levels of physical activity. Hygiene of Children and Adolescents., February, No. 2 (311), 2019, pp. 19–25. |
| [5] | Ikramov A.I. Medical Foundations of Physical Education and Sports in the Formation of a Harmoniously Developed Generation. Methodological Guide. Tashkent, 2011. |
| [6] | Kozukova V.K. Dynamics of total peripheral vascular resistance during the year in women. Eurasian Union of Scientists – Monthly Scientific Journal Publication Archive, 2019. DOI: 10.31618/ESU.2413-9335.2019.2.64.242. |
| [7] | Korelskaya I.E., Vorontsova E.N. Assessment of the cardiovascular system of young athletes engaged in skiing and permanently residing in the northern region of Russia. Scientific Review. Biological Sciences., 2018, No. 2, pp. 15–20. URL: https://sciencebiology.ru/ru/article/view?id=1097 DOI: 10.17513/srbs.1097. |
| [8] | Kolomeichuk S.N., Alekseev R.V., Putilov A.A., Meygal A.Yu. Association of polymorphic variants of the ACE and BDKRB2 genes with parameters of heart rate variability in athletes of the Republic of Karelia. Bulletin of the Russian State Medical University, 2017, No. 4, pp. 50–58. DOI: 10.24075/brsmu.2017-04-08(9). |
| [9] | Kuzina E.N., Mozzhukhina L.I., Kondratyeva G. Evaluation of physical health indicators of preschool and school-age children with acute and chronic respiratory pathologies using functional research methods. Perm Medical Journal, 2013, Vol. XXX, No. 1, p. 81. |
| [10] | Chebanu S.I., Deleu R.D., Tabyrca A.V., Tafuni O.I., Friptulyak G.E. Functional state of the body of young athletes engaged in sports games. Hygiene and Sanitation., 2021, Vol. 100, No. 3, pp. 268–273. DOI: 10.47470/0016-9900-2021-100-3-268-273. |
| [11] | Chyornaya N.L., Ganuzina G.S., Lebedeva L.A. Evaluation of the effectiveness of health improvement of children in suburban stationary recreation and health institutions: methodological recommendations. Yaroslavl, 2009, p. 5. |
| [12] | Bergeron M.F. Healthy and sustainable youth sports – the future of youth athlete development. Sports Science Exchange, 2017, 28(176): 1–6. |
| [13] | Chutko L.S., Kornishina T.L., Surushkina S.Yu., et al. Syndrome of autonomic dysfunction in children and adolescents. Journal of Neurology and Psychiatry named after S.S. Korsakov, 2018, No. 118 (1), pp. 43–49. DOI: 10.17116/jnevro20181181143-49. |
| [14] | Larionova N.N., Zhmyrko I.N. Determining functional indicators of students as a factor of readiness to pass physical education standards. Academic Bulletin of the Rostov Branch of the Russian Customs Academy., 2015, No. 1 (18), pp. 77–81. |
| [15] | Lupanov V.P., Nuraliev E.Yu. Functional Load Tests in the Diagnosis of Ischemic Heart Disease. Petrozavodsk: IntelTek Group LLC, 2012. 224 p. |
| [16] | Rakhimov M.I. Peculiarities of chronotropic heart reaction among children and adolescents after physical activity. Fundamental Research, 2015, No. 2–16, pp. 3536–3538. |
| [17] | Shutova T.N. Planning of physical and health technologies for economics students based on the analysis of cardiac muscle performance. Plekhanov Scientific Bulletin, 2017, No. 1 (11), pp. 199–204. |

 Abstract
 Reference
 Full-Text PDF
 Full-text HTML