American Journal of Medicine and Medical Sciences

p-ISSN: 2165-901X    e-ISSN: 2165-9036

2025;  15(10): 3568-3573

doi:10.5923/j.ajmms.20251510.61

Received: Sep. 19, 2025; Accepted: Oct. 17, 2025; Published: Oct. 28, 2025


Comprehensive Diagnostics of Cognitive and Emotional Disorders in Children and Adolescents with Type 1 Diabetes

Alidjanova Durdona Abdullajonovna

Doctor of Medical Sciences, Associate Professor, Department of Neurology, Pediatric Neurology, and Medical Genetics, Tashkent State Medical University, Tashkent, Uzbekistan

Correspondence to: Alidjanova Durdona Abdullajonovna, Doctor of Medical Sciences, Associate Professor, Department of Neurology, Pediatric Neurology, and Medical Genetics, Tashkent State Medical University, Tashkent, Uzbekistan.

Email:

Copyright © 2025 The Author(s). Published by Scientific & Academic Publishing.

This work is licensed under the Creative Commons Attribution International License (CC BY).
http://creativecommons.org/licenses/by/4.0/

Abstract

This article contains data from the analysis of neuropsychological, laboratory, and neuroimaging examination methods related to the issue of cerebral complications in type 1 diabetes in children. It presents data from our own studies on psychological testing, methods for assessing situational (SA) and personal (PA) anxiety, as well as an analysis of the content of neuropeptides and major brain metabolites. According to the results obtained, it can be concluded that the proposed set of diagnostic measures using modern research methods in the diagnosis of cognitive and emotional changes at early stages of this pathology is justified and appropriate, as they provide a real opportunity to monitor changes in brain tissue and visualize brain metabolism deviations that lead to cerebral disorders at a stage when clinical manifestations are not yet observed.

Keywords: Cognitive deficit, Children and adolescents, Diabetes mellitus, Neuron-specific proteins, Proton magnetic resonance spectroscopy

Cite this paper: Alidjanova Durdona Abdullajonovna, Comprehensive Diagnostics of Cognitive and Emotional Disorders in Children and Adolescents with Type 1 Diabetes, American Journal of Medicine and Medical Sciences, Vol. 15 No. 10, 2025, pp. 3568-3573. doi: 10.5923/j.ajmms.20251510.61.

1. Introduction

Diabetes mellitus (DM) is classified as an autoimmune pathology of the endocrine system. The development of DM occurs due to an absolute or relative insulin deficiency, induced by the disintegration of pancreatic beta cells. Today, DM represents a serious problem for the global medical community, as it continues to rank among the leading causes of reduced quality of life and early disability due to long-term complications [1]. Among the wide range of complications of type 1 DM in children, changes in the brain take a special place, primarily manifesting as cognitive impairments (CIs). Close attention to cognitive function in diabetes is associated not only with the normal daily functioning and social adaptation of the child but also with regular adequate self-monitoring of glycemia, which directly affects the overall course of the primary disease [2]. Currently, the early diagnosis of cognitive impairment in patients with diabetes mellitus is one of the priority areas in modern neuropathology [3]. In the diagnosis of higher cortical function disorders, such as memory, attention, and thinking deficits, neuropsychological testing methods hold a dominant position. However, it must be taken into account that these methods still provide a subjective assessment, with both false-positive and false-negative results, and are unable to offer complete reliable information on all criteria of cognitive impairment [4]. Therefore, the issue of adequate and early diagnosis of these disorders, with objective criteria that most accurately indicate the localization of the pathological focus causing cognitive changes, is considered quite relevant not only for neurologists but also for specialists in other areas of medicine. According to this, the primary task today is to identify the risks of developing cognitive dysfunctions long before they arise. The development and implementation of a clear algorithm for predicting cognitive deficit at the stage when there are no clinical signs can address this task and guide specialists in prescribing appropriate preventive therapy, which, in turn, will help maintain higher cortical functions at a satisfactory level for a fairly long period [5].
Neurospecific proteins are tissue-specific for the nervous system and, histo-genetically, are part of neurons and glial cells. In blood serum, low concentrations of these proteins are considered normal; this occurs due to the natural death of neurons, as well as pathological changes. Therefore, elevated levels of neurospecific proteins are regarded as markers of various pathological processes in the brains of adults and children, among which epilepsy, traumatic brain injury (TBI), diabetes, consequences of hypoxia, autism, and Parkinson's disease are somewhat better studied. Among the total number of known neurospecific proteins, the most studied are protein S-100 and neuron-specific enolase (NSE), which, according to scientists, provide greater information about the state of the pathological process and may be useful in studying the pathogenesis of neurological dysfunction, including in children and adolescents with type 1 diabetes [8].
The use by specialists in practical activities of a method such as proton magnetic resonance spectroscopy (¹H-MRS) has provided a means for non-invasive and in vivo analysis of metabolic abnormalities occurring in the brain in various neurological pathologies. The basis of this neuroimaging technique is the so-called 'chemical shift' of the resonance frequencies of different chemical compounds. To date, two methods of magnetic resonance (MR) spectroscopy have been developed: single-voxel and multi-voxel spectroscopy. The first spectroscopy method provides a rapid analysis of the biochemical composition of a limited volume in the area of interest in the brain. The second method is based on the use of the so-called color mapping, which covers a fairly large area of the brain with a multi-voxel volume, allowing for the simultaneous focus on 16 to 64 voxels, including both the damaged brain tissue and the contralateral hemisphere, with demonstration at various anatomical levels [9]. The main metabolites studied in MR spectroscopy are N-acetylaspartate (NAA), choline (Cho), and creatine (Cr). In addition to assessing their absolute concentrations, their ratios are also determined, namely N-acetylaspartate to creatine (NAA/Cr); choline to creatine (Cho/Cr); and choline to N-acetylaspartate (Cho/NAA) [10]. According to experts working on cognitive disorders across various nosological entities, the sensitivity, specificity, and significant prognostic value for detecting cognitive deficits using MR spectroscopy are 89.8%, 88.2%, and 95.3%, respectively [11]. Numerous scientific studies confirm the high significance of the aforementioned methods in studying cognitive deviations associated with various diseases in both adults and children. However, despite this, there remain many questions that require more precise definitions and clarifications. This circumstance primarily concerns childhood and adolescence, when the issue of early diagnosis of cognitive disorders is particularly acute and of vital importance [12].
Research objective: To study the role of biomarkers in the earliest diagnosis of cognitive deficit in children and adolescents with type 1 diabetes.

2. Materials and Methods

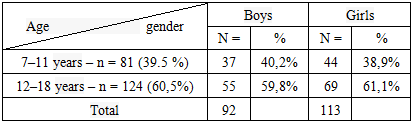
An examination was conducted on 205 children aged 7 to 18 years with type 1 diabetes mellitus (T1DM), including 92 boys (45%) and 113 girls (55%). Children aged 7 to 11 years (mean age 9.0±1.6 years) accounted for 81 patients (39.5%), while 124 patients aged 12 to 18 years (mean age 14.7±1.8 years) were examined (60.5%) (Table 1).
Table 1. Distribution of examined patients by age (according to the classification of N. P. Gundobin, modified by A. V. Mazurin and I. M. Vorontsov, 1985) and gender
     
As part of the study, all patients underwent a comprehensive clinical and neurological examination with a detailed analysis of their medical history. Cognitive disorders were assessed using the Montreal Cognitive Assessment (MoCA) [13]. The study of the emotional sphere was conducted using the method for assessing situational (ST) and personal (LT) anxiety by C.D. Spielberger – Y.L. Khanin. The blood glucose level was determined using the glucose oxidase method on a Hitachi 912 biochemical analyzer (Hoffmann-La Roche Ltd / Roche Diagnostics GmbH, Germany). The content of glycated hemoglobin (HbA1c) in capillary blood was determined by liquid chromatography on a DS5 Glycomat analyzer (DrewScientific, Netherlands). The assessment of S-100 protein and neuron-specific enolase levels in blood serum was carried out using fasting blood drawn from the cubital vein into Vacutainer vacuum tubes. Serum concentrations of the analytes were determined using enzyme-linked immunosorbent assay (ELISA) kits from CanAg S100 EIA (Sweden) for S-100 protein and kits from CanAg Diagnostics (Sweden) for neuron-specific enolase (NSE). Brain MRS was performed immediately after brain MRI, without changing the device or the child's body position, with a relaxation time TE = 135 ms, and a voxel volume of 1.5 cm³. In the specified regions, the main spectra of NAA, Cho, Cr, and their ratios were identified. The choice of mathematical methods depended on the specific tasks in each case and the requirements for processing medical data [15].

3. Results and Discussion

In the comparative assessment of HbA1c values considering the duration of the disease, we found that in the first 1.5–2 years from the onset of diabetes, glycated hemoglobin levels were significantly lower, averaging 8.5%. In the group with a disease duration of 3 to 6 years, or more precisely by the middle of the third year of diabetes, carbohydrate metabolism indicators worsened, and their average values were significantly higher than in children with a disease duration of up to 3 years – 9.4% (p < 0.001). In patients with a longer duration of diabetes, the trend toward worsening HbA1c levels persisted and was on average significantly higher – 10.4% (p < 0.001) than in groups with shorter disease duration.
During the analysis of individual tasks of the MoCA test, it was determined that patients with type 1 diabetes performed significantly worse on the 'clock' (p<0.001), 'attention' (p<0.001), 'phrase repetition' (p<0.001), and 'delayed recall' (p<0.001) tasks compared to the control group.
The anxiety test results demonstrated the presence of moderate situational anxiety in 120 (58.5%) patients and high situational anxiety in 85 (41.4%) children. Regarding trait anxiety, it was detected at a low level in 4 (2%) patients, at a moderate level in 70 (34%) cases, and at a high level in 131 (64%) patients. Anxiety testing results, taking into account the duration of type 1 diabetes, showed that a moderate level of situational anxiety in the group of children with a disease duration of less than 3 years was observed in 62.8% of cases, with a duration of 3 to 6 years in 49.3% of children, and for more than 6 years in 63.3% of patients. A high level of stress (ST) in patients with a disease duration of less than 3 years was observed in 37.2% of cases, from 3 to 6 years in 50.7% of children, and in the group with a duration of more than 6 years in 36.7% of patients. According to the personal anxiety scale, a moderate level in children with a disease duration of less than 3 years was determined in 37.2% of episodes, from 3 to 6 years in 28.4% of patients, and in those with a longer period of pathology in 36.7% of children. A high degree of personal anxiety in this category of patients was identified in 60.3%, 70.1%, and 61.7% of cases, respectively (Fig. 1).
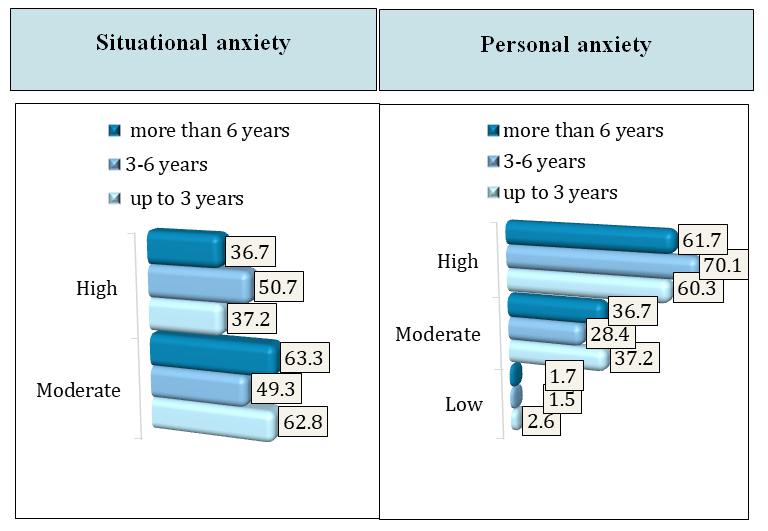
Figure 1. Levels of situational and personal anxiety in children and adolescents with type 1 diabetes
When assessing the 'State Anxiety Scale' indicator depending on the duration of diabetes, no statistically significant differences were found (P = 0.171) (method used: Pearson's Chi-square). When comparing the 'Trait Anxiety Scale' indicator depending on the duration of diabetes, no statistically significant differences were found (P = 0.764) (method used: Pearson's Chi-square).
An assessment of S-100 and NSE protein levels was conducted. In this case, the control group consisted of children with type 1 diabetes who did not have cognitive impairments. The S-100 protein level in patients with cognitive manifestations was significantly higher at 0.696 µg/L, compared both to patients without cognitive impairments (0.284 µg/L) and to its reference values.
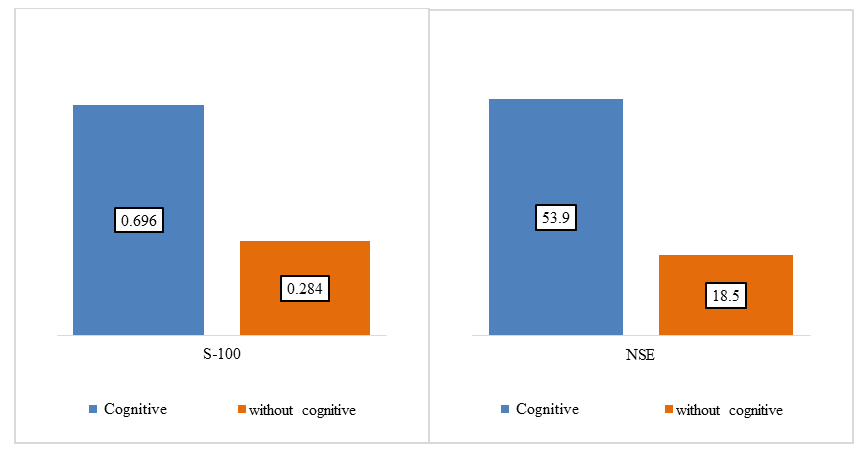
Figure 2. Analysis of S-100 and NSE proteins depending on the presence of cognitive impairments
A similar pattern was observed in the analysis of neuron-specific enolase results. In children with cognitive deficits, the protein concentration was significantly higher – 53.9 µg/L – compared both to patients without cognitive disorders – 18.5 µg/L – and to reference values. According to the results of neuropsychological testing and anxiety tests, there were found significant correlations with the enzyme-linked immunosorbent assay protein levels (p <0.001*). Thus, with an increase in S-100 by –0.065, the expected decrease in MoCA test points is –1 point. With an increase in NSE by –7.618, the expected decrease in MoCA test points is –1 point. With an increase in S-100 by 0.017, an increase of 1 point in the state anxiety scale is expected. With an increase in NSE by 1.431, an increase of 1 point in the state anxiety scale is expected. With an increase in S-100 by 0.015, an increase of 1 point in the trait anxiety scale is expected. With an increase in NSE by 1.223, an increase of 1 point in the state anxiety scale is expected.
In order to achieve early verification of the main pathological changes occurring in the brain, a study of the brain metabolite content and their ratios was conducted using proton magnetic resonance spectroscopy. The results showed a significant reduction in N-acetylaspartate levels compared to the control group in the left hippocampus – 1.71 mmol/L, and in the right gray matter – 1.66 mmol/L. Additionally, there was a significant increase in NAA in the white matter on both sides – 2.56 mmol/L (Table 2).
Table 2. Analysis of brain metabolites in children and adolescents depending on the presence of type 1 diabetes
     
Reduced levels of N-acetylaspartate in the hippocampus and gray matter may indicate changes in neuronal integrity with decreased neural tissue activity. Additionally, a reduction of NAA in the gray matter of the right cerebral cortex suggests the emergence of early signs of atrophy in that area.
The analysis of choline content, which is responsible for the optimal functioning of membrane processes, showed a significant increase compared to the control group in the left hippocampus – 3.11 mmol/L, and in the right gray matter – 3.10 mmol/L. Such changes may occur in cases of reactive gliosis followed by membrane necrosis, as well as during excessive oxidative stress activity. The study of creatine content, reflecting cellular energy processes and metabolism, demonstrated a significantly notable increase compared to the control group values in the left and right hippocampi – 4.25 mmol/L and 3.34 mmol/L, respectively, a significant increase in the left gray matter – 3.28 mmol/L, and a statistically significant decrease in the right gray matter – 2.40 mmol/L. High creatine levels in the hippocampi on both sides, as well as in the gray matter on the left, can be associated with compensatory reactions occurring in these regions of the brain. The increase in cellular energy metabolism indicates that the hippocampi require higher energy expenditure for optimal functioning, which may subsequently lead to the development of pathology at the anatomical level. As for the low creatine content in the gray matter of the right cerebral cortex, this indicates the emergence of early signs of atrophy in this region due to depletion of energy reserves.
For a more accurate determination of metabolite content, in most cases according to literature data, the calculation of ratios to several metabolites is used. As practice shows, creatine (Cr) serves as such a "reference" metabolite, since it is a relatively stable component of the cellular energy metabolism of the brain, and it is often used to calculate metabolite ratios, for example, such as Cho/Cr, NAA/Cr [16]. Based on all of the above, we conducted an analysis of the ratios of the metabolites of interest to each other in the specified areas of the brain. According to the study results, it was observed that in the cells of the right hippocampus, compared to the control group, there was a statistically significant (p < 0.001*) decrease in the choline to creatine ratio (Cho/Cr) and a statistically significant (p < 0.001*) increase in the N-acetylaspartate to creatine ratio (NAA/Cr).
In the hippocampal cells on the left, compared with the control group, statistically significant decreases (p < 0.001*) are observed in the ratios of choline to creatine (Cho/Cr), choline to N-acetylaspartate (Cho/NAA), and N-acetylaspartate to creatine (NAA/Cr). These changes indicate the development of an energy imbalance with disruption of neuronal integrity and disturbances in their connections, which are at the early stages of formation.
Analysis of ratios in the white matter of the brain identified statistically significant reductions in choline to creatine (p=0.016*) on the right and N-acetylaspartate to creatine (p=0.003*) on the left. No statistically significant results were found for the other ratio indicators. The detected changes (Cho/Cr, NAA/Cr) may indicate energy depletion in white matter neurons and, due to changes in the myelin sheath, disruptions in their connections.
The assessment of ratios in gray matter demonstrated significantly increased right-sided ratios of choline to creatine (p < 0.001*) and choline to N-acetylaspartate (p = 0.004*), as well as significant increases (p < 0.001*) in Cho/NAA and NAA/Cr on the left, which may also indicate a greater need for energy supply to the cells of the brain's gray matter. When processing the obtained MR spectroscopy results regarding metabolite content and ratios, using the Chedoke scale, we identified moderate and noticeable (p < 0.001*) direct and inverse correlations with the MoCA test and the Ch.D. Spielberger – Yu.L. Khanin Anxiety Test. The established relationships demonstrated the involvement of persistent disturbances in neuronal metabolism in the brain in the development of complications in the form of cognitive and emotional impairments in type 1 diabetes.

4. Conclusions

Conducting PMRS studies and determining the concentration of neuron-specific proteins made it possible to localize areas of the brain responsible for decreased cognitive and emotional functions in children and adolescents with type 1 diabetes. In addition, it allowed for obtaining more precise information on metabolic changes in these brain regions. Overall, these methods enabled the dynamic assessment of patients with type 1 diabetes, the detection of cerebral changes at a stage when clinical manifestations are not yet present, as well as the monitoring of potential disease progression and the adequacy of the selected therapy to correct higher cortical function deviations.

References

[1]  Type 1 diabetes…, 2016.
[2]  Aulich J, Cho YH, Januszewski AS, Craig ME, Selvadurai H, Wiegand S, Jenkins AJ, Donaghue KC. Associations between circulating inflammatory markers, diabetes type, and complications in youth. Pediatr Diabetes. 2019 Aug 28.
[3]  Yemelin A.Yu. Modern possibilities of neuroimaging in the differential diagnosis of cognitive impairments / A.Yu. Yemelin, M.M. Odinak, V.Yu. Lobzin, S.V. Vorobyev, V.N. Kiselev // Neurology, Neuropsychiatry, Psychosomatics. – 2012. – Vol. 4, No. 2S. – P. 51–55.
[4]  Zakharov V.V. Neuropsychological tests. The necessity and possibility of application / V.V. Zakharov // Consilium Medicum. – 2012. – Vol. 13, No. 2. – P. 82–90.
[5]  Samoylova Yu.G., Rotkank M.A., Kudlay D.A., Zhukova N.G., Matveeva M.V., Tolmachev I.V. Predictive model for the development of cognitive impairments in patients with type 1 diabetes. Journal of Neurology and Psychiatry named after S.S. Korsakov. 2020; 120(3): 19-22.
[6]  Skripchenko, N. V. Neuron-specific enolase and S100 protein – biomarkers of brain injury. Current state of knowledge and clinical application / N. V. Skripchenko, A. S. Shirokova // Neurosurgery and Pediatric Neurology. – 2016. – No. 4. – Pp. 16-25.
[7]  High Serum Levels of Serum 100 Beta Protein, Neuron-specific Enolase, Tau, Active Caspase-3, M30 and M65 in Children with Autism Spectrum Disorders / Ayaydın H., Kirmit A., Çelik H. [et al] // Clinical psychopharmacology and neuroscience: the official scientific journal of the Korean College of Neuropsychopharmacology. – 2020. – № 18(2).
[8]  Razumnikova, O. M. Ontogenesis of inhibitory control of cognitive functions and behavior: monograph / O. M. Razumnikova, E. I. Nikolaeva. – Novosibirsk: NSTU Publishing, 2021. – 159 p.
[9]  Barker P. B., Bizzi A., De Stefano N., Gullapalli R. P., Lin D. M. Clinical MR spectroscopy: Techniques and applications. Cambridge: University Press, 2009.
[10]  Grechaný S.V., Souf El-Ghil L.R., Ivanov D.O., Pozdnyakova O.F., Sergeev A.M., Atamanova E.E., Pozdnyakov A.V. Proton magnetic resonance spectroscopy in children with atypical autism associated with psychomotor agitation syndrome. Korsakov Journal of Neurology and Psychiatry. 2021; 121 (11 Suppl. 2): 12–18.
[11]  Tyurina A.N., Fadeeva L.M., Pronin I.N., Kornienko V.N. "ESNR" 3D 1H MR Spectroscopy in Determining the Degree of Anaplasia of Glial Tumors, Oslo, Norway, 2019.
[12]  Nikolaeva, E. I. Integration of Vestibular and Auditory Information in Ontogenesis / E. I. Nikolaeva, V. L. Efimova, E. G. Vergunov // Children. – 2022, no. 9.
[13]  Samoilova Y.G., Novoselova M.V., Zhukova N.G., Tonkikh O.S. Analysis of the role of neuron-specific proteins in the diagnosis of cognitive dysfunction in patients with type 1 diabetes // Diabetes. 2014. No. 2. Pp. 83–90.
[14]  Magnetic resonance spectroscopy in neurological disorders / M.A. Elahi Far, A. Bighamian, H. Taheri, A.A. Harandi // Sch. J. App. Med. Sci. – 2013. – Vol. 1, No. 2. – P. 117–121.
[15]  Rebrova O.Yu. Statistical analysis of medical data. Application of the STATISTICA software package. Moscow: Media Sphere, 2002. 312 pages.
[16]  Lowry, O. H. Diversity of metabolic patterns in human brain tumors: enzymes of energy metabolism and related metabolites and cofactors / O. H. Lowry, S. J. Berger, J. G. Carter et al. // Journal of Neurochemistry. – 1983. – Vol. 41. – P. 994–1010.