Fattakhov Nusratullo Khamidullayevich1, Abdulkhakimov Arsen Rinatovich2, Abduganiyeva Arofat Yormakhamatova3
1DSc, Professor, Head of the Department of Faculty and Hospital Surgery, Fergana Medical Institute of Public Health, Ferghana, Uzbekistan
2PhD, Associate Professor, Department of Faculty and Hospital Surgery, Fergana Medical Institute of Public Health, Ferghana, Uzbekistan
3Senior Teacher, Department of Epidemiology and Infection Diseases, Nursing Work, Fergana Medical Institute of Public Health, Fergana, Uzbekistan
Correspondence to: Fattakhov Nusratullo Khamidullayevich, DSc, Professor, Head of the Department of Faculty and Hospital Surgery, Fergana Medical Institute of Public Health, Ferghana, Uzbekistan.
| Email: |  |
Copyright © 2025 The Author(s). Published by Scientific & Academic Publishing.
This work is licensed under the Creative Commons Attribution International License (CC BY).
http://creativecommons.org/licenses/by/4.0/

Abstract
Acute intestinal infections (AII) remain a pressing issue for global healthcare systems due to their high prevalence, changing etiological agents, and diagnostic complexities. This study applies SIR and SIRS mathematical models to simulate the spread of rotavirus infections in the Fergana region using real epidemiological data and Python-based computational tools. By incorporating probabilistic cellular automata and the Monte Carlo method, the effectiveness of preventive measures is quantitatively assessed. Results demonstrate that early intervention and comprehensive prevention significantly reduce infection rates, highlighting the importance of modern modeling methods in controlling epidemic processes.
Keywords:
Acute intestinal infections, Rotavirus, Mathematical modeling, SIRS model, Prevention, Epidemiology
Cite this paper: Fattakhov Nusratullo Khamidullayevich, Abdulkhakimov Arsen Rinatovich, Abduganiyeva Arofat Yormakhamatova, Modeling the Disease Epidemic in the Prevention of Acute Viral Intestinal Infections, American Journal of Medicine and Medical Sciences, Vol. 15 No. 8, 2025, pp. 2819-2822. doi: 10.5923/j.ajmms.20251508.84.
1. Introduction
Acute intestinal infections (AII) are among the most urgent issues in global health due to high morbidity, age and regional specificity, and emerging antibiotic-resistant strains. Particularly during pandemics, the epidemic dynamics change significantly. Mathematical modeling becomes a vital tool in understanding and controlling these infectious diseases. This study focuses on modeling rotavirus transmission using the SIR and SIRS frae works [1; p-3-8., 3; p-11-15., 4; p-56-59.].
2. Materials and Methods
We employed the SIR and SIRS differential equation models to simulate the transmission of rotavirus. The population was divided into three compartments: Susceptible (S), Infected (I), and Recovered (R). In the SIRS model, immunity wanes over time, returning individuals to the susceptible group. Input data was sourced from the Fergana Regional Health Department reports and included vaccination numbers, susceptible individuals, and reinfection cases. Model parameters were adjusted using Python simulations involving probabilistic cellular automata and the Monte Carlo method.Optimizing health care resources: modeling allows for determining what types and how many resources may be needed to prevent and treat AII under budget-constrained conditions. One of the most widely used models is the SIRS model (Susceptible – vulnerable to illness, Infectious – infected, Recovered – recovered, Susceptible – again vulnerable to illness). This model enables tracking the number of individuals in each category over time. Using the SIRS model, a program package written in Python was applied to evaluate the directional movements of rotavirus infection (which spreads infectious acute viral intestinal infections) under various conditions within a defined territory, based on cellular automata grids [2; p-17-22., 5; p-140-144.].
3. Results and Discussion
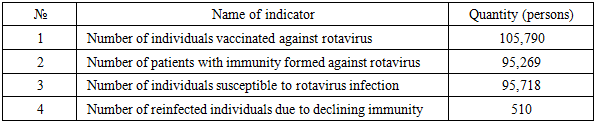
The data entered into the software package for modeling was extracted from the reports of the Fergana Regional Health Department (Table 1).Table 1. Indicators representing the impact of rotavirus, the cause of acute viral intestinal infection, on patients in Fergana region
 |
| |
|
According to the above methodology, it was assumed that the SIR model (Susceptible – Infected – Recovered) can be represented as a system of differential equations for rotavirus infection. This model, consisting of a system of differential equations, describes the dynamics of rotavirus infection spread among the population divided into three groups:S(t) – individuals susceptible to rotavirus infection (Susceptible)I(t) – individuals infected with rotavirus (Infected)R(t) – individuals who recovered or developed immunity (Recovered)The general form of the unidentified SIR model based on the dynamics of these categorized groups in differential equation form can be expressed as: | (1) |
In this model: β (beta) – transmission coefficient of rotavirus infection (depends on human contact and likelihood of infection); γ (gamma) – recovery rate from rotavirus infection (inversely proportional to the average duration of illness). Suppose immunity after rotavirus infection remains stable for a certain period; in that case, δ (delta) is considered as the rate of immunity loss. If this factor is taken into account, the SIRS model is modified accordingly: 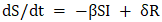 | (2) |
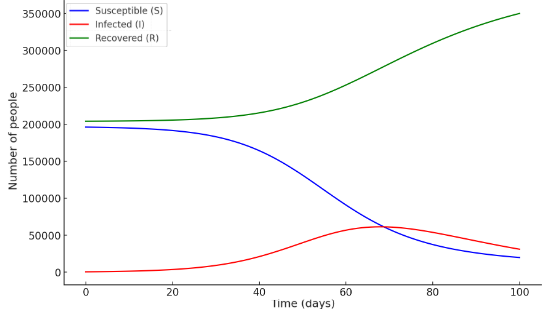
According to this model, a portion of those recovered from rotavirus infection returns to the susceptible category. The indicators entered into the program by region included the following data:Total population potentially affected by rotavirus infectionNumber of individuals vaccinated against rotavirusNumber of individuals susceptible to rotavirus infectionNumber of individuals infected with rotavirusDuration of illness with and without preventive measures. To build the SIRS model, the following defining variables were included in the program based on the above indicators: S(t) – individuals susceptible to rotavirus infection (Susceptible) I(t) – individuals infected with rotavirus (Infected) R(t) – individuals who recovered or developed immunity (Recovered) Based on the above data, when the linear differential equation SIR model in form (1) is constructed, it can be seen that the results reflect the movement trajectory illustrated in Figure 1.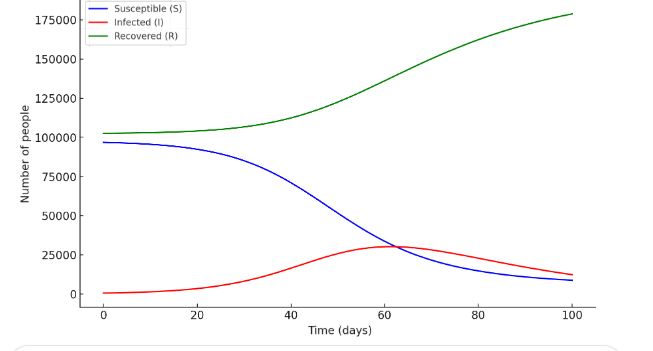 | Figure 1 |
The graph illustrates the dynamics of rotavirus infection spread within the SIR model. The trajectory of infection spread describes the decrease in the number of susceptible individuals (S), the initial rise and then decline in the number of infected individuals (I), and the increase in the number of recovered individuals (R) (Figure 1). According to the differential equation-based SIR model, the quantitative indicators changed as follows:-susceptible to rotavirus infection – (S₀) = 196,282 people.Vaccinated against the infection – (R₀) = 204,236 people.Recovered from the infection – (I₀) = 510 people.For this updated case, the shape and graph of the SIR model show corresponding changes (Figure 2). In addition to the traditional SIR model that describes the spread of infectious diseases, there exist several more complex epidemiological models that more accurately describe the spread of rotavirus infection. One of these is the SIRS model, which takes into account the loss of immunity. If the immunity formed after illness does not remain permanent (which is typical for rotavirus), then recovered individuals may again become susceptible to rotavirus infection. In this case, the system of differential equations (2) is modified as follows: 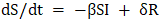 | (3) |
 | Figure 2. The SIR model of the spread of rotavirus infection (with updated data) |
Here: δ (delta) – rate of immunity loss. The modified SIRS model assumes that δ accounts for the loss of immunity and that recovered individuals return to the susceptible group. The quantitative indicators in the differential equation-based SIRS model are the same as those included in the previous SIR model, namely: Susceptible to rotavirus infection – (S₀) = 196,282 people; Vaccinated against the infection – (R₀) = 204,236 people; Recovered from the infection – (I₀) = 510 people. In this scenario, the following parameter changes are considered: β = 0.3 – transmission coefficient; γ = 121 – recovery rate (based on duration without prevention); δ = 1/180 – rate of immunity loss (it is assumed that immunity lasts for 6 months). The results of the considered modified differential equation-based SIRS model that describes the spread of rotavirus infection allow interpretation of the general trajectory of quantitative indicators for each parameter based on random variations (Figure 3).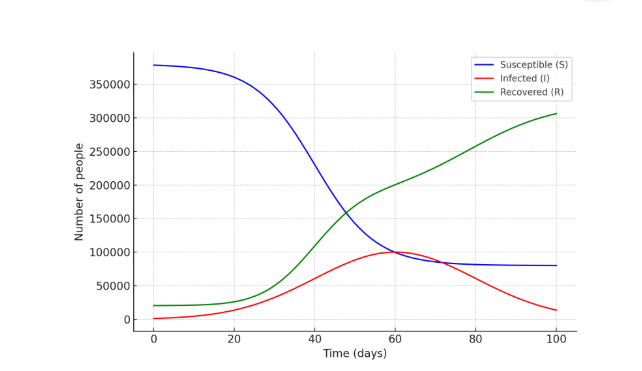 | Figure 3. Spread of rotavirus infection based on the SIRS model |
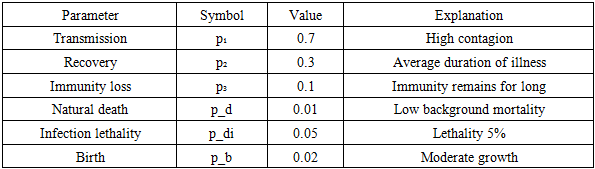
Unlike the traditional SIR model, in the SIRS model, the number of susceptible individuals (S) can be seen to increase again over time because individuals who recovered (R) lose their immunity over time and return to the susceptible group (S). Using the considered models, by evaluating the movement trajectory of rotavirus infection (the causative agent of acute viral intestinal infections) under changing conditions, it becomes possible to determine the direction of measures for infectious disease prevention and the volume of expenses required, thereby organizing efforts against this disease. Based on the modified SIRS model using the probability–cellular automaton and Monte Carlo method, we carry out the step-by-step scientific assessment of the preventive effectiveness of the mathematical model of the spread of acute viral intestinal infections (AVII). Initial Model (Note), Differential calculation system (SIRS) taking into account the following:Transmission; Recovery; Immunity loss; Natural death; Additional death due to infection; Birth; Parameter selection for calculation. There are conditional but realistic parameters:Table 2. Model Parameters
 |
| |
|
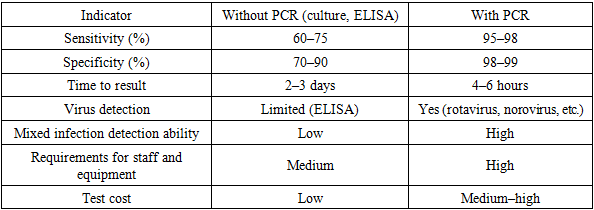
Without Prevention (Initial Model)Let us calculate the equilibrium point E₂ using expressions:Here, s₂ ≈ 0.514 – this is the equilibrium proportion of the susceptible population. We substitute s₂ into the y₂ formula. Taking the approximate value for estimation: y₂ ≈ 0.1 (proportion of infected individuals) Thus, in the absence of prevention, 10% of the population is constantly infected.With Prevention Preventive measures (e.g., hygiene, quarantine) can be reflected in the model as a decrease in the transmission parameter p₁, or increase in recovery rate p₂, or growth in the immune layer.Assume: After prevention: p₁ = 0.4 (a 42% reduction in transmission) p₂ = 0.4 (increase in recovery speed). Then: However, s₂ > 1 – this is impossible, which means the infection will not persist in the population. The system reaches e₁ = (1 − p_b/p_d, 0, 0) – infection-free.In other words, the infection disappears. Effectiveness of Prevention The effectiveness of prevention E is evaluated by the formula: E = ((initial − final) / initial) × 100% E = (10% − 0%) / 10% × 100% = 100%. The prevention measures reduce infection cases from 10% to 0%, indicating 100% effectiveness in the model. Predictive Visualization, On the time scale: Without prevention: y(t) ≈ 10% stabilizes; With prevention: y(t) → 0, r(t) → 0.8–0.9.Comparative DataBased on summarized research data (e.g., from Tashkent and Fergana regions, 2022–2024), the following comparative table can be presented:Table 3. Comparative analysis of PCR, ELISA, and bacteriological laboratory diagnostics
 |
| |
|
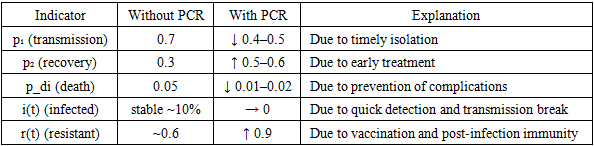
How it reflects in model parameters:Table 4. Reflecting lab diagnostics comparison in model parameters
 |
| |
|
4. Conclusions
Thus, mathematical modeling using the modified SIRS-probabilistic model in the form of a cellular automaton shows that implementing preventive measures aimed at reducing transmission rate and increasing recovery rate allows for the complete elimination of acute viral intestinal infections in the population. The calculations show a reduction in the infected population from 10% to 0%, which corresponds to 100% preventive effectiveness. The results emphasize the importance of early intervention and comprehensive preventive approaches in controlling the epidemic process of viral intestinal infections.
References
| [1] | Amvroseva T. V. i dr. Opit ispolzovaniya molekulyarnih metodov dlya laboratornoy diagnostiki virusnih ostrih kishechnix infeksiy i tipirovaniya ih vozbuditeley na primere Minskogo regiona. – 2019. |
| [2] | An R. N. Modelirovanie kishechnyh infekcij i izuchenie vzaimodey- stviya fagov i bakterij vo vneshnej srede // XVII Mezhdunarodnaya konferenciya po nauke i tekhnologiyam Rossiya-Koreya-SNG. – 2017. – S. 17-22. |
| [3] | Ajtzhanova G. O., Zhahiyanov A. Zh. Profilaktika ostryh kishechnyh infekcii u detey // Aktualniye nauchniye issledovaniya v sovremennom mire. – 2020. – №. 11-4. – S. 11-15. |
| [4] | Asilova M. U., Musabaev E. I., Ubajdullaeva G. B. Virusniye diarei v strukture ostryh kishechnih infekciy u detey // ZHurnal infektologii. – 2014. – T. 3. – №. 3. – S. 56-59. |
| [5] | Musina A. A. i dr. Podhodi epidemiologicheskogo modelirovaniya pri razrabotke effektivnyh mer profilaktiki // Valeologiya: Zdorove, Bolezn, Vyzdorovleniye. – 2022. – №. 2. – S. 140-144. |

 Abstract
 Reference
 Full-Text PDF
 Full-text HTML