Akhmedov A. T.1, Akhrorov J. Kh.2
1PhD., Associate Professor, Pediatric Surgery and Neurosurgery, Bukhara State Medical Institute, Bukhara, Uzbekistan
2Interventional Cardiologists, CathLab, Bukhara Branch of Republican Research Centre Of Emergency Medicine, Bukhara, Uzbekistan
Correspondence to: Akhmedov A. T., PhD., Associate Professor, Pediatric Surgery and Neurosurgery, Bukhara State Medical Institute, Bukhara, Uzbekistan.
| Email: |  |
Copyright © 2025 The Author(s). Published by Scientific & Academic Publishing.
This work is licensed under the Creative Commons Attribution International License (CC BY).
http://creativecommons.org/licenses/by/4.0/

Abstract
The article presents the results of a comprehensive clinical and laboratory study of 120 patients with ischemic heart disease treated at the Bukhara Regional Cardiology Dispensary. The patients were divided into three groups depending on the presence of comorbid conditions: Group I – patients with isolated ischemic heart disease, Group II – patients with ischemic heart disease combined with type 2 diabetes mellitus, and Group III – patients with ischemic heart disease combined with chronic renal failure. The study analyzed the distribution of patients by age, gender, body mass index, as well as clinical symptoms, hemodynamic parameters, coagulogram indices, biochemical blood analysis, and general urinalysis. Significant differences were revealed between the groups, indicating that the addition of comorbid pathologies, especially diabetes mellitus and chronic renal failure, leads to a progressive deterioration of the clinical course, aggravation of metabolic and hemostatic disorders, and worsening of renal function. The results obtained can serve as a basis for the individualization of antithrombotic therapy and for further studies on the prognosis and pathogenesis of cardiovascular diseases in patients with comorbid conditions.
Keywords:
Ischemic heart disease, Type 2 diabetes mellitus, Chronic renal failure, Comorbid conditions, Body mass index, Hemodynamic parameters, Coagulogram, Biochemical analysis, Renal function
Cite this paper: Akhmedov A. T., Akhrorov J. Kh., Clinical Course Features and Laboratory Parameters of Ischemic Heart Disease Against the Background of Various Comorbid Conditions, American Journal of Medicine and Medical Sciences, Vol. 15 No. 8, 2025, pp. 2809-2815. doi: 10.5923/j.ajmms.20251508.82.
1. Introduction
Cardiovascular diseases (CVD) remain the leading causes of global mortality, annually claiming the lives of more than 18 million people [1,2]. Arterial hypertension (AH) and ischemic heart disease (IHD) are the main determinants of critical vascular complications. According to global statistics [3], AH affects more than 1.2 billion people, while IHD is diagnosed in over 120 million. The coexistence of these pathologies is especially common in individuals over 60 years of age, reaching up to 50%, which is linked to excess body weight, lipid metabolism disorders, and chronic inflammation [4,5].Despite advances in pharmacotherapy and preventive strategies, effective control of hypertension is still not achieved in 35–40% of patients, leaving blood pressure levels above the target range and significantly increasing the risk of coronary events and cerebrovascular complications [6,7]. Uncontrolled hypertension is associated with a progressive rise in cardiovascular mortality, reaching 15–20% per decade [8].The transition from isolated hypertension to its combination with ischemic heart disease is driven by complex mechanisms, including vascular remodeling, impaired microcirculation, systemic inflammation, and metabolic dysregulation. However, the exact pathways of this progression remain insufficiently studied [9].In this context, it is essential to investigate the role of demographic, regional, and anthropometric factors in the development and course of AH and IHD. Such data may form the basis for more accurate prediction models and targeted prevention, highlighting the importance of this research.Purpose of the study. The aim of this study was to investigate the gender and regional characteristics of arterial hypertension (AH) and coronary heart disease (CHD), with particular emphasis on their clinical manifestations, anthropometric features, and distribution among different patient categories.
2. Materials and Methods
A comprehensive clinical and laboratory examination was carried out among 120 patients treated at the Bukhara Regional Cardiology Dispensary. All study participants were selected according to predefined inclusion and exclusion criteria to ensure the reliability of the obtained results and minimize the influence of unrelated pathologies.Patients were divided into three main clinical groups:Group I (n=40): Patients with isolated ischemic heart disease, without clinically verified comorbid conditions.Group II (n=40): Patients with ischemic heart disease combined with type 2 diabetes mellitus.Group III (n=40): Patients with ischemic heart disease combined with chronic kidney disease.The distribution of patients by age, gender, body mass index, clinical symptoms, hemodynamic parameters, coagulation profile, biochemical blood markers, and general urinalysis was analyzed in detail. Special attention was given to identifying differences between groups in order to assess the impact of comorbid conditions on the course and prognosis of IHD.
3. Results and Discussion
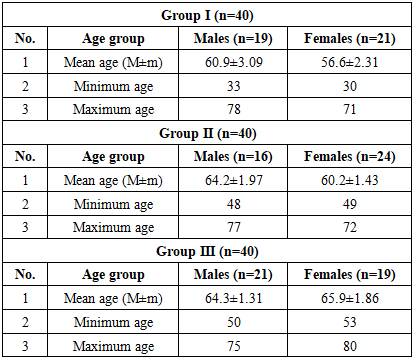
The study showed that the course of ischemic heart disease was significantly influenced by comorbid conditions. In patients with isolated IHD, the disease was observed at a younger age, while in the presence of diabetes mellitus and chronic kidney disease it occurred mainly in older individuals.Body mass index analysis revealed that overweight and obesity were common in all groups, but more pronounced in patients with diabetes, whereas in chronic kidney disease normal weight or mild overweight prevailed.Clinically, anginal pain and weakness were frequent in all patients, while polyuria and polydipsia were typical for diabetes, and edema was predominant in chronic kidney disease. Dyspnea and reduced exercise tolerance were also more common in patients with comorbidities.Hemodynamic and laboratory parameters confirmed these differences: patients with comorbid conditions had higher blood pressure, signs of hypercoagulability, and pronounced metabolic changes. Glucose and HbA1c were increased in diabetes, while urea and creatinine were sharply elevated in chronic kidney disease.Thus, comorbidities significantly worsened the clinical course of IHD and accelerated the development of complications.In this study, the distribution of patients by age and gender was analyzed. The results of this analysis are presented in Table 1.Table 1. Distribution of patients by age and gender, n=120
 |
| |
|
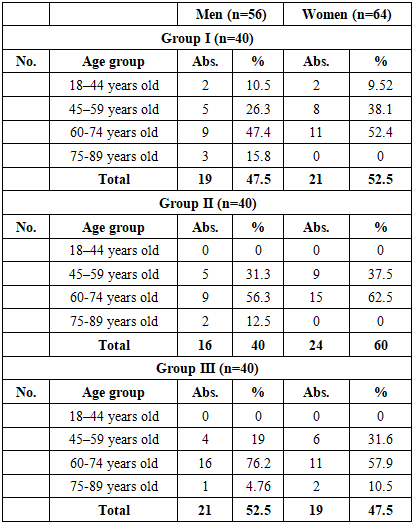
Analysis of Table 1 showed that in Group I the mean age of males was 60.9±3.09 years, while that of females was 56.6±2.31 years. Females were reliably younger by 7.1% compared to males (P≤0.05). In Group II, the mean age of males was 64.2±1.97 years and females 60.2±1.43 years, which was 5.4% and 6.4% higher compared to Group I, respectively (P≤0.05). In Group III, males averaged 64.3±1.31 years, while females were 65.9±1.86 years, making females 2.5% older than males (P≤0.05).The patients were also analyzed by age categories, and the results are shown in Table 2.Table 2. Distribution of patients by age category, n=120
 |
| |
|
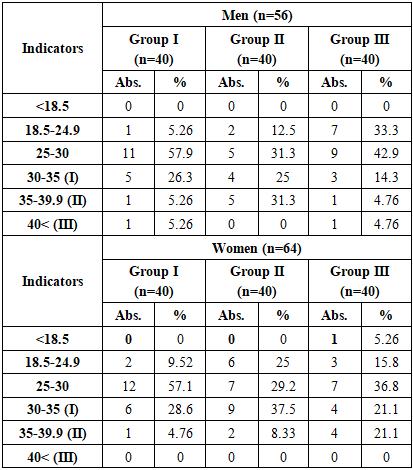
In group I, the proportion of men aged 18–44 was 10.5% and women 9.5%, while this figure was not observed at all in groups II and III. This indicates a shift in the age category to older ages in patients with comorbid conditions. In the 45–59 age category, in group I, men were 26.3% and women 38.1%, in group II, men were 31.3% and women 37.5%, and in group III, men were 19% and women 31.6%. Thus, this category is relatively high in groups I and II, and lower in group III.The proportion of people aged 60–74 was the largest, with 47.4% men and 52.4% women in Group I, 56.3% men and 62.5% women in Group II. In Group III, 76.2% men and 57.9% women were involved, and the proportion of men was significantly higher (P≤0.05) than in Group I.In the 75–89 age group, the proportion of men showed a decreasing trend, with 15.8% in Group I, 12.5% in Group II, and 4.8% in Group III. Among women, this category was only recorded in Group III (10.5%), and was absent in Groups I and II.The overall analysis shows that while group I has a higher proportion of younger age groups (18–44 years) and middle-aged (45–59 years), in groups II and III the proportion of patients is mainly older (60–74 years). In group III, the proportion of men aged 60–74 years, which accounts for 76.2%, is significantly higher (P≤0.05), indicating that the disease is more likely to manifest itself at an older age in patients with comorbid conditions, especially chronic renal failure.The TMI scores of the patients in the study were analyzed and the results are presented in Table 3.Table 3. Body mass index (kg/m2) indicators of patients
 |
| |
|
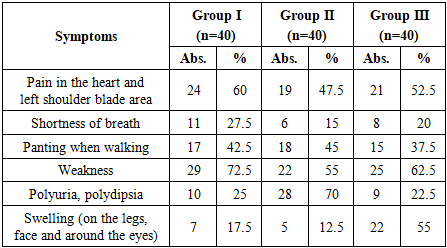
Among male patients, 57.9% of those in group I had a BMI of 25–30 kg/m², which is associated with the initial stage of obesity. At the same time, 26.3% of men in group I had grade I obesity (30–35 kg/m²). In group II, grade II obesity (35–39.9 kg/m²) was significantly higher (P≤0.05) among men than in group I by 31.3%, while in group III, normal weight (18.5–24.9 kg/m²) was 33.3% among men, which was more than in the other groups, but grade I obesity (14.3%) and grade II obesity (4.8%) were significantly lower.In women, in group I, 57.1% of patients had a BMI of 25–30 kg/m², that is, overweight, and 28.6% had grade I obesity. In group II, the level of obesity was high, with 37.5% of women having grade I obesity and 8.3% having grade II obesity. In group III, normal weight was found in 15.8% of patients, while grade II obesity reached 21.1%, which was significantly higher (P≤0.05) than in women in groups I and II. The overall analysis shows that obesity and overweight were widespread in all groups, and high levels of obesity were especially common in patients with diabetes mellitus and chronic renal failure.In this study, the symptoms experienced by the patients were analyzed and the results are presented in Table 4.Table 4. Characteristics of clinical symptoms in patients in the study group, (n=120)
 |
| |
|
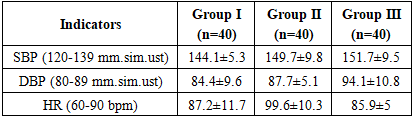
Analysis of clinical symptoms in the study groups showed that the most frequently reported symptom was anginal pain, which occurred in 24 (60%) cases in group I, 19 (47.5%) in group II, and 21 (52.5%) in group III. Although the highest proportion of anginal pain was noted in group I, it was also noted in more than half of the patients in group III, and this difference was found to be significant (P≤0.05) compared to group I. Although the highest proportion of anginal pain was noted in group I, its occurrence in more than half of patients in groups II and III also confirms that it is the main clinical manifestation of ischemic heart disease. This condition is explained by myocardial ischemia and coronary circulatory insufficiency.Symptoms of shortness of breath and wheezing were more common in groups II and III: shortness of breath was observed in 6 (15%) cases in group II and 8 (20%) in group III, and wheezing was observed in 18 (45%) and 15 (37.5%) cases, respectively. These indicators were significantly (P≤0.05) higher in group III compared to group I. These indicators are explained by a decrease in myocardial pumping function and decreased tolerance to additional loads.Fatigue was high in almost all groups: 29 (72.5%) in group I, 22 (55%) in group II, and 25 (62.5%) in group III. This indicates that the indicator in group I was significantly (P≤0.05) higher than in group II, and was also maintained in group III.This indicator is a clinical reflection of general ischemia, hypoxia and metabolic disorders in the body. Interestingly, polyuria/polydipsia was most often observed in group II, in 28 (70%) cases, which was significantly higher than in groups I (25%) and III (22.5%), and the difference was found to be significant (P≤0.01). This phenomenon is explained by its close association with diabetes mellitus.Tumors were observed in 22 (55%) patients in group III, which was significantly higher (P≤0.01) than in groups I (17.5%) and II (12.5%).This indicator is closely related to chronic renal failure and decreased heart pump function, and indicates impaired blood flow and water-salt metabolism in the venous part of the circulation.Thus, anginal pain and fatigue are the most common symptoms in patients with CAD. When comorbid conditions were added (diabetes mellitus, chronic renal failure), the spectrum of symptoms expanded significantly, and dyspnea, polyuria/polydipsia, and edema were significantly higher (P≤0.05/P≤0.01). This confirms the need to take into account comorbid pathologies in the tactics of antithrombotic therapy.In patients with ischemic heart disease, the analysis of hemodynamic parameters is important in assessing the severity of the clinical condition, determining the risk of complications, and evaluating the effectiveness of treatment (Table 5).Table 5. Hemodynamic indicators of patients in research groups, M±m
 |
| |
|
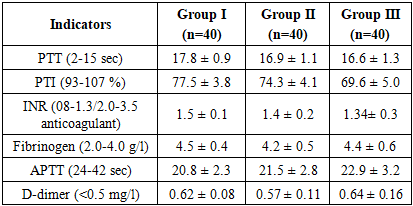
Systolic blood pressure (SBP): 144.1±5.3 mmHg in group I, 149.7±9.8 mmHg in group II, and 151.7±9.5 mmHg in group III. SBP was 3.9% higher in group II than in group I, and 5.3% higher in group III. The differences were statistically significant (P≤0.05). This indicates that the tendency for arterial hypertension increases when comorbid conditions are added.Diastolic blood pressure (DBP): 84.4±9.6 mmHg in group I, 87.7±5.1 mmHg in group II, and 94.1±10.8 mmHg in group III. Group II was 3.9% higher than group I (P≤0.05), and group III was 11.5% higher than group I, and this difference was significant (P≤0.01). This indicates that diastolic pressure is higher in the presence of comorbid conditions, especially chronic renal failure.Heart rate (HR): 87.2±11.7 beats/min in group I, 99.6±10.3 beats/min in group II, and 85.9±5 beats/min in group III. HR in group II was 14.2% higher than in group I, and the difference was significant (P≤0.01). IIICoagulogram parameters are of primary importance in assessing the overall state of blood coagulation through platelets, plasma factors, and the fibrinolytic system. Changes in the coagulation system against the background of ischemic heart disease and comorbid conditions can increase the risk of thrombosis or cause bleeding events. (Table 6).Table 6. Coagulogram parameters in patients in research groups, M±m
 |
| |
|
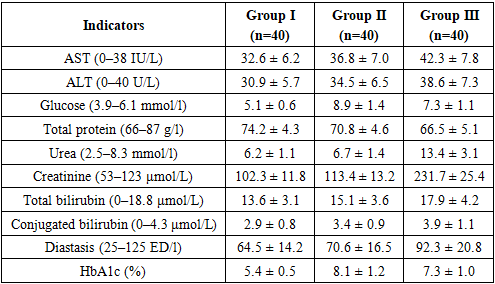
PTT (prothrombin time): 17.8±0.9 sec in group I, 16.9±1.1 sec in group II, 16.6±1.3 sec in group III. In groups II and III, the indicator was reduced compared to group I, that is, 5.0–6.7% lower. This difference was considered significant (P≤0.05). A decrease in blood clotting time indicates an increased thrombotic tendency. PTI (prothrombin index): 77.5±3.8% in group I, 74.3±4.1% in group II, 69.6±5.0% in group III. PTI in group II was 4.1% lower than group I (P≤0.05), and in group III it was 10.2% lower (P≤0.01). This indicates a weakening of the anticoagulant system and a tendency to hypercoagulability. INR (international normalized ratio): 1.5±0.1 in group I, 1.4±0.2 in group II, 1.34±0.3 in group III. In group II, the indicator was 6.7% lower than in group I, and in group III, 10.7% lower. The difference was significant (P≤0.05). This indicates an acceleration of the blood coagulation system. Fibrinogen: 4.5±0.4 g/l in group I, 4.2±0.5 g/l in group II, 4.4±0.6 g/l in group III. Although the indicator was 6.7% lower in group II, the statistical difference was not significant. In group III, it was close to group I. APTT (activated partial thromboplastin time): 20.8±2.3 sec in group I, 21.5±2.8 sec in group II, 22.9±3.2 sec in group III. In group III, the indicator was 10.1% higher than in group I, and the difference was significant (P≤0.05). This indicates a slight weakening of the stages of the blood coagulation cascade. D-dimer: 0.62±0.08 mg/l in group I, 0.57±0.11 mg/l in group II, 0.64±0.16 mg/l in group III. Although D-dimer in group III was close to group I, it was lower in group II. The differences were not statistically significant.The analysis of the results of the coagulogram shows that with the addition of comorbid conditions, a tendency to consistent hypercoagulation is formed in the blood coagulation system.In group I: the indicators are close to normal, the PTV is prolonged, the PTI and INR remain relatively high. This indicates that a balanced state is maintained in the blood coagulation system. In group II: a decrease in PTV, a decrease in PTI and INR were reliably noted (P≤0.05). This increases the risk of thrombosis due to endothelial dysfunction on the background of diabetes, the accumulation of glycosylated proteins associated with excess sugar, and inflammatory processes in the blood vessel wall. At the same time, a decrease in fibrinogen indicates an inconsistency in the blood coagulation system. In group III: a further decrease in PTI and INR (P≤0.01) and a prolongation of the APTV (P≤0.05) confirm the presence of a deeper imbalance in the blood coagulation system. This condition is associated with uremic toxins, impaired platelet function, and a decrease in anticoagulant factors. At the same time, the D-dimer index is high, indicating the activity of fibrinolysis and the dynamic nature of the thrombosis process.Comorbid conditions (T2DM and IBD) affect various stages of the blood coagulation system. In particular: endothelial dysfunction and oxidative stress against the background of T2DM enhance thrombogenesis. As a result, the PTT decreases, the PTI and INR decrease. In IBD, platelet function and the balance of blood coagulation factors are disturbed. As a result, a tendency to thrombosis (low PTI, decreased INR) and a tendency to bleeding (prolonged APTT) occur simultaneously. Although fibrinogen parameters did not show significant differences, their high values (especially in groups I and III) reflect a tendency to “thicken” the blood. Elevated D-dimer indicates that the fibrinolysis process is overactive and microthromboses are constantly formed in the body.Thus, when comorbid conditions are added (especially diabetes and kidney pathology), significant changes in the blood coagulation system are noted: a decrease in PTI and INR, a decrease in PTV, a prolongation of APTV, and an increase in D-dimer. These changes indicate an increased risk of both thrombosis and bleeding. Therefore, the strategy of antithrombotic therapy in such patients must be selected individually.Blood biochemical tests are of primary importance in assessing the metabolic state of the body, liver and kidney functions, and carbohydrate metabolism. AST and ALT enzymes reflect hepatocellular damage, while glucose and HbA1c indicate the state of carbohydrate metabolism. Total protein, urea, and creatinine are important in assessing nephropathic and hepatopathic processes. Bilirubin and diastase reflect biliary and pancreatic functions (Table 7).Table 7. Results of blood biochemical analysis in patients in the study groups (M+m)
 |
| |
|
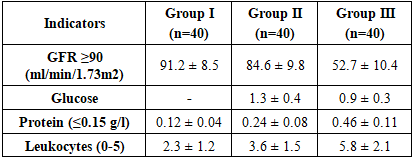
AST and ALT: in group I, AST was 32.6±6.2 U/l, ALT was 30.9±5.7 U/l. In group II, 36.8±7.0 and 34.5±6.5 U/l, respectively; in group III, 42.3±7.8 and 38.6±7.3 U/l. In groups II and III, the indicators were significantly increased (P≤0.05), especially in group III, AST was 29.7% higher than in group I (P≤0.01). This indicates an increase in the load on the liver parenchyma and the effect of hypoxia in comorbid conditions.Glucose: 5.1±0.6 mmol/l (normal) in group I, 8.9±1.4 mmol/l in group II (significantly 74.5% higher; P≤0.001), and 7.3±1.1 mmol/l in group III (43.1% higher; P≤0.01). This indicates a disturbance in carbohydrate metabolism in the background of T2DM and IBD.Total protein: 74.2±4.3 g/l in group I, 70.8±4.6 g/l in group II (4.6% lower; P≤0.05), and 66.5±5.1 g/l in group III (10.4% lower; P≤0.01). This condition reflects hypoproteinemia and metabolic disorders.Urea: 6.2±1.1 mmol/l in group I, 6.7±1.4 mmol/l in group II (close values), and 13.4±3.1 mmol/l in group III – that is, it significantly more than doubled (P≤0.001). This indicates a sharp deterioration in kidney function.Creatinine: 102.3±11.8 μmol/l in group I, 113.4±13.2 μmol/l in group II (10.8% higher; P≤0.05), 231.7±25.4 μmol/l in group III (126.4% higher; P≤0.001). This indicates the accumulation of nitrogenous wastes associated with IBE.Total bilirubin and conjugated bilirubin: 13.6±3.1 and 2.9±0.8 μmol/l in group I, 15.1±3.6 and 3.4±0.9 μmol/l in group II, 17.9±4.2 and 3.9±1.1 μmol/l in group III. In groups II and III, the indicators were significantly increased (P≤0.05), indicating an overload of liver function and biliary dysfunction.Diastasis: 64.5±14.2 ED/l in group I, 70.6±16.5 ED/l in group II (9.4% higher; P≤0.05), 92.3±20.8 ED/l in group III (43.1% higher; P≤0.01). This indicates pancreatic injury and increased enzymatic load.HbA1c: 5.4±0.5% in group I, 8.1±1.2% in group II (50% higher; P≤0.001), 7.3±1.0% in group III (35.2% higher; P≤0.01). This indicates a deterioration in long-term glycemic control.In conclusion, against the background of comorbid conditions, liver enzymes were significantly elevated, which is associated with hypoxia and toxic effects. Glucose and HbA1c values were significantly elevated (P≤0.001), which confirms diabetic and uremic metabolic disorders. Urea and creatinine were significantly elevated (especially in group III; P≤0.001), which indicates the accumulation of nitrogenous wastes in the ICU. A decrease in total protein reflects hypoproteinemia and a decrease in metabolic resources. An increase in diastase and bilirubin indicates impaired pancreatic and biliary function. Thus, against the background of comorbid conditions, significant changes in the biochemical profile were noted.A complete urinalysis is an important indicator of renal function and metabolic status. GFR (glomerular filtration rate) is the main indicator in assessing the filtration capacity of the kidneys. The amount of glucose, protein, and leukocytes in the urine provides information about the degree of damage to the renal tubules and glomerular apparatus. Therefore, the analysis of these indicators is important in assessing nephropathic processes in patients with chronic kidney disease and comorbid conditions (Table 8).Table 8. General urine analysis (M±m) in patients in study groups
 |
| |
|
GFR (glomerular filtration rate): In group I, GFR remained within the normal range (91.2±8.5 ml/min/1.73 m²), indicating that renal function was not significantly impaired. In group II, GFR was significantly (P≤0.05) lower than in group I (to 84.6±9.8 ml/min/1.73 m²). In group III, the indicator decreased sharply and amounted to 52.7±10.4 ml/min/1.73 m² (P≤0.001). This indicates that renal function is already impaired against the background of diabetes, and the process of structural deterioration accelerates when chronic renal failure is added.Glucosuria: No glucose was detected in group I. In group II, glucosuria was observed (1.3±0.4 g/l), which is a reliable sign of diabetic nephropathy (P≤0.01). In group III, glucosuria was also preserved (0.9±0.3 g/l), but the indicator was relatively lower than in group II, indicating a sharp decrease in filtration and a decrease in the reabsorption capacity of the tubules.Proteinuria: In group I, protein excretion was close to normal (0.12±0.04 g/l), while in group II, this indicator doubled (0.24±0.08 g/l; P≤0.01). In group III, proteinuria increased more than threefold (0.46±0.11 g/l; P≤0.001). This trend indicates a serious damage to the glomerular barrier in the setting of diabetes and especially CKD.Leukocyturia: In group I, the number of leukocytes was within the normal range (2.3±1.2), and in group II it increased to 3.6±1.5 (P≤0.05). In group III, the indicator was 5.8±2.1, which is more than twice as high as in group I (P≤0.01). This confirms that nephritic components and inflammatory processes are significantly increased in patients with CKD.In conclusion, the general urinalysis shows that: IUD itself did not significantly affect renal function, the indicators remained within the normal range. When diabetes mellitus was added, signs of nephropathy (glucosuria, proteinuria, decreased filtration) were reliably manifested. In patients with comorbid SBE, the filtration function was significantly reduced, proteinuria and leukocyturia were noted at a high level, which indicates the active course of nephrosclerosis and inflammatory processes. These data indicate the need to individualize antithrombotic therapy in comorbid patients, since nephropathic changes can directly affect the effectiveness and safety of therapy.
4. Conclusions
In the analysis of gender distribution, women were more frequent among patients with isolated hypertension, accounting for 61.7% of cases, while in the group with a combination of hypertension and coronary heart disease men predominated (51.7%). Although women dominated in group I (37 out of 60) and men in group II (31 out of 60), these differences did not reach statistical significance (p=0.144).When assessing the place of residence, rural patients predominated in both groups, but their proportion was higher in isolated hypertension (80.0%) compared to the combined pathology (71.7%). The share of urban residents was slightly higher in group II (28.3% versus 20.0%), though this difference was also not statistically significant (p=0.292).The analysis of body mass index revealed more pronounced differences. Excess body weight was more common in patients with isolated hypertension (50.0%) than in those with hypertension and coronary heart disease (40.0%). At the same time, the proportion of patients with normal BMI was significantly higher in group II (30.0% versus 10.0% in group I), which indicates a reliable difference in the distribution of BMI between the groups (p=0.049).
References
| [1] | A.T. Akhmedov (2024). IMPACT OF CYTOKINES ON THE ONSET AND PROGRESSION OF ARTERIAL HYPERTENSION. Eurasian Journal of Medical and Natural Sciences, 4 (6), 116-123. doi: 10.5281/zenodo.12154505. |
| [2] | Akhmedov, A. T., & Sharipov, Z. R. (2023). The role of cytokines in the development of arterial hypertension. Int J Med Sci Clin Res, 3(03), 59-67. |
| [3] | GBD 2021 Hypertension Collaborators. (2023). Global, regional, and national burden of hypertension, 1990–2021. The Lancet, 402(10397), 820–835. |
| [4] | Libby, P., & Ridker, P. M. (2022). Inflammation and atherosclerosis: role of C-reactive protein in risk assessment. Circulation Research, 131(2), 147–160. |
| [5] | Roth, G. A., Mensah, G. A., & Johnson, C. O. (2020). Global burden of cardiovascular diseases and risk factors, 1990–2019. Journal of the American College of Cardiology, 76(25), 2982–3021. |
| [6] | Virani, S. S., Alonso, A., Aparicio, H. J., Benjamin, E. J., Bittencourt, M. S., Callaway, C. W., ... & Tsao, C. W. (2021). Heart disease and stroke statistics—2021 update: a report from the American Heart Association. Circulation, 143(8), e254–e743. |
| [7] | Whelton, P. K., Carey, R. M., Aronow, W. S., Casey, D. E., Collins, K. J., Himmelfarb, C. D., ... & Wright, J. T. (2018). 2017 ACC/AHA guideline for the prevention, detection, evaluation, and management of high blood pressure in adults. Journal of the American College of Cardiology, 71(19), e127–e248. |
| [8] | Williams, B., Mancia, G., Spiering, W., Rosei, E. A., Azizi, M., Burnier, M., ... & Coca, A. (2018). 2018 ESC/ESH Guidelines for the management of arterial hypertension. European Heart Journal, 39(33), 3021–3104. |
| [9] | World Health Organization. (2023). Cardiovascular diseases (CVDs) fact sheet. WHO. |

 Abstract
 Reference
 Full-Text PDF
 Full-text HTML