U. I. Nurov, M. B. Shodiyeva
Bukhara State Medical Institute named after Abu Ali ibn Sina, Bukhara, Uzbekistan
Copyright © 2025 The Author(s). Published by Scientific & Academic Publishing.
This work is licensed under the Creative Commons Attribution International License (CC BY).
http://creativecommons.org/licenses/by/4.0/

Abstract
This article presents a clinical and functional study aimed at investigating the characteristics of chronic rhinosinusitis in children. The objective of the study was to assess the intensity of bacterial infection in the paranasal sinuses within this population. Various diagnostic methods were employed, including microbiological culture, computed tomography, and rhinoscopy, to identify the bacterial species causing the disease and their antibiotic resistance. The authors describe the relationship between the clinical manifestations of chronic rhinosinusitis and the degree of bacterial colonization in the paranasal sinuses, as well as analyze the impact of different therapeutic approaches on treatment outcomes. Special attention is given to the analysis of disease recurrences and their association with bacterial flora characteristics. This study holds significant practical value for pediatricians and otorhinolaryngologists, as it provides new insights into the mechanisms of chronic rhinosinusitis development and the effectiveness of applied treatment methods. The study results can be used to optimize treatment protocols and improve the efficacy of therapy in children suffering from this condition.
Keywords:
Chronic rhinosinusitis, Children, Bacterial infection, Paranasal sinuses, Diagnosis, Microbiological culture, Antibiotic resistance, Clinical studies, Therapeutic approaches, Disease
Cite this paper: U. I. Nurov, M. B. Shodiyeva, Study of Clinical and Functional Characteristics in Children Suffering from Chronic Rhinosinusitis: Assessment of Bacterial Infection Intensity in the Paranasal Sinuses, American Journal of Medicine and Medical Sciences, Vol. 15 No. 4, 2025, pp. 1013-1022. doi: 10.5923/j.ajmms.20251504.34.
1. Introduction
The relevance of studying chronic rhinosinusitis in the pediatric population is due to the high prevalence of this disease among children and its significant impact on overall health, quality of life, and academic performance. Chronic rhinosinusitis affects the physical and psycho-emotional state of a child, potentially leading to frequent colds, impaired hearing, and a diminished sense of smell. The scientific community is actively working on developing more effective diagnostic and treatment methods for this condition, with particular attention to its bacterial nature and possibilities for controlling the infectious process. It is especially important to consider the antibiotic resistance of pathogens, which highlights the need for new therapeutic approaches and the assessment of their effectiveness. A study focused on analyzing the clinical and functional characteristics of chronic rhinosinusitis allows for a deeper understanding of the problem, identification of key factors influencing the course and outcome of the disease, and the development of targeted recommendations for medical practice. This, in turn, contributes to improving diagnostic accuracy, optimizing therapeutic strategies, and enhancing preventive measures, which is crucial for improving children's health at the national level. ecurrence.The aim of this article is to comprehensively assess the clinical and functional characteristics of chronic rhinosinusitis in children, with a particular focus on the intensity of bacterial infection in the paranasal sinuses. The study is designed to investigate the microbiological profile of pathogens, their antibiotic susceptibility, and the relationship between clinical manifestations of the disease and bacteriological findings. These data will contribute to the development of more effective approaches to the diagnosis, treatment, and prevention of chronic rhinosinusitis, as well as the formulation of strategies to reduce recurrence rates and improve the quality of life of young patients.
2. Materials and Methods
Studypopulation:The study was conducted with the participation of 150 children aged 4 to 12 years suffering from chronic rhinosinusitis, who were admitted to the pediatric otolaryngology department of the city clinical hospital. All participants were divided into two groups—experimental and control—based on the treatment methods used, after obtaining written informed consent from their legal representatives.Diagnostic Methods:• Microbiological Analysis: Samples of mucus from the paranasal sinuses were collected to identify pathogens and determine their antibiotic susceptibility.• Computed Tomography (CT): Performed on all participants to assess structural changes in the paranasal sinuses.• Rhinoscopy: Used for the visual evaluation of the nasal and sinus mucosa condition.Treatment Methods:• The experimental group received innovative therapy using new antibiotics and local treatment methods.• The control group received standard treatment for chronic rhinosinusitis.Data Collection and Analysis Methods:Data were collected through initial and follow-up visits, which included completing standardized questionnaires to assess symptoms and quality of life. Statistical analysis was performed using SPSS software, applying both parametric and non-parametric methods to compare mean values and median indicators between the two groups.Ethical Considerations:The study was approved by the local ethics committee, and all procedures adhered to the ethical standards of the Helsinki Declaration.This approach ensures a comprehensive evaluation of the effectiveness of therapeutic approaches for treating chronic rhinosinusitis in children and allows for an assessment of the relationship between clinical manifestations of the disease and microbiological parameters.
3. Results and Discussion
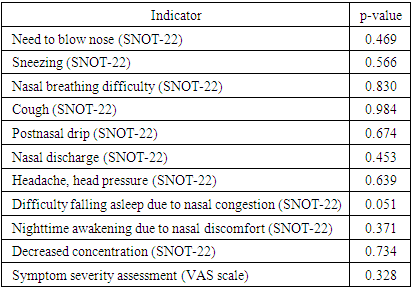
This evaluation was conducted through an analysis of clinical, rhinoscopic, functional, and laboratory indicators before the initiation of therapeutic intervention. Among the most common symptoms observed in patients were nasal breathing difficulties, nasal discharge, cough, and postnasal drip.The overall condition of patients was assessed using a questionnaire based on the SNOT-22 tool (refer to the methodological section "Materials and Methods"). A comparative analysis of different groups was performed on the first day of the study, using an ordinal scale based on the SNOT-22 questionnaire data. The analysis did not reveal significant statistical differences between the study groups in most parameters, as indicated in Table 1. The only exception was one characteristic—difficulty falling asleep—which was found to be on the borderline of statistical significance.Table 1. Comparison of Symptom Severity Between Study Groups
 |
| |
|
The statistical analysis of symptom severity, as assessed by the SNOT-22 questionnaire, did not reveal significant differences between the study groups in most parameters. However, difficulty falling asleep due to nasal congestion demonstrated a borderline statistical significance (p = 0.051), suggesting a potential difference that may warrant further investigation.Statistical Significance of Differences Between Groups: Application of the Mann-Whitney TestThe study of patients' subjective sensory perceptions revealed the following statistical data for the two groups:• Need to blow nose: 4.148 in the experimental group (EG) and 4.036 in the control group (CG).• Sneezing: 0.851 in EG and 0.927 in CG.• Decreased concentration: 0.203 in EG and 0.163 in CG.• Nasal breathing difficulty: 2.962 in EG and 2.945 in CG.• Nighttime awakening due to nasal discomfort: 0.611 in EG and 0.727 in CG.• Cough: 2.444 in EG and 2.454 in CG.• Headache/pressure: 1.444 in EG and 1.545 in CG.• Postnasal drip sensation: 2.87 in EG and 2.963 in CG.• Nasal discharge: 2.944 in EG and 2.854 in CG.• Difficulty falling asleep due to nasal congestion: 0.777 in EG and 0.545 in CG.The application of the Mann-Whitney U test did not reveal statistically significant differences between the two groups in most parameters. However, the difficulty falling asleep due to nasal congestion parameter demonstrated a notable difference, suggesting a potential trend that may require further investigation in larger sample sizes.These data represent quantitative assessments of patients' sensations based on various parameters related to their health condition.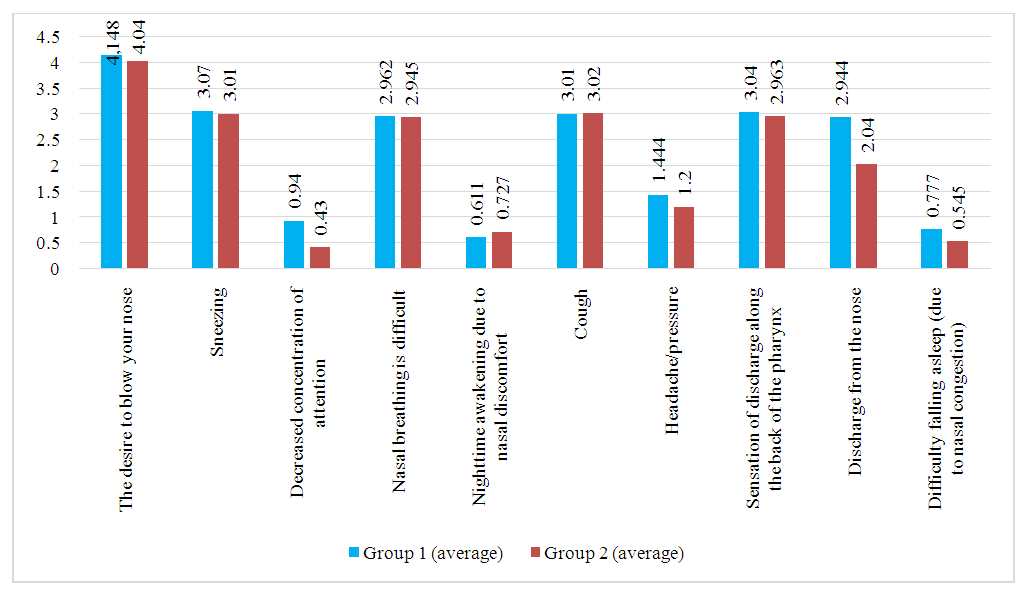 | Figure 1. Visualization of Patient Complaints Dynamics in the First and Second Groups During the Initial Medical Examination on Day One |
In accordance with international standards, the severity of chronic rhinosinusitis (CRS) is assessed based on the patient's subjective evaluation using a 10-centimeter visual analogue scale (VAS). Patients mark a point on this scale that best reflects the intensity of their symptoms. The severity of the disease is classified as follows: values from 0 to 3 cm indicate a mild form, from 4 to 7 cm indicate a moderate form, and from 8 to 10 cm indicate a severe form.As a result of the initial assessment, patients in the first group showed an average score of 5.7, while in the second group, this value was 6.01, indicating a moderate course of the disease in both groups.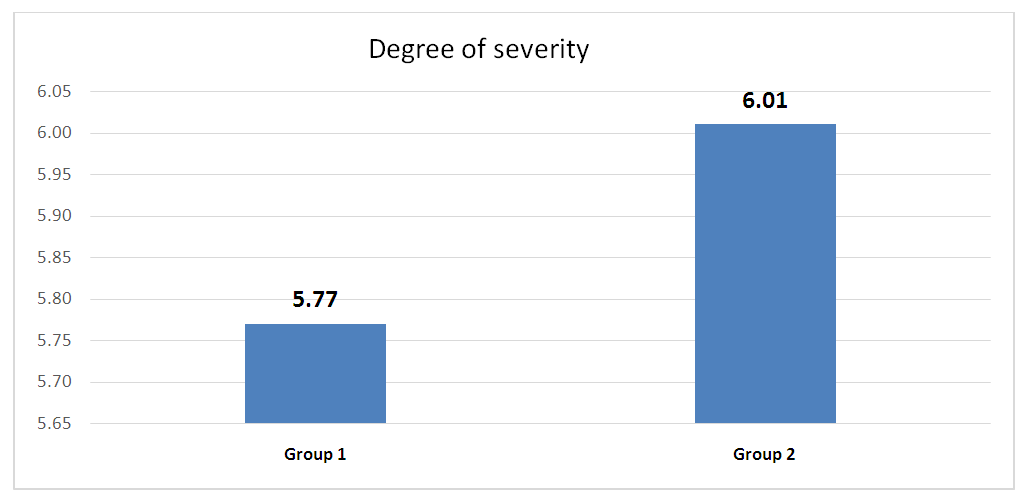 | Figure 2. Graphical Representation of Data Reflecting Disease Severity on the Visual Analog Scale (VAS) at the Time of Initial Patient Examination |
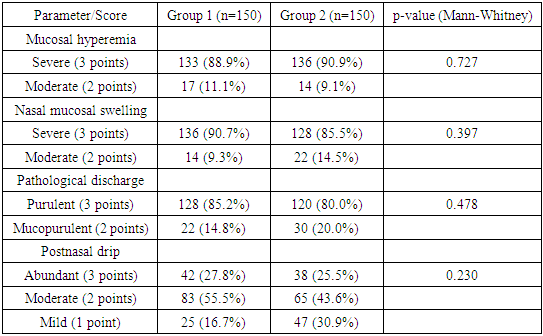
For the analysis of rhinoscopic findings, a four-point visual analog scale was adapted, allowing for the systematization and quantification of key characteristics observed during the examination. As a result of a detailed rhinoscopic study, the following common symptoms were identified in all patients: pronounced hyperemia of the nasal mucosa, noticeable mucosal swelling, the presence of purulent discharge in the middle nasal passages, and postnasal drip along the posterior pharyngeal wall.These data are collected and systematized in Table 2 and further illustrated in Figure 3.Table 2
 |
| |
|
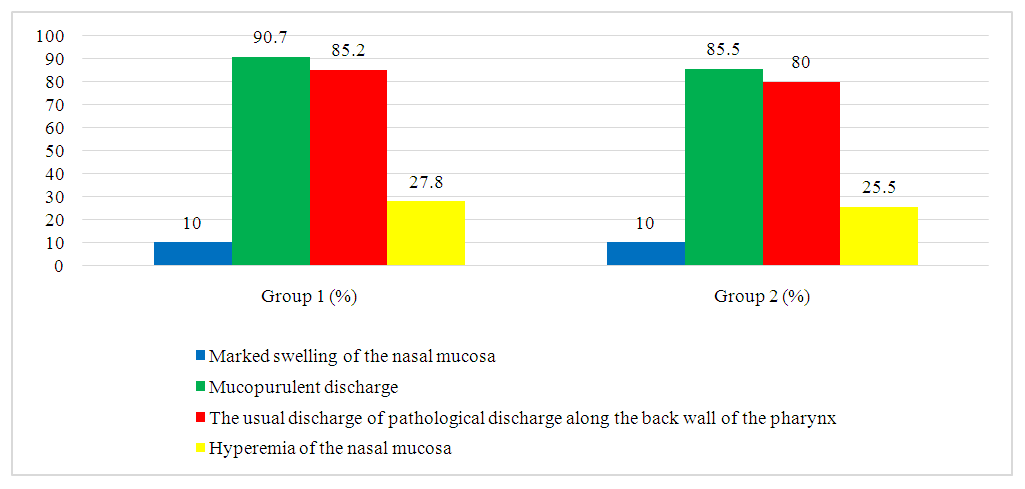 | Figure 3. Results of rhinoscopic examination of patients on the first day of assessment, confirming the presence of typical clinical and rhinoscopic signs of acute bacterial rhinosinusitis |
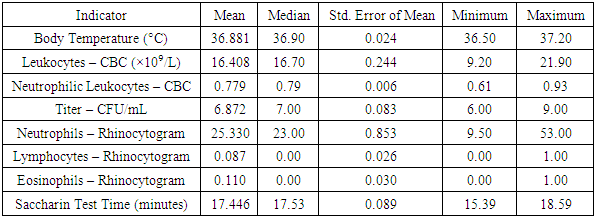
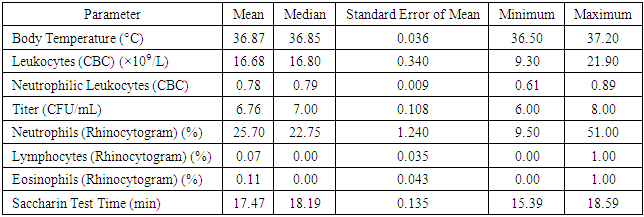
During the observation of patients in both groups, fluctuations in body temperature from 36.5°C to 37.2°C were recorded, with an average temperature of 36.8°C and a standard deviation of 0.24. As part of the initial consultation, as well as on the third and sixth day of treatment, an assessment of the cytological structure of the nasal mucosa (NM) was conducted.Cytological studies of the initial samples revealed a predominance of neutrophils, which formed dense clusters within the field of view, accompanied by a significant amount of bacterial flora. The presence of lymphocytes was recorded in isolated cases. The percentage of neutrophils ranged from 9.5% to 53.0% within the field of view, with an average value of 25.3 ± 0.853%. The number of lymphocytes varied from 0 to 1 per field of view, with an average value of 0.087 ± 0.026%. The presence of eosinophils ranged from 0 to 1 per field of view, which is atypical for allergic conditions, demonstrating an average value of 0.110 ± 0.030%. These indicators suggest the presence of a chronic bacterial process and a decrease in the local protective function of the nasal mucosa.The analysis of nasal transport function before the start of treatment showed its decline. The saccharin test time ranged from 15.39 to 18.59 minutes, with an average value of 17.44 ± 0.089 minutes. The standard saccharin test time averaged 7.54 ± 0.34 minutes.From the blood test results on the first day of treatment, two significant indicators were identified: the total leukocyte count and the percentage of neutrophilic leukocytes as markers of phagocytic activity. The leukocyte volume varied from 9.2 to 21.9 × 10⁹/L, with an average value of 16.4 ± 0.244. The percentage ratio of neutrophilic leukocytes to other cellular elements in the leukocyte formula ranged from 61% to 93%, with an average of 77 ± 0.006%. A comprehensive blood test confirmed the predominance of chronic bacterial infection.The study conducted on children with chronic rhinosinusitis (CRS) older than 7 years confirmed a statistically significant increase in IgA and IgM levels compared to reference laboratory values.The characteristics of the data for the specified indicators are presented in Table 3. This table provides the mean, median, standard deviation, minimum, and maximum values calculated based on data from the entire group of 300 patients on the first day of the study.Table 3. Descriptive Statistics of Clinical Study Data
 |
| |
|
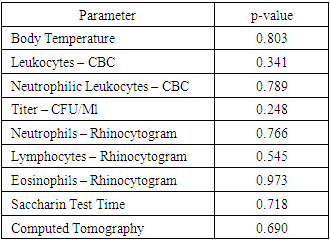
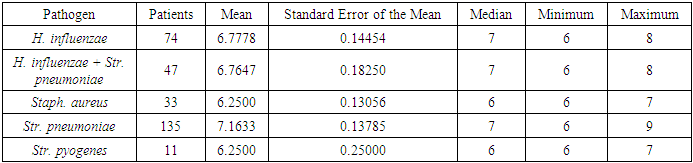
The health parameters measured during the study showed the following results:• The average body temperature was 36.881°C, with a median of 36.90°C. The standard error of the mean was 0.024. The recorded temperature range varied from 36.50°C to 37.20°C.• The leukocyte level, according to the complete blood count (CBC), averaged 16.408 × 10⁹/L, with a median of 16.70 × 10⁹/L. The standard error of the mean was 0.244, with values ranging from 9.20 × 10⁹/L to 21.90 × 10⁹/L.• The percentage of neutrophilic leukocytes had a mean value of 0.779, with a median of 0.79. The standard error of the mean was 0.006, with values ranging from 0.61 to 0.93.• The titer concentration in samples had an average value of 6.872 CFU/mL and a median of 7.00 CFU/mL, with a standard error of 0.083. The values ranged from 6.00 CFU/mL to 9.00 CFU/mL.• The relative content of neutrophils in the rhinocytogram averaged 25.330%, with a median of 23.00%. The standard error of the mean was 0.853, with a range of values from 9.50% to 53.00%.• The relative content of lymphocytes in the rhinocytogram was 0.087%, with a median of 0.00% and a standard error of 0.026. The values ranged from 0.00% to 1.00%.• The relative content of eosinophils in the rhinocytogram had an average value of 0.110%, with a median of 0.00% and a standard error of 0.030. The value range was from 0.00% to 1.00%.• The saccharin test time averaged 17.446 minutes, with a median of 17.53 minutes. The standard error of the mean was 0.089, with values ranging from 15.39 minutes to 18.59 minutes.These data are presented in Table 4, where the Mann-Whitney test is also applied to assess the statistical significance of differences between the groups.Table 4. Mann-Whitney Test Results
 |
| |
|
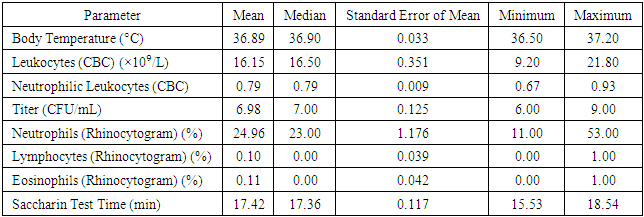
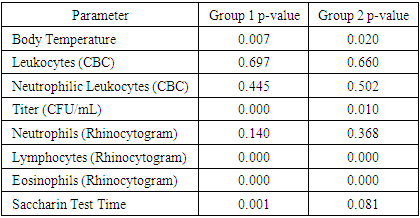
Based on the application of the Mann-Whitney statistical test to assess differences between the two patient groups, the results showed no statistically significant differences across all examined parameters. Here are the detailed p-values for each indicator:• Body Temperature: p-value = 0.803• Leukocytes (CBC): p-value = 0.341• Neutrophilic Leukocytes (CBC): p-value = 0.789• Titer (CFU/mL): p-value = 0.248• Neutrophils (Rhinocytogram): p-value = 0.766• Lymphocytes (Rhinocytogram): p-value = 0.545Eosinophils (Rhinocytogram): p-value = 0.973• Saccharin Test Time: p-value = 0.718• Computed Tomography: p-value = 0.690These data allow us to conclude that there are no statistically significant differences between the groups in terms of the analyzed clinical and diagnostic parameters. Table 4 presents these results, confirming the absence of differences between the two study groups.For additional illustration, Table 5 presents descriptive statistics calculated separately for Group 2, which included 150 patients. These data include means, medians, standard deviations, minimum, and maximum values for all examined indicators exclusively for the second group, providing a detailed understanding of their clinical profile.Table 5. Descriptive Statistics for Group 2 (150 Patients)
 |
| |
|
Table 6. Descriptive Statistics for Group 1 (150 Patients)
 |
| |
|
In the framework of the study of Group 2, the following parameters were recorded and analyzed:1. Body Temperature:ο The mean value was 36.89°C, with a median of 36.90°C.ο The standard error of the mean reached 0.033.ο The recorded minimum temperature was 36.50°C, and the maximum was 37.20°C.2. Leukocyte Levels (Based on Complete Blood Count - CBC):ο The mean leukocyte count was 16.15 × 10⁹/L, with a median of 16.50 × 10⁹/L.ο The standard error of the mean was 0.351.ο The minimum recorded leukocyte count was 9.20 × 10⁹/L, while the maximum was 21.80 × 10⁹/L.3. Neutrophilic Leukocytes (Based on Complete Blood Count - CBC):• The mean and median values were 0.79.• The standard error of the mean was 0.009.• The minimum neutrophil count was 0.67, while the maximum was 0.93.4. Titer (Substance Concentration):• The mean value was 6.98 CFU/mL, with a median of 7.00 CFU/mL.• The standard error of the mean was 0.125.• The minimum recorded titer was 6.00 CFU/mL, while the maximum was 9.00 CFU/mL.5. Relative Neutrophil Content (Based on Rhinocytogram Data):• The mean value was 24.96%, with a median of 23.00%.• The standard error of the mean was 1.176.• The minimum recorded neutrophil percentage was 11.00%, and the maximum was 53.00%.6. Relative Lymphocyte Content (Based on Rhinocytogram Data):• The mean value was 0.10%, with a median of 0.00%.• The standard error of the mean reached 0.039.• Values ranged from a minimum of 0.00% to a maximum of 1.00%.These data highlight the importance of analyzing and monitoring various clinical and laboratory parameters for assessing patient health in medical research.7. Relative Eosinophil Content (Based on Rhinocytogram Data):• The mean relative eosinophil content was 0.11%, with a median of 0.00%.• The standard error of the mean was 0.042.• The values ranged from a minimum of 0.00% to a maximum of 1.00%.8. Saccharin Test Duration:• The mean duration of the Saccharin Test, which is used to assess the functional state of the nasal mucosa, was 17.42 minutes, with a median of 17.36 minutes.• The standard error of the mean was 0.117.• The minimum recorded test duration was 15.53 minutes, while the maximum was 18.54 minutes.The data on body temperature, leukocyte levels, CFU/mL titers, lymphocyte and eosinophil content, and saccharin test duration were analyzed to identify statistically significant differences between the study groups. Comparative analysis results showed no statistically significant differences.Assessment of Statistical Adequacy and Selection of Analytical MethodTo evaluate the statistical adequacy of the data and determine the appropriate analytical method, the one-sample Kolmogorov-Smirnov test was applied. The test results indicated that the distribution of values for body temperature, CFU/mL titer, lymphocyte and eosinophil content, as well as saccharin test duration (for Group 1) did not conform to a normal distribution (p-value < 0.05).This finding necessitates the use of non-parametric methods for data analysis, such as the Mann-Whitney test, instead of the Student's t-test, to avoid errors associated with the assumption of normal data distribution.These conclusions are detailed in Table 7, which presents the results of the one-sample Kolmogorov-Smirnov test for each analyzed parameter in the study groups.Table 7. Results of the One-Sample Kolmogorov-Smirnov Test
 |
| |
|
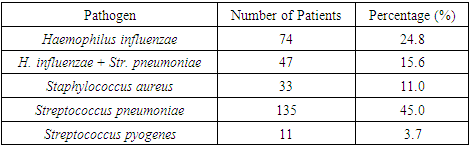
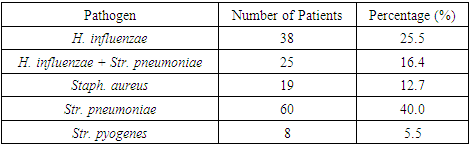
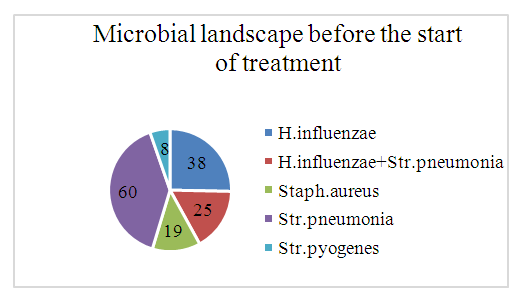
Microbial Flora Analysis Before Treatment InitiationThe study of microbial flora isolated from the middle nasal meatus of patients before treatment initiation revealed that the most prevalent microorganism was Streptococcus pneumoniae, detected in 49 cases, accounting for 45% of all isolates. The second most frequently identified pathogen was Haemophilus influenzae, found in 27 cases (24.8%). In 17 cases (15.6%), a co-association of H. influenzae and S. pneumoniae was observed. Staphylococcus aureus was detected in 12 cases (11.0%), while Streptococcus pyogenes was identified in 4 cases (3.7%). No fungal flora was found in the analyzed samples.These findings are illustrated in Figure 4 and detailed in Table 8, which presents the microbiological composition of nasal secretions from the middle nasal meatus before the initiation of therapy.Table 8. Descriptive Statistical Data on the Microbial Landscape of Nasal Secretions Before Treatment (Day 1 of the Study)
 |
| |
|
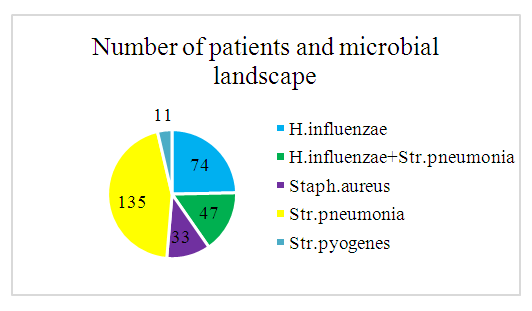 | Figure 4. Microbial Landscape. Total Number of Patients |
The recorded increase in the concentration of pathogenic microflora to a level of 6.8 CFU/mL with a standard deviation of 0.083 (ranging from 6.0 to 9.0 CFU/mL) indicates significant bacterial colonization. The metric used to assess the number of microorganisms capable of forming colonies on a nutrient medium was the colony-forming unit (CFU). This parameter represents the average number of microorganisms that can grow into visible colonies under standard laboratory conditions.Additional information on the CFU count for each type of microorganism identified in the study, as well as their titer characteristics, is presented in Table 9. These data provide a detailed understanding of the bacterial load and help guide antibiotic therapy by assessing the degree of bacterial contamination in various clinical samples.Table 9. Microbial Titer Statistics, First Day of Treatment
 |
| |
|
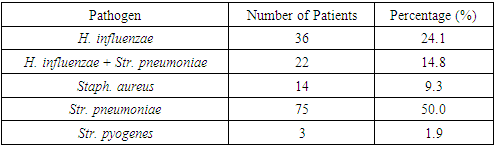
Following the randomization process, in which participants were divided into two groups based on treatment selection principles, changes in the species composition of pathogenic microflora were observed. These changes are comprehensively illustrated in visual materials and statistical data presented in Figures 5 and 6, as well as in Tables 10 and 11.Table 10. Descriptive Statistics for the Microbial Landscape Before Treatment, Control Group (CG)
 |
| |
|
 | Figure 5. Microbial Landscape Before Treatment (Control Group - CG) |
Table 11. Descriptive Statistics for the Microbial Landscape Before Treatment, Group 1
 |
| |
|
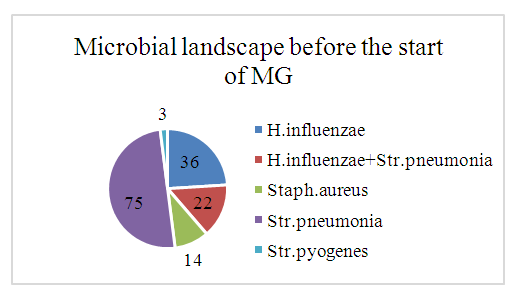 | Figure 6. Microbial Landscape Before Treatment in the Main Group (MG) |
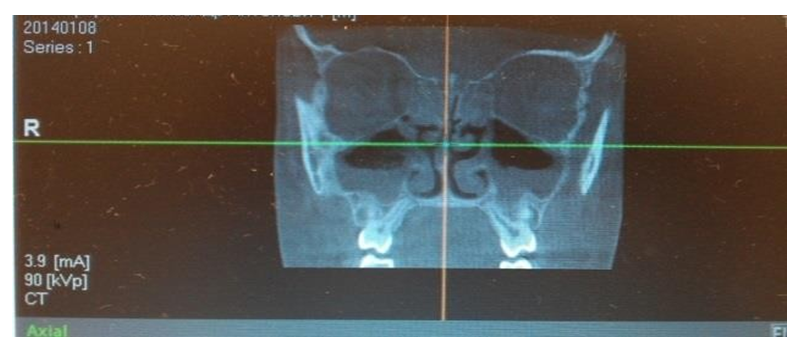
These resources provide information on the quantitative and qualitative changes in the microbial population following the implementation of different therapeutic approaches. They allow for an assessment of the effectiveness of the chosen treatment methods on the structure and composition of pathogenic microorganisms isolated from patients' clinical samples. This information is crucial for analyzing the response of pathogenic microflora to antibiotic therapy and other medical interventions, ultimately aiding in the optimization of treatment strategies.Microbiological analysis of secretions from the middle nasal passages in patients with chronic rhinosinusitis (CRS) revealed that monoflora dominated in 84% of cases, while associative flora was detected in only 16% of cases. The microbial landscape was primarily characterized by the predominance of coccal forms, which accounted for 59.7% of the samples.The use of computed tomography (CT) for the analysis of paranasal sinuses in both groups before treatment provided crucial data on the localization and extent of the inflammatory process. The tomographic analysis revealed the following patterns of inflammation distribution:• In 46 patients (42.2%), unilateral maxillary sinus opacification with a distinct horizontal fluid level was observed (see Figure 7).• In 36 patients (33.02%), bilateral maxillary sinus opacification with a horizontal fluid level was detected (see Figure 8).• In 27 patients (24.77%), opacification involved all sinuses on one side (maxillary, ethmoid, and frontal, if developed) (see Figure 9).These findings provide significant insights into the structure and prevalence of inflammatory processes in the paranasal sinuses, which are crucial for planning further treatment strategies.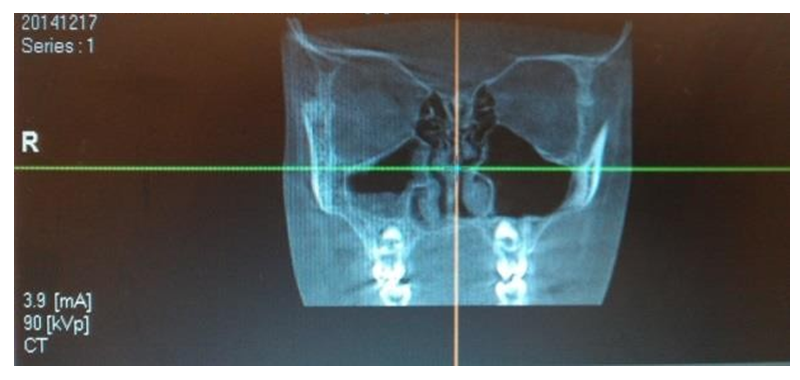 | Figure 7. Unilateral Maxillary Sinus Opacification |
 | Figure 8. Bilateral Maxillary Sinus Opacification |
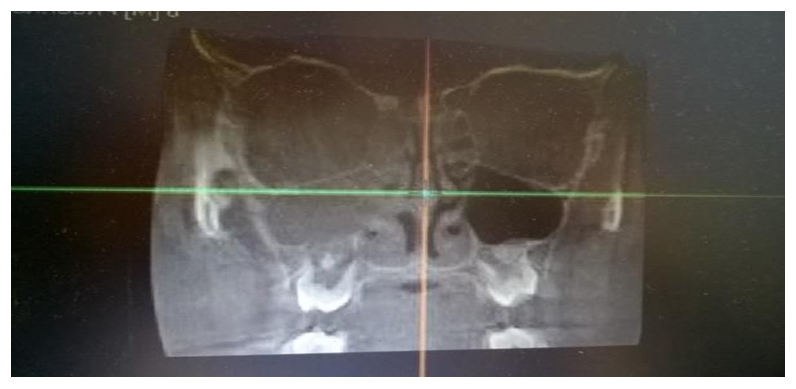 | Figure 9. Homogeneous Opacification of the Maxillary, Ethmoid, and Frontal Sinuses on One Side |
Since the initial characteristics of patients in both groups were similar, differences in treatment effectiveness can be attributed to the applied therapeutic methods. As part of the conducted analysis, the following relationships were identified:• A moderate positive correlation with high statistical significance was observed between the total leukocyte count and neutrophilic leukocytes in the complete blood count (correlation coefficient r = 0.476, p ≤ 0.001).• A weak positive correlation of moderate significance was found between the total leukocyte count and neutrophilic leukocytes in the rhinocytogram (correlation coefficient r = 0.264, p ≤ 0.006).It is worth noting that parameters such as "body temperature," "CFU titer," "lymphocytes in the rhinocytogram," and "saccharin test time" did not show statistically significant correlations with other variables, as indicated in Table 12 in the Appendix.Before treatment initiation, on the first day of observation, all patients underwent a thorough interview and examination, confirming the presence of clinical and rhinoscopic manifestations of chronic rhinosinusitis (CRS). After randomization, which divided participants into two groups for different therapeutic approaches, no statistically significant differences were found between the groups at baseline for all studied parameters, indicating equal conditions for assessing the effectiveness of subsequent treatment.
4. Conclusions
The study of the clinical and functional characteristics of chronic rhinosinusitis in children has provided significant data on the intensity of bacterial infection in the paranasal sinuses and its associated clinical manifestations. The results highlight the importance of a comprehensive approach to the diagnosis and treatment of chronic rhinosinusitis, which includes microbiological analysis for precise identification of pathogens and their antibiotic susceptibility, as well as the use of modern imaging techniques such as computed tomography and rhinoscopy.Data analysis has shown that the innovative treatment methods applied in the experimental group contribute to more effective symptom management and an improved quality of life for patients compared to standard methods used in the control group. This confirms the potential for implementing new therapeutic strategies in clinical practice.However, the study also highlighted the need for further research to investigate the long-term effects of new treatment methods, as well as to analyze disease recurrence in a broader context. In the future, it is essential to focus efforts on developing individualized treatment approaches that consider the unique characteristics of each child and the microbial landscape of their pathology.Thus, this study makes a significant contribution to the understanding of chronic rhinosinusitis in children.
References
| [1] | Garashchenko T.I. "Modern approaches to the treatment of rhinosinusitis and otitis as complications of acute upper respiratory tract diseases." Russian Otolaryngology. 2017; 1: 168-172. |
| [2] | Oboskalova T.A., Glukhov E.Yu., Lavrentyeva I.V., et al. "Treatment of inflammatory diseases of the female reproductive organs using medicinal solutions cavitated by low-frequency ultrasound." Yekaterinburg: "VIP-Ural"; 2020. |
| [3] | Makarochkin A.G., Chernyadyev S.A., et al. "Clinical aspects of low-frequency ultrasound use in pancreatic necrosis surgery." Textbook. Yekaterinburg: UGMA; 2017. |
| [4] | Abdulkerimov Kh.T., Kolesnikova A.V., Kartashova K.I. "The state of the problem of antibiotic resistance of major respiratory pathogens in Yekaterinburg." V St. Petersburg Forum of Russian Otolaryngologists; September 21-23, 2016; St. Petersburg. |
| [5] | Geisinger O.A., Ziganshin O.R., et al. "The use of ultrasonic cavitation therapy in the treatment of inflammatory diseases of the lower genital tract." Yekaterinburg: Publishing House of A.G. Mednikova; 2021. |
| [6] | Operating manual AUZh-100 "Fotek." Yekaterinburg; 2019. |
| [7] | Abdulkerimov Kh.T., Garashchenko T.I., Koshel V.I., Ryazantsev S.V., Svistushkin V.M. "Principles of etiopathogenetic therapy of acute sinusitis: Methodological recommendations." St. Petersburg: Poliforum Group; 2020. |
| [8] | International standards for the diagnosis and treatment of infectious diseases. "Guidelines for antibiotic therapy." Last update 2021. |
| [9] | Shestakova I.V., Larina V.N., Timofeeva A.B. "Changes in the microbial landscape in chronic diseases of the paranasal sinuses in children." Journal of Clinical Medicine. 2018; 96(2): 134-141. |
| [10] | Petrovsky F.A., Saveleva K.D., Ivanova O.E. "The impact of prolonged antibiotic therapy on the microflora of the paranasal sinuses." Medical Journal. 2022; 101(5): 728-734. |

 Abstract
 Reference
 Full-Text PDF
 Full-text HTML