Gafur - Akhunov Mirza Ali, Ibragimov Rafael, Rahmatov Behzodjon, Turdibekov Sherzod, Axraeva Dilnoza
The Center for Development of Professional Qualification of Medical Workers of the Republic of Uzbekistan
Copyright © 2024 The Author(s). Published by Scientific & Academic Publishing.
This work is licensed under the Creative Commons Attribution International License (CC BY).
http://creativecommons.org/licenses/by/4.0/

Abstract
The article presents data from a statistical analysis of lung cancer in the Republic of Uzbekistan. An analysis of standardized lung cancer morbidity indicators for the period 2016-2023 was conducted. Data analysis was conducted using descriptive statistics and multi-chamber regression analysis to identify factors influencing the frequency of lung cancer development. Standardized indicators of lung cancer morbidity were calculated using the direct standardization method. As a benchmark, we used the World Population Standard of 46 countries developed in 1960. Analysis results showed that in the Republic of Uzbekistan during the observation period from 2016 to 2023, there was a stabilization in lung cancer morbidity (5.59 in 2016 and 5.55 in 2023). The main risk factors are sex (men) and age (55-69 years). During the entire observation period, a high level of morbidity was identified in Tashkent city and Tashkent region, which may indicate the need for additional preventive measures and early detection of diseases in these regions.
Keywords:
Lung cancer, Standardized indicator, Rough indicator, Morbidity, Malignant neoplasms, Population size, Preventive measures
Cite this paper: Gafur - Akhunov Mirza Ali, Ibragimov Rafael, Rahmatov Behzodjon, Turdibekov Sherzod, Axraeva Dilnoza, Analysis of Standardized Indicators of Bronchial and Pulmonary Cancer in the Republic of Uzbekistan, American Journal of Medicine and Medical Sciences, Vol. 14 No. 12, 2024, pp. 3172-3179. doi: 10.5923/j.ajmms.20241412.18.
1. Introduction
Lung cancer has become the most common type in the system of cancer diseases. According to GLOBACAN (2020), it was detected in 2,160 million people a year, ranking 1st in mortality, and its frequency was more than 1.8 million people. This indicator was 40.2 per 100,000 population among men and 17.59 per 100,000 population among women (IACR, 2020) [1].High morbidity rates were noted in the United States of America, EU countries, and South America [2].Lung cancer ranks first in the Russian Federation, accounting for 12% of all malignant neoplasms, and mortality is 21%. In the Russian Federation alone, 66 thousand people are diagnosed with lung cancer every year. Meanwhile, mortality from lung cancer is 85% in men and 15% in women [3]. In most regions, a decrease in morbidity and mortality is observed as a result of large-scale preventive measures.In the Republic of Uzbekistan, lung cancer is one of the most common types of cancer among the population, and in recent years, there has been a trend towards an increase in its indicators. Specifically, according to the statistics of the Republic of Uzbekistan [4], in 2021, 1574 people were diagnosed with lung cancer for the first time, in 2022 - 1676, and per 100,000 population - 4.6 in 2021 and 4.7 in 2022. If this indicator was 4.4 in 2015, then there was an increase in its dynamics, i.e., to 5.0 in 2019 and to 4.7 in 2022. The annual mortality rate among newly diagnosed patients in 2015 was 37.4%, compared to 42.0% in 2021. Specifically, the 4th stage of the disease was observed in 39.5% of patients in 2021 and 36.9% in 2022.According to the analysis of available literature, it has been established that various exogenous and endogenous factors play an important role in the occurrence and development of lung cancer, most of which have molecular-genetic risk levels. Some studies in this direction have been conducted in Uzbekistan. In particular, the partially completed work is dedicated to the characteristics of ethnic and environmental factors of the disease [5]. The problem has not been fully studied [6,7].
2. Materials and Methods of Research
The design of this study is a retrospective cohort study. The research method used in this article is a secondary analysis of data from national health reports collected in Uzbekistan from 2016 to 2023.The analysis included all cases of lung cancer in Uzbekistan from 2016 to 2023. Data analysis was conducted using descriptive statistics and multidimensional regression analysis to identify factors influencing the incidence of lung cancer in Uzbekistan. Standardized indicators of lung cancer morbidity were calculated using the direct standardization method. As a benchmark, we used the World Population Standard, based on the population of 46 countries and developed in 1960. Standardized indicators and their 95% confidence interval were calculated for the incidence by year.The incidence of lung cancer was presented in the absolute number of cases and was stratified by gender, age groups, regions, and years of registration. Pearson's chi-square test (X2) was used to identify differences between the groups. The results were considered statistically significant at p < 0.05.The standardized indicators were calculated in version 4.3 using the "surveil" and "dsr" packages. The morbidity rates by region for 2023 are also presented for each 100 thousand population and the absolute number of cases. In the next stage, we considered the age-standardized indicators of lung cancer morbidity in the Republic of Uzbekistan for 2016-2023.
3. Results and Discussion
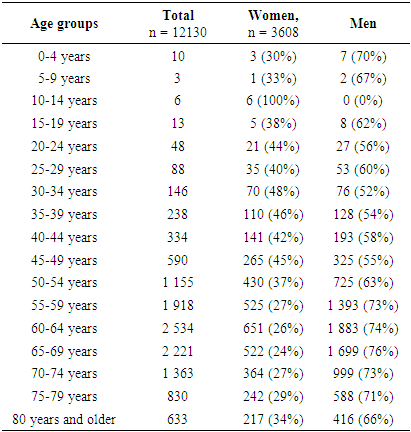
Between 2016 and 2023, 12,130 cases of bronchial and pulmonary cancer were registered in Uzbekistan. A study of lung cancer incidence data in Uzbekistan from 2016 to 2023 shows that the highest number of lung cancer cases is observed in people over 50 years old.Table 1. Number of cases of malignant neoplasms of the bronchi and lungs by age groups and gender, Uzbekistan, 2016-2023
 |
| |
|
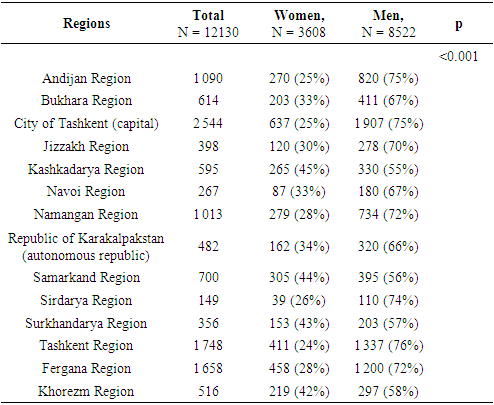
Patients aged 55 to 69 years make up a significant portion of all cases of the disease. For example, people aged 55-59 account for 16% of all cases, while patients aged 60-64 and 65-69 make a significant contribution, respectively, 21% and 18%.Analysis also shows that younger age groups (up to 50 years old) have a significantly lower proportion in the total number of cases of the disease. For example, people under the age of 50 make up less than 10% of the total number of lung cancer cases. These results highlight the importance of targeted preventive measures, especially for the elderly population, to reduce morbidity and improve public health in Uzbekistan.Analysis of data on the incidence of malignant neoplasms of the bronchi and lungs in Uzbekistan for 2016-2023 shows significant regional and gender differences. A total of 12,130 cases of the disease were registered, of which 8,522 were men and 3,608 were women. This indicates a clear predominance of the disease among men, which is confirmed by statistically significant differences (p<0.001). This corresponds to global trends where men are more likely to be at risk of developing lung cancer, possibly due to differences in behavioral factors and exposure to carcinogens.The highest number of cases was recorded in Tashkent city (2,544 cases) and Tashkent region (1,748 cases), which may be due to the high population density and exposure to risk factors in these regions.Table 2. Bronchial and pulmonary malignancies morbidity by region, Uzbekistan, 2016-2023
 |
| |
|
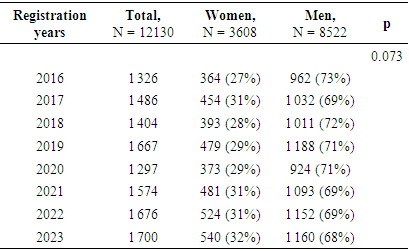
Andijan and Fergana regions also had high morbidity rates, with 1,090 and 1,658 cases respectively. The lowest number of cases was recorded in the Syrdarya region (149 cases) and Navoi region (267 cases), which may reflect differences in the population size or level of access to medical services.Gender differences in morbidity are significant in all regions. In the Tashkent region and Tashkent city, men account for 75% of all cases. At the same time, in Kashkadarya and Samarkand regions, the percentage of women among those infected is higher, amounting to 45% and 44% respectively. These data indicate the need for targeted preventive programs that take into account the peculiarities of the regions and the gender structure of the patients.Overall, the analysis results highlight the importance of regional measures for the prevention, early diagnosis, and treatment of bronchopulmonary cancer. Further research is needed to identify the causes of such significant differences in morbidity and to develop effective intervention strategies aimed at reducing morbidity and mortality from this disease.Analysis of data on the incidence of malignant neoplasms of the lungs and lungs in Uzbekistan from 2016 to 2023 shows different annual indicators reflecting changes in the number of registered cases. In 2016, 1,326 cases were registered (11%), which is the lowest annual share for the entire period.Table 3. Bronchial and pulmonary malignancies morbidity by year, Uzbekistan, 2016-2023
 |
| |
|
In 2017, the number of cases increased to 1,486 (12%), demonstrating an increase in morbidity. In 2018, 1,404 cases (12%) were registered, which is slightly less than in the previous year. The largest increase was recorded in 2019, when the number of cases reached 1,667 (14%). In 2020, there was a decrease to 1,297 cases (11%), which may have been due to the impact of the COVID-19 pandemic and reduced access to medical services.In 2021, the incidence again increased to 1,574 cases (13%), and in 2022 the number of registered cases reached 1,676 (14%), which was the second largest indicator for the entire period. In 2023, the maximum figure was recorded - 1,700.The increase in morbidity over the years can indicate an improvement in diagnosis and reporting, as well as an increase in the impact of risk factors. This analysis highlights the need for further efforts in the prevention and early diagnosis of malignant neoplasms of the lungs and bronchi in a timely manner.Standardization methodology. Standardized indicators of bronchial and pulmonary cancer morbidity were calculated using the direct standardization method. The World Population Standard, currently based on the population of 46 countries and developed in 1960, was chosen as the standard. This approach allows for the comparison of morbidity levels in different years or locations, taking into account the structure of age groups in the reference population.The analysis of standardized morbidity indicators was conducted using version 4.3 software, which ensures the accuracy and representativeness of the results. Morbidity rates were expressed both per 100,000 population and in absolute numbers of cases, which allows for a more complete assessment of morbidity scope in different periods of time.To improve the interpretation of the results, a 95% confidence interval was also calculated for each standardized indicator. This interval reflects the uncertainty of the assessment and helps to assess the statistical significance of differences between morbidity in different years.Therefore, the use of standardized morbidity indicators and their analysis allows for a more accurate assessment of the dynamics of bronchial and pulmonary cancer morbidity, their comparison in different periods of time and location, which is an important aspect of developing and implementing measures for the prevention and treatment of this type of cancer.Standardized indicators. Between 2016 and 2023, significant variability in the incidence of bronchial and pulmonary cancer among different age groups was observed in Uzbekistan. The highest standardized morbidity rates were recorded in the 60-64 age group, reaching a peak in 2019 at 40.62 (34.79-42.37 confidence intervals), and a relative decrease in subsequent years to 32.66 (30.08-36.27) in 2023.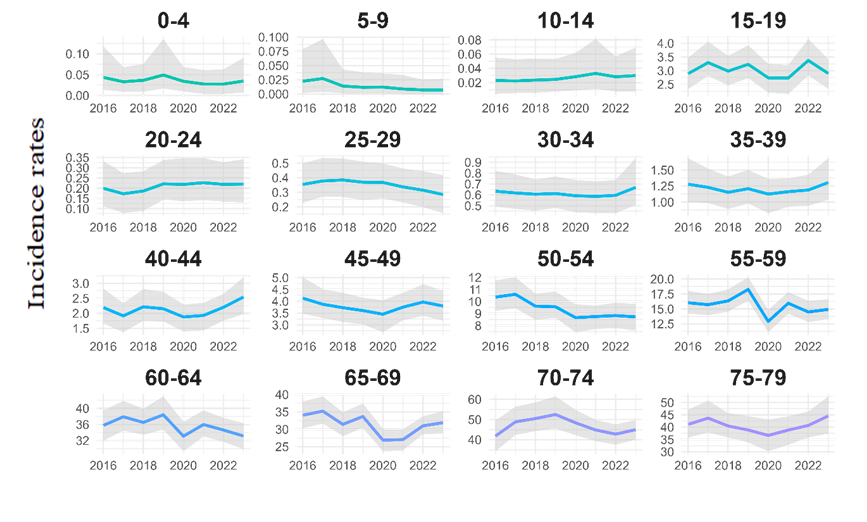 | Figure 1. Trends in the incidence of malignant neoplasms of the bronchi and lungs by age groups, 2016-2022, Uzbekistan |
This indicates the importance of age in the risk of developing this type of cancer.Relatively low morbidity rates were observed in children (0-4 years old) and adolescents (10-14 and 15-19 years old), where standardized indicators typically range from 0.00 to 0.11 with small confidence intervals, reflecting the low frequency of cases in these age groups.The 50-54 age group also shows high morbidity rates, especially in 2017 and 2018, with rates of 11.47 (9.40-12.37) and 9.03 (8.26-10.69) respectively. In subsequent years, this indicator remained above average compared to other age groups, emphasizing the need for targeted preventive measures and early diagnosis in this category of the population.Comparison of data by years also reveals a trend towards a slight decrease in morbidity in older age groups (65-69, 70-74, 75-79) after peak values in 2017-2019, which can indicate a dynamic in the field of healthcare organization and the application of preventive measures.For children aged 0 to 4 years, the average annual change in morbidity ranges from -31% to 40% (trust interval), indicating significant fluctuations throughout the period under consideration.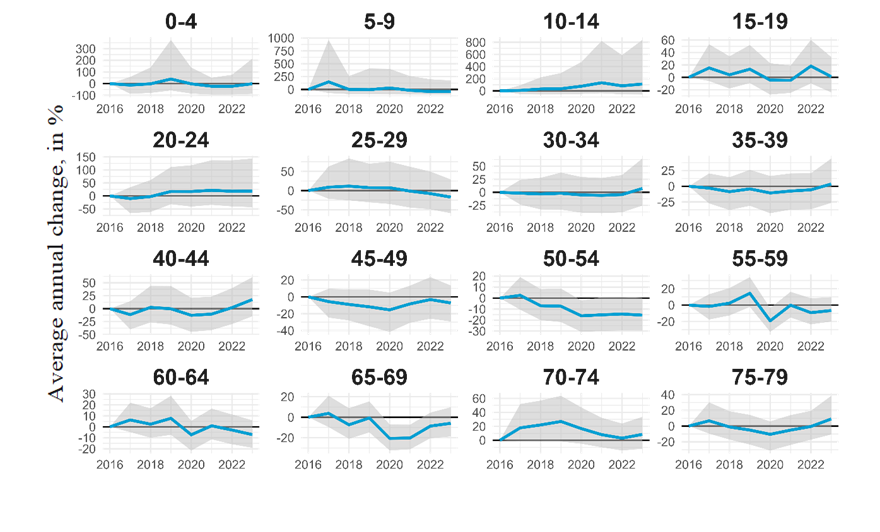 | Figure 2. The average annual percentage change in standardized indicators of bronchial and pulmonary malignancies by age group, Uzbekistan, 2016-2023 |
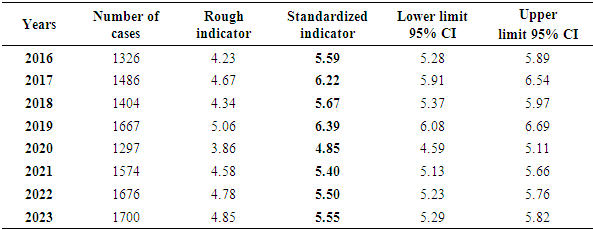
This group shows the lowest stability compared to other age groups, which may be related to higher variability of the disease in the early stages of life.In adolescents and young people aged 10 to 29 years, changes in morbidity are also observed, although within a narrower confidence interval. For example, among adolescents aged 10 to 14, the average annual change ranges from 96% to 857%, which can indicate significant changes in the health and lifestyle of young people in the country.Among the age groups over 50, the stability of the average annual change in morbidity is more pronounced, especially among people aged 70 to 79 and over 80, where the CPC values in most cases are positive. For example, among people aged 70 to 74, the average annual change is between 9% and 36%, which may indicate an improvement in medical care and a healthy lifestyle among the elderly.Therefore, the data shows differences in the trend of bronchial and pulmonary cancer morbidity depending on the age group, which can be useful for formulating targeted healthcare programs and medical interventions in the future. These results highlight the importance of analyzing age-related morbidity in developing cancer prevention and treatment strategies in Uzbekistan.Analyzing data on the incidence of bronchial and pulmonary cancer in Uzbekistan from 2016 to 2023, several key trends can be identified. Between 2016 and 2019, there was a general increase in both the number of cases and the standardized incidence rate.Table 4. Standardized indicators of malignant neoplasms of the bronchi and lungs, Uzbekistan, 2016-2023
 |
| |
|
In 2016, 1326 cases of the disease were registered, with a gross rate of 4.23 per 100,000 population and a standardized rate of 5.59 (5.28-5.89). In 2019, the number of cases increased to 1,667, the crude indicator was 5.06, and the standardized indicator reached 6.39 (6.08-6.69). This period is characterized by the greatest increase in morbidity, which can be attributed to various factors, including the improvement of diagnostic and registration systems.In 2020, there was a sharp decrease in morbidity: the number of cases decreased to 1,297, the crude indicator was 3.86, and the standardized indicator was 4.85 (4.59-5.11). This may be due to the COVID-19 pandemic, which may have affected access to healthcare and the diagnosis of other diseases. In subsequent years, the number of cases is growing again, reaching 1700 in 2023, but the standardized indicator remains more stable, reaching 5.55 (5.29-5.82) in 2023. This increase may reflect the gradual restoration of medical services and the improvement of diagnostics after the pandemic.The gross morbidity rate ranged from 3.86 in 2020 to 5.06 in 2019. The standardized indicator ranged from 4.85 (4.59-5.11) in 2020 to 6.39 (6.08-6.69) in 2019.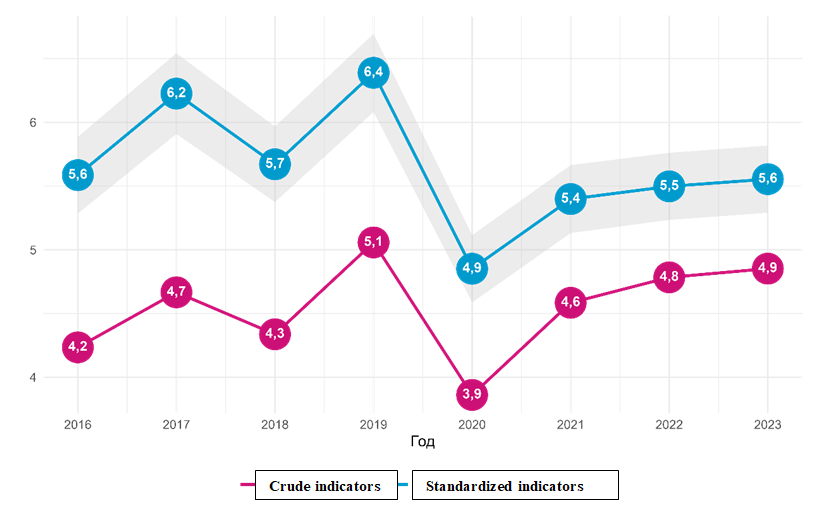 | Figure 3. Standardized indicators of malignant neoplasms of the bronchi and lungs, Uzbekistan, 2016-2023 |
The confidence intervals show that the greatest uncertainty is observed in the years with the lowest number of cases, such as in 2020. The stability of indicators in recent years indicates that the situation has gradually leveled off after the peak increase in morbidity in 2017-2019.Overall, the data indicates a trend towards a decrease in the incidence of bronchial and pulmonary cancer after a peak growth in 2017-2019. However, despite the reduction in rough and standardized indicators, continuing monitoring and research into factors influencing morbidity remains important for maintaining and improving the health of the population.Between 2016 and 2023, there are fluctuations in the standardized incidence of bronchial and pulmonary cancer in Uzbekistan. Overall, the country's trends indicate a slight change in morbidity, with an increase in some years and a decrease in others. For example, in 2016, the incidence rate was relatively high in some regions, such as Tashkent region (19.2, 16.5-21.9) and Tashkent city (24.4, 21.4-27.4). In 2020, there was a decrease in some areas, as in Tashkent region (18.4, 15.6-21.1) and Tashkent city (20.1, 17.6-22.6), but in others, such as Andijan region, there was an increase (13.1, 10.9-15.2). In 2023, the indicators in some areas rose again, as in Tashkent region (22.4, 19.6-25.2) and Fergana region (17.4, 15.2-19.7).A general analysis also shows that the incidence of bronchial and pulmonary cancer varied significantly across different regions (Table 5). In some regions, such as Navoi and Surkhandarya, relatively low rates were observed, while in others, such as Tashkent region and Tashkent city, the incidence rate was significantly higher. This difference may be due to differences in environmental, social, and medical factors affecting the health of the population in different regions.Table 5. Standardized indicators of bronchial and pulmonary malignancies by region, Uzbekistan, 2016-2023
 |
| |
|
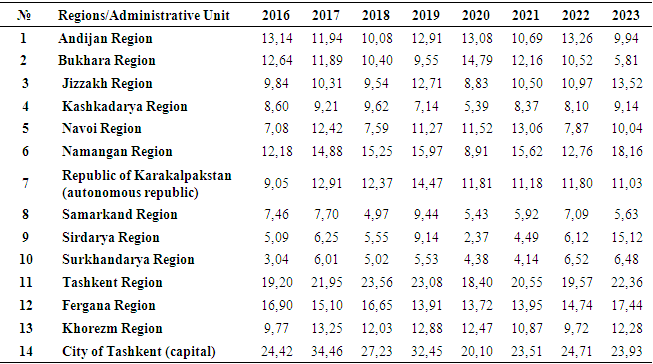
In Tashkent city, the incidence rate changed from 24.4 (21.4-27.4) in 2016 to 20.1 (17.6-22.6) in 2023.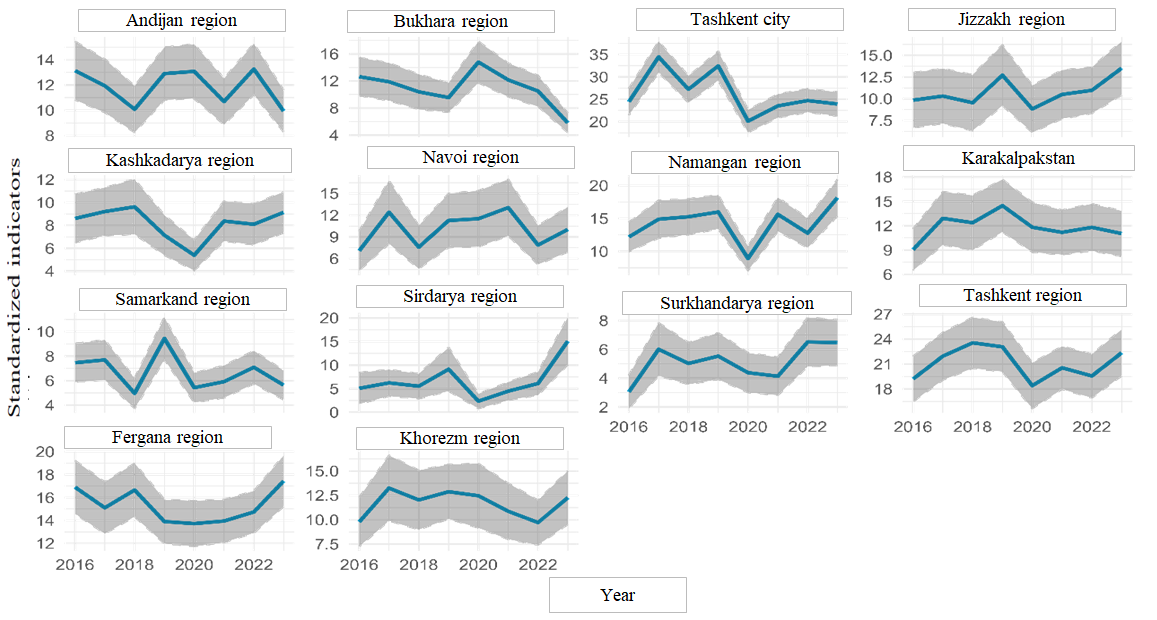 | Figure 4. Standardized indicators of bronchial and pulmonary malignancies by region, Uzbekistan, 2016-2023 |
In 2017, the indicator was 24.8 (21.7-27.9), after which it decreased to 19.3 (16.8-21.9) in 2018. Then there was an increase to 20.1 (17.6-22.6) in 2019 and stabilization at this level in 2020. In 2021, this indicator increased to 22.2 (19.3-25.2) and remained virtually unchanged in 2022 (22.4, 19.3-25.4).In Andijan region, the incidence rate ranged from 13.1 (10.8-15.5) in 2016 to 9.94 (8.29-11.6) in 2023. In 2017, there was a slight decrease to 11.9 (9.83-14.0), followed by a further decrease to 10.1 (8.25-11.9) in 2018. In 2019, there was an increase to 12.9 (10.8-15.0), which again changed by a decrease to 13.1 (10.9-15.2) in 2020 and to 10.7 (8.87-12.5) in 2021. In 2022, the indicator again increased to 13.3 (11.2-15.3).In the Bukhara region, a more stable picture was observed, with indicators starting from 12.6 (9.84-15.4) in 2016 to 5.81 (4.40-7.22) in 2023. In 2017, the indicator was 11.9 (9.10-14.7), in 2018 - 10.4 (7.81-13.0), then there was an increase to 14.8 (11.7-17.9) in 2019. In 2020, the indicator was 12.2 (9.68-14.6), then decreased to 10.5 (8.23-12.8) in 2021 and remained at the same level in 2022.In Jizzakh region, the incidence rate ranged from 9.84 (6.67-13.0) in 2016 to 13.5 (10.4-16.6) in 2023. In 2017, the indicator was 10.3 (7.16-13.5), then decreased to 9.54 (6.34-12.8) in 2018, after which there was another increase to 12.7 (9.22-16.2) in 2019. In 2020, the indicator decreased to 8.83 (6.13-11.5), then again increased to 10.5 (7.70-13.3) in 2021 and to 11.0 (8.32-13.6) in 2022.In the Kashkadarya region, the incidence rate decreased from 8.60 (6.50-10.7) in 2016 to 9.14 (7.36-10.9) in 2023. In 2017, the indicator was 9.21 (7.11-11.3), then decreased to 9.62 (7.23-12.0) in 2018 and continued to decrease to 7.14 (5.39-8.89) in 2019. In 2020, the indicator was 5.39 (4.06-6.72), after which there was an increase to 8.37 (6.63-10.1) in 2021 and stabilization at the level of 8.10 (6.31-9.89) in 2022.In Navoi region, the incidence rate changed from 7.08 (4.36-9.80) in 2016 to 10.0 (6.93-13.1) in 2023. In 2017, the indicator was 12.4 (8.05-16.8), then decreased to 7.59 (4.61-10.6) in 2018 and increased to 11.3 (7.54-15.0) in 2019. In 2020, the indicator was 11.5 (7.65-15.4), then increased to 13.1 (9.15-17.0) in 2021 and decreased to 7.87 (5.19-10.6) in 2022.In Namangan region, the incidence rate ranged from 12.2 (9.95-14.4) in 2016 to 18.2 (15.4-20.9) in 2023. In 2017, the indicator was 14.9 (12.0-17.7), then increased to 15.3 (12.5-18.0) in 2018 and increased to 16.0 (13.4-18.5) in 2019. In 2020, the indicator decreased to 8.91 (7.09-10.7), then increased to 15.6 (13.0-18.2) in 2021 and decreased to 12.8 (10.5-15.0) in 2022.In the Samarkand region, the incidence rate changed from 7.46 (5.89-9.03) in 2016 to 5.63 (4.45-6.82) in 2023. In 2017, the indicator was 7.70 (6.07-9.32), then decreased to 4.97 (3.73-6.21) in 2018 and increased to 9.44 (7.72-11.2) in 2019. In 2020, the indicator decreased to 5.43 (4.22-6.63), then increased to 5.92 (4.61-7.23) in 2021 and stabilized at 7.09 (5.74-8.44) in 2022.In the Syrdarya region, a significant change in the incidence rate was observed from 5.09 (1.77-8.42) in 2016 to 15.1 (10.1-20.1) in 2023. In 2017, the indicator was 6.25 (3.44-9.06), then decreased to 5.55 (2.91-8.18) in 2018 and increased to 9.14 (4.52-13.8) in 2019. In 2020, the indicator decreased to 2.37 (0.821-3.92), then increased to 4.49 (2.57-6.41) in 2021 and to 6.12 (3.67-8.57) in 2022.In Surxondaryo Region, the incidence rate changed from 3.04 (1.90-4.19) in 2016 to 6.48 (4.89-8.06) in 2023. In 2017, the indicator was 6.01 (4.17-7.85), then decreased to 2.67 (1.46-3.88) in 2018 and increased to 4.77 (3.38-6.16) in 2019. In 2020, the indicator decreased to 4.13 (2.90-5.36), then increased to 4.77 (3.32-6.22) in 2021 and to 5.51 (4.06-6.96) in 2022.In the Tashkent region, a slight decrease in morbidity was observed from 19.2 (16.5-21.9) in 2016 to 18.4 (15.6-21.1) in 2023. In 2017, the indicator was 20.3 (17.4-23.2), then decreased to 18.2 (15.4-21.1) in 2018 and increased to 20.6 (17.6-23.5) in 2019. In 2020, the indicator was 18.4 (15.6-21.1), then increased to 19.2 (16.2-22.2) in 2021 and to 20.4 (17.3-23.5) in 2022.In the Fergana region, the incidence rate changed from 15.3 (13.2-17.4) in 2016 to 16.5 (14.4-18.6) in 2023. In 2017, the indicator was 15.2 (13.1-17.3), then decreased to 11.5 (9.63-13.4) in 2018 and increased to 16.3 (14.2-18.4) in 2019. In 2020, the indicator decreased to 15.1 (13.1-17.1), then to 13.4 (11.4-15.5) in 2021 and again increased to 15.8 (13.8-17.9) in 2022.In the Khorezm region, there was a slight increase in the incidence rate from 4.44 (2.71-6.18) in 2016 to 6.26 (4.66-7.87) in 2023. In 2017, the indicator was 7.84 (5.36-10.3), then decreased to 7.01 (4.62-9.40) in 2018 and increased to 8.77 (6.26-11.3) in 2019. In 2020, the indicator decreased to 6.36 (4.48-8.24), then to 5.60 (3.87-7.33) in 2021 and again increased to 7.05 (5.14-8.95) in 2022.In the Republic of Karakalpakstan, the indicators ranged from 9.05 (6.49-11.6) in 2016 to 11.0 (8.24-13.8) in 2023. In 2017, the indicator was 12.9 (9.64-16.2), then decreased to 12.4 (9.01-15.7) in 2018 and increased to 14.5 (11.2-17.7) in 2019. In 2020, the indicator decreased to 11.8 (8.75-14.9), then to 11.2 (8.44-13.9) in 2021 and again increased to 11.8 (8.91-14.7) in 2022.Thus, when comparing regions, it can be noted that the highest morbidity rates were observed in the Tashkent region and the city of Tashkent during the entire period, which may indicate the need for additional preventive measures and early detection of diseases in these regions. At the same time, regions with low indicators, such as Surxondaryo Region, can be used as examples for studying and applying successful strategies to reduce the incidence rate.
References
| [1] | Sung, H., et al. (2021). Global Cancer Statistics 2020: GLOBOCAN Estimates of Incidence and Mortality Worldwide for 36 Cancers in 185 Countries. CA: A Cancer Journal for Clinicians, May 2021. |
| [2] | World Cancer Research Fund. (2023). Lung Cancer Statistics. Retrieved December 8, 2024, from https://www.wcrf.org/cancer-trends/lung-cancer-statistics/. |
| [3] | Nidulin, V. A., & Erdnieva, B. V. (2009). On the Epidemiology of Lung Cancer. Medical Bulletin of Bashkortostan, 4(1), 66–71. |
| [4] | Tillyashaikhov, M. N., Ibragimov, Sh. N., & Zhanklich, S. M. (2023). The State of Oncological Care for the Population of the Republic of Uzbekistan in 2023. Tashkent. |
| [5] | Zaridze, D. G. (2009). Cancer Prevention: A Guide for Physicians. IMA-PRESS. |
| [6] | Yang, I. A., Holloway, J. W., & Fong, K. M. (2013). Genetic Susceptibility to Lung Cancer and Co-Morbidities. Journal of Thoracic Disease, 5(Suppl 5), S454–S462. AME Publications. |
| [7] | Thun, M. J., & Henley, S. J. (2006). Tobacco. In Cancer Epidemiology and Prevention (Eds. D. Schottenfeld & J. F. Fraumeni), pp. 217–242. Oxford University Press. |

 Abstract
 Reference
 Full-Text PDF
 Full-text HTML