-
Paper Information
- Next Paper
- Previous Paper
- Paper Submission
-
Journal Information
- About This Journal
- Editorial Board
- Current Issue
- Archive
- Author Guidelines
- Contact Us
American Journal of Medicine and Medical Sciences
p-ISSN: 2165-901X e-ISSN: 2165-9036
2024; 14(11): 3010-3013
doi:10.5923/j.ajmms.20241411.74
Received: Oct. 27, 2024; Accepted: Nov. 23, 2024; Published: Nov. 27, 2024

The Role of the Angiogenic Factor VEGF-A and Ultrasound Examination in the Diagnosis of Adenomyosis
 Abstract
 Reference
 Full-Text PDF
 Full-text HTML
Raximova Z. A., Muminova Z. A.
Tashkent Medical Academy, Tashkent, Uzbekistan
Correspondence to: Raximova Z. A., Tashkent Medical Academy, Tashkent, Uzbekistan.
| Email: |  |
Copyright © 2024 The Author(s). Published by Scientific & Academic Publishing.
This work is licensed under the Creative Commons Attribution International License (CC BY).
http://creativecommons.org/licenses/by/4.0/

According to the World Health Organization, approximately 10% of women and girls of reproductive age worldwide suffer from endometriosis. This number is continuously increasing, and this condition has been classified as a modern-day epidemic. (WHO 2022). The pathogenesis and etiology of adenomyosis remain unidentified. The causes of adenomyosis development are reliably reflected in two theories: invagination and metaplasia. Determining the pathogenesis of this condition requires complex morphometric research.
Keywords: Endometriosis, Adenomyosis, “Junction zone”, Ultrasound examination (UTT), Magnetic resonance examination (MRT), Transvaginal sonography, Uterine artery dopplerometry
Cite this paper: Raximova Z. A., Muminova Z. A., The Role of the Angiogenic Factor VEGF-A and Ultrasound Examination in the Diagnosis of Adenomyosis, American Journal of Medicine and Medical Sciences, Vol. 14 No. 11, 2024, pp. 3010-3013. doi: 10.5923/j.ajmms.20241411.74.
Article Outline
1. Introduction
- According to the World Health Organization, approximately 10% of women and girls of reproductive age worldwide suffer from endometriosis. This number is continuously increasing, and this condition has been classified as a modern-day epidemic. (WHO 2022).As a result, the prevalence of adenomyosis reaches 70-90% as the most common form of genital endometriosis. (L.V. Adamyan, Russia 2022). Adenomyosis is a common cause of dysmenorrhea, infertility, menometrorrhagia, and chronic pelvic pain of varying intensity. It often leads to psychosomatic and autonomic disorders. (Sidorova I.S. and others).The pathogenesis and etiology of adenomyosis remain unidentified. The causes of adenomyosis development are reliably reflected in two theories: invagination and metaplasia. Determining the pathogenesis of this condition requires complex morphometric research.
2. Research Objective
- To determine the degree of adenomyosis by identifying the “transitional zone” in ultrasound examination, conducting functional testing using Doppler and analyzing the level of expression of VEGF-A in cervical tissue.
3. Research Methods
- The researches were conducted on women at the Gynecology Department of Tashkent City Maternity Complex No. 9 from 2021 to 2023.To identify adenomyosis at its initial stage, ultrasound data from 117 patients were analyzed, in whom varying degrees of diffuse adenomyosis were diagnosed based on clinical, instrumental, and biochemical examinations.Classification of patients into groups based on ultrasound criteria for the degree of adenomyosis.Group I - n=25, Grade I adenomyosisGroup II - n=23, Grade II adenomyosisGroup III - n=24, Grade III adenomyosisGroup IV (Control) - n=25, healthy women
4. Research Results
- The main reasons for patients with adenomyosis to visit the doctor included: dysmenorrhea (pain in the lower abdomen and painful menstruation starting 2-5 days before menstruation), irregular menstrual cycles prone to hypermenorrhea (prolonged bleeding lasting more than 7 days), a shortened cycle interval (menstruation occurring every 23-25 days), bleeding before and after menstruation, lack of ovulation during expected ovulation periods, varying intensity of uterine bleeding, and infertility lasting 2 to 6 years.At the initial stage of non-invasive instrumental diagnosis for adenomyosis, all patients in this study underwent ultrasound examination utilizing color Doppler imaging. The sonographic examination includes assessment of the size of the uterus, structural changes (such as the endometrium, “transition zone” and myometrium), as well as characteristics of blood supply based on qualitative and quantitative parameters of blood flow. Dynamic monitoring throughout the menstrual cycle is also included. The research was conducted during the first and second phases of the cycle.In patients with first-degree adenomyosis, the size of the uterus does not practically differ from that in group 4 (control-1). However, these patients already have an increase in the thickness, width, and volume of their uterus during the second phase of menstruation compared to the first phase. Although this is statistically insignificant, it is still a noticeable difference.In clinical groups 2 and 3, there was a statistically significant increase in uterine size during the first and second phases of the menstrual cycle, compared to group 4 (the control group) and clinical group 1.In our research, special attention was given to the “transition zone” (the layer of the myometrium immediately adjacent to the endometrium) during ultrasound examination, considering the development of adenomyosis with the penetration of the endometrium from the basal layer into the myometrium. In all patients of Group 1, ultrasound examination revealed that the echogenic zone adjacent to the endometrium (“transition zone”) measured up to 5.2 ± 1.9 mm during the proliferative phase of the menstrual cycle and up to 7.2 ± 2.6 mm during the secretory phase. In patients with Grade II adenomyosis (Group 2), the “transition zone” had a thickness of up to 12.4 ± 2.6 mm. In contrast, in Group 3, comprising patients with a more extensive form of adenomyosis, the “transition zone”. was poorly delineated, possibly due to the deep and widespread infiltration of endometrial elements into the myometrium. In our research, one of the most characteristic echographic features of adenomyosis observed in patients with stages II and III adenomyosis (Groups 2 and 3) was an increase in the thickness of the anterior and posterior uterine walls, noted in 17 patients (73.9%) and 24 patients (100%), respectively.Furthermore, the greatest increase in uterine wall thickness in Groups 2 and 3 was observed during the conditional second phase of the menstrual cycle (Table 1). A characteristic echographic feature of adenomyosis — the rounded (spherical) shape of the uterus — was observed in 77.6% of patients with stage II adenomyosis and 89.4% of patients with stage III adenomyosis during the second phase of the cycle. In contrast, the characteristic sphericity was noted in only 65.4% of patients with stage III adenomyosis and 32.2% of patients with stage II adenomyosis during the first phase of the cycle. Thus, early-stage adenomyosis is typically not characterized by uterine enlargement or the development of a rounded (spherical) uterine shape.
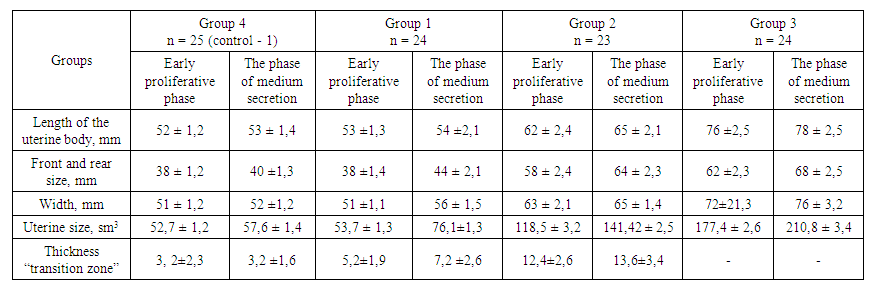 | Table 1. The size of the uterus and its structural elements in the dynamics of the menstrual cycle in patients with adenomyosis |
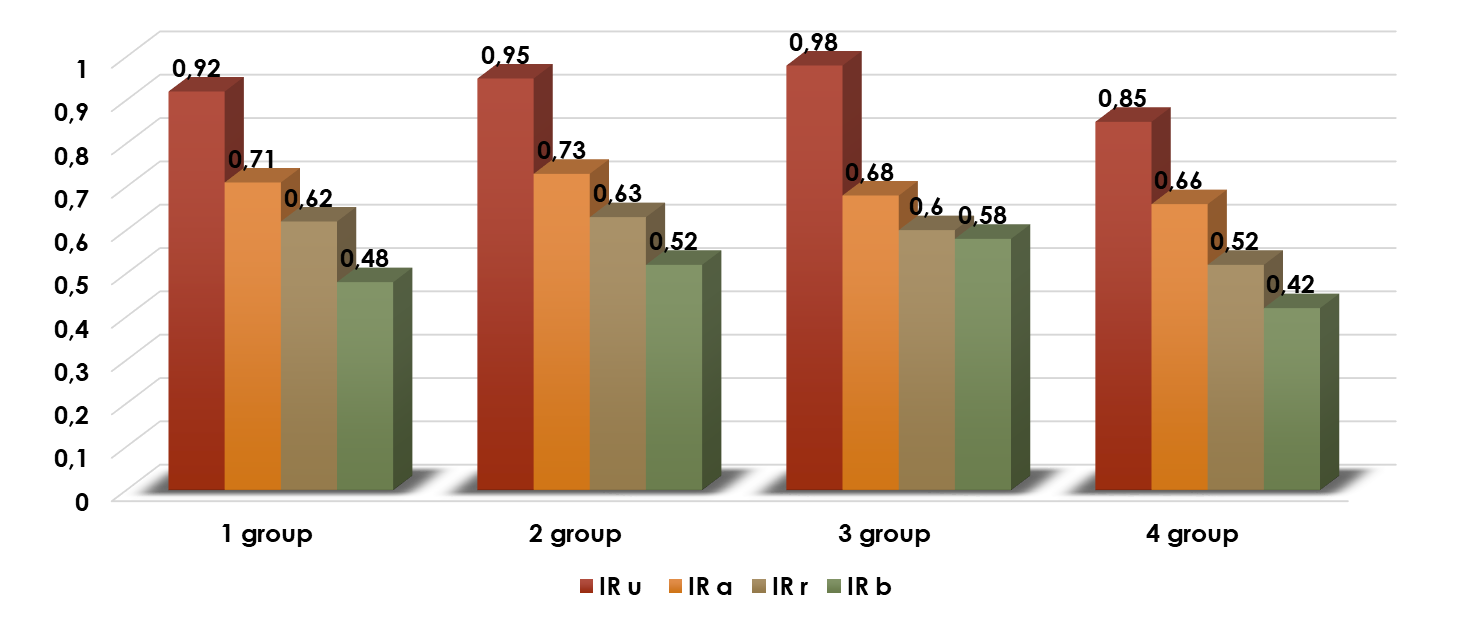 | Figure 1. Resistance Index (RI) in Healthy Women and Patients with Adenomyosis |
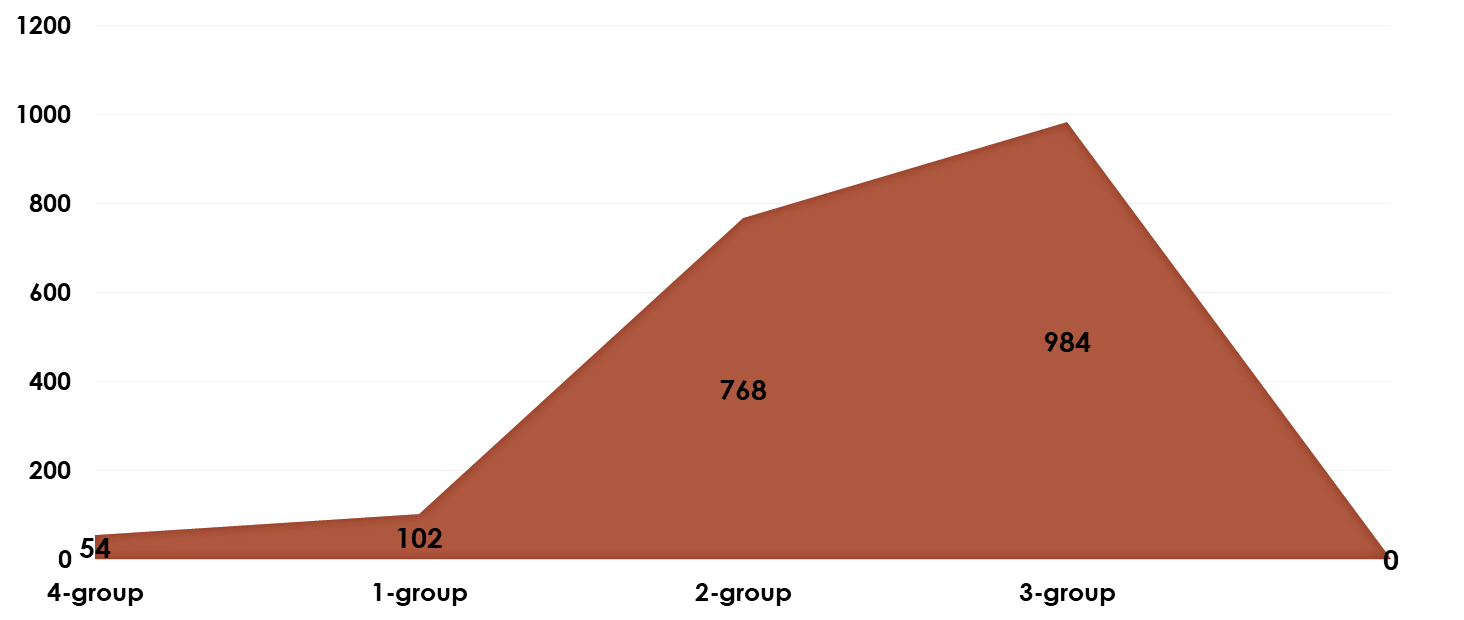 | Figure 2. VEGF-A Levels in Cervical Mucus of Patients with Adenomyosis Compared to Group 4 |
5. Conclusions
- 1. As the degree of adenomyosis increases, the severity of its clinical symptoms, as well as the findings from ultrasound and hysteroscopy, also increase. Grade I adenomyosis is characterized by minimal, non-patognomonic signs, and standard ultrasound examination lacks specificity.2. The imbalance between the increase of anti-angiogenic and pro-angiogenic growth factors in the “transition zone” of the endometrium and the functional test coefficient (direct positive correlation), even in Grade I adenomyosis, indicates a change in the autocrine regulation of angiogenesis. This alteration in the early stages of adenomyosis leads to an increase in the pathological proliferative activity of blood vessels.3. The ultrasound visualization of the “transition zone” with a thickness greater than 5 mm and the significant increase in vascular resistance in the uterine artery basin are echographic signs of Grade I adenomyosis. The use of a functional stress test during Dopplerometry of the uterine vascular basin increases the specificity and sensitivity of early ultrasound diagnosis.4. The ultrasound visualization of the “transition zone”, combined with the determination of VEGF-A expression levels in the cervical mucosa, and the use of a functional stress test, serves as a specific and sensitive non-invasive method for diagnosing Grade I adenomyosis.