Aslonov Farrukh1, Usmonov Isomiddin2
1Basic Medical Student, Assistant, Bukhara State Medical Institute, Bukhara, Uzbekistan
2Associate Professor, Bukhara State Medical Institute, Bukhara, Uzbekistan
Correspondence to: Aslonov Farrukh, Basic Medical Student, Assistant, Bukhara State Medical Institute, Bukhara, Uzbekistan.
| Email: |  |
Copyright © 2024 The Author(s). Published by Scientific & Academic Publishing.
This work is licensed under the Creative Commons Attribution International License (CC BY).
http://creativecommons.org/licenses/by/4.0/

Abstract
This study presents a comparative analysis of nephrotoxicity in patients with drug-resistant tuberculosis undergoing anti-tuberculosis therapy. The focus is on the dynamics of cystatin C levels in urine and glomerular filtration rate (GFR) to identify kidney function impairments at different stages of treatment. The study also examines the impact of demographic factors and comorbidities on the risk of nephrotoxicity. The findings highlight the necessity of regular kidney function monitoring to optimize therapy and reduce the risk of complications.
Keywords:
Tuberculosis, Multidrug-resistant tuberculosis, AKI, Nephrotoxicity, Cystatin C
Cite this paper: Aslonov Farrukh, Usmonov Isomiddin, Comparative Analysis of Glomerular Filtration Rate and Urinary Cystatin with Levels in Patients with Drug-Resistant Tuberculosis: The Impact of Demographic Factors, and Anti-Tuberculosis Treatment Regimens, American Journal of Medicine and Medical Sciences, Vol. 14 No. 10, 2024, pp. 2552-2556. doi: 10.5923/j.ajmms.20241410.23.
1. Introduction
Despite the fact that prolonged and complex treatment regimens with second-line drugs are associated with adverse drug reactions (ADRs), other potential factors should also be considered. Reports indicate that low baseline creatinine clearance (<60 ml/min) [5], advanced age [1,5,8], obesity [6], anemia, poor treatment adherence [7], and comorbidities [8] are predictors of ADRs. In addition, HIV co-infection has been significantly associated with an increased risk of ADRs [2,3]. ADRs are observed during both first-line and second-line anti-tuberculosis therapy [4].
2. Materials and Methods of Research
The study is based on data from 123 patients who underwent inpatient treatment in phthisiatric and pulmonology centers from 2019 to 2023. Of these, 31 patients (25.2%) were included in a prospective study and formed the main group, which received treatment in 2023. The remaining 92 patients (74.8%) were included in a retrospective study and constituted the comparison group.Exclusion criteria included patients who were not prescribed drugs for the treatment of MDR-TB, as well as those with mono-, polyresistant forms of tuberculosis and XDR-TB.The study utilized the analysis of cystatin C levels in urine as a biomarker of kidney function. This method allowed for the detection of early tubular dysfunction due to cystatin C's ability to serve as an indicator of tubular reabsorption. Cystatin C was measured using an enzyme-linked immunosorbent assay (ELISA), which provides high accuracy and diagnostic specificity. Urine samples (5-10 ml) were collected by qualified personnel, and kidney function was assessed by measuring serum creatinine and urinary cystatin C regularly throughout the intensive treatment phase. This approach has proven effective in the early diagnosis and monitoring of kidney diseases, opening up opportunities for improved clinical outcomes.The CKD-EPI equation, recognized as the most accurate method for estimating glomerular filtration rate (GFR), was used to calculate GFR. The latest revision of this equation was performed in 2021, as confirmed by the National Kidney Foundation's official website [https://www.kidney.org/content/ckd-epi-creatinine-equation-2021].The treatment of patients was carried out according to clinical protocols from 2019 to 2023. Patients in the control group were treated under the old protocol, approved by Order No. 383 of the Ministry of Health of Uzbekistan dated October 24, 2014. The remaining patients received therapy according to the new protocol, approved on February 14, 2020.
3. Research Results
Assessment of kidney function and the impact of anti-tuberculosis drugs.The study is dedicated to the analysis of kidney function in patients undergoing anti-tuberculosis therapy, with a focus on key markers of nephrotoxicity, such as GFR and cystatin C. These indicators allow for the assessment of the therapy's impact on kidney function. The presented tables reflect the study results, revealing the relationship between treatment and the development of nephrotoxicity. | Table 1. Urinary cystatin C level (by gender) |
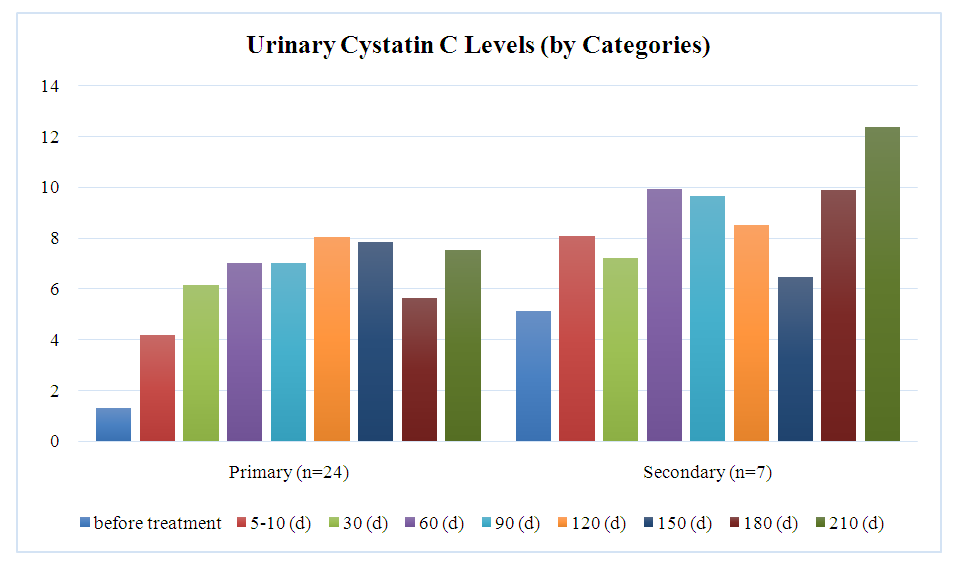
The graph demonstrates the dynamics of urinary cystatin C levels between genders, showing that in men (n=18), the level increased from 1.70 mg/L to a peak of 11.68 mg/L on day 210, then decreased to 8.25 mg/L by day 270. In women (n=13), initial levels were 2.78 mg/L, reaching a maximum of 8.26 mg/L on day 120 and decreasing to 3.04 mg/L by day 270. Differences between men and women were not statistically significant, with t/U-values ranging from 0.16 to 0.95. The average cystatin C level for both groups reached 8.20 mg/L on day 210 and decreased to 5.64 mg/L by day 270.Chart 1 represents the urinary cystatin C levels between patients with primary and secondary diseases at various stages of treatment. | Chart 1 |
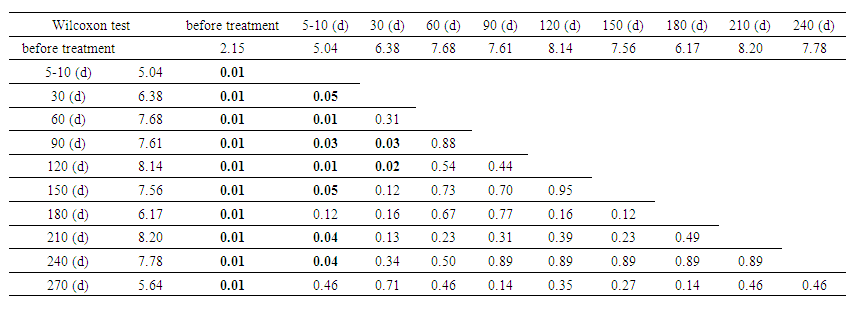
The analysis between categories showed that patients with primary disease (n=24) experienced an increase in urinary cystatin C levels from 1.30 mg/L to a peak of 8.03 mg/L on day 120, followed by a decrease to 5.64 mg/L on day 180. In contrast, patients with secondary disease (n=7) started with higher initial levels (5.10 mg/L), reaching a peak of 12.36 mg/L on day 210. Significant differences between the groups were observed before treatment (p =0.04) and on days 5-10 (p=0.05), but by day 210, the differences became statistically insignificant (p=0.57). Secondary patients consistently exhibited higher cystatin C levels throughout the treatment stages.Table 2 presents an analysis of the statistical significance of differences in urinary cystatin C levels across different treatment stages, using the Wilcoxon test. The cystatin C levels (in mg/L) are shown for ten distinct time points from the beginning of treatment up to 240 days. | Table 2. Analysis of statistical significance of differences in urinary Cystatin C levels over time |
The statistical significance of the difference in urinary cystatin C levels over time showed that cystatin C levels increased from 2.15 mg/L to 8.20 mg/L on day 210, demonstrating significant changes in renal function (P=0.01). The most significant changes (P<0.05) were observed between baseline and follow-up measurements. After 60 days, the changes began to stabilize, and by day 270, the level had decreased to 5.64 mg/L, with statistical significance decreasing (P=0.465). These data confirm the importance of monitoring cystatin C to assess renal function and treatment efficacy.The table below shows the evolution of GFR, as measured by the CKD-EPI formula, for two different patient categories – primary and secondary – over different treatment time intervals. | Table 3. Glomerular filtration rate by CKD-EPI (by category) |
Variation in GFR by time and category showed that in primary patients, GFR started at 84.2 mL/min, with peaks at days 150 and 225 (91 and 93.3 mL/min). In secondary patients, GFR started at 97.5 mL/min, decreased to 68.4 mL/min at day 180, and then recovered to 86.3 mL/min by day 240. Statistically significant differences were observed at the beginning of treatment (P = 0.007 and P = 0.009). Significance decreased over time, indicating convergence of treatment effects. These data highlight the dynamics of GFR changes, which is important for adjusting therapeutic plans.The presented tables show the dynamics of the GFR measured using the CKD-EPI formula for two groups of patients – the main and control. | Table 4. Glomerular filtration rate (GFR) by CKD-EPI (between groups) |
The same between-group analysis showed that the GFR in the study group started at 86.4 ml/min, peaked at 102.1 ml/min on day 210, and then decreased slightly. In the control group, the initial level was 90.5 ml/min, decreasing to 71.1 ml/min by the end of the period. Significant differences between the groups were noted at days 135 and 195 (P=0.05 and P=0.04). These data highlight the need for monitoring GFR to adapt treatment and detect changes in renal function early. | Table 5. Glomerular filtration rate (GFR) by CKD-EPI (by gender) |
Analysis of GFR between sexes showed that in men, GFR started at 94.3 mL/min, peaked at 85.9 mL/min on day 210, and then declined by day 240. In women, GFR started at 80.6 mL/min and peaked at 99.3 mL/min on day 225. The largest differences between sexes were observed at baseline (P=0.007) and mid-term (P=0.04 on day 45 and P=0.015 on day 105). These data highlight the importance of individualized treatment and regular monitoring of GFR to optimize therapy. | Table 6. Glomerular filtration rate (GFR) by CKD-EPI (between body mass index groups) |
In an analysis of GFR by BMI category, underweight patients started with 89.5 mL/min and ended with 76.9 mL/min. Normal weight patients decreased GFR from 92.8 to 84.9 mL/min. Overweight patients increased GFR from 80.7 to 99.3 mL/min, and obese patients decreased from 92.6 to 56.7 mL/min. Statistically significant differences by BMI were noted at baseline (P=0.01) but diminished over time, reflecting a waning effect of BMI on GFR with treatment. | Table 7. Paired comparisons of glomerular filtration rate between Kruskal -Wallis body mass index groups |
Kruskal-Wallis analysis showed that there was no statistically significant difference between the underweight and normal weight groups (P=0.6). However, overweight patients showed a significant decrease in GFR when compared with normal (P=0.05) and underweight (P=0.002). The obese group did not differ from the underweight and normal weight groups (P=0.8 and P=0.9), but showed a significant difference with overweight (P=0.04). These results confirm the effect of BMI on GFR, especially in overweight and obese patients. | Table 8. Glomerular filtration rate according to CKD-EPI depending on anti-tuberculosis therapy |
The GFR depending on anti-TB therapy showed that before treatment the GFR was similar in both groups: 90.30 ml/min/1.73 m² (Fql+Cs+Cfz+Lzd+Bdq) and 88.70 ml/min/1.73 m² (injectable ATDS), without significant differences (U=0.9). On the 180th day the GFR decreased to 66.95 ml/min/1.73 m² in the injectable ATDS group, while in the Fql+Cs+Cfz+Lzd+Bdq group it was 85.38 ml/min/1.73 m², and this difference became statistically significant (U=0.017). The results show a possible negative impact of injectable ATDS on renal function during long-term treatment. | Table 9. Renal epithelium in urine (by groups) |
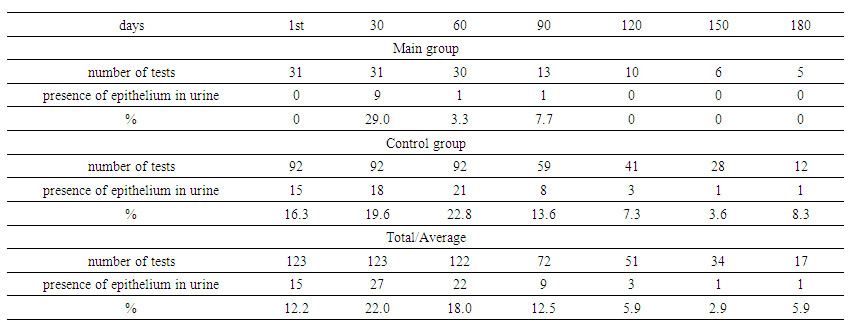
Renal epithelium in urine by groups showed that in the main group, the presence of renal epithelium in urine increased to 29% by day 30, then decreased to 3.3% by day 60, and disappeared by day 120. In the control group, epithelium was present in 16.3% on day 1, reached a peak of 22.8% on day 60, and then decreased to 3.6% by day 150. The overall maximum for both groups was on day 30 (22.0%), with a further decrease to 5.9% by day 180. These data indicate dynamic changes in renal epithelium in response to treatment. | Table 10. Renal epithelium in urine depending on anti-tuberculosis therapy |
The same analysis depending on anti-TB therapy showed that in patients on injectable anti-TB drugs, the renal epithelial cell count was significantly higher at all stages of treatment. Before treatment, this level was 2.18 versus 0.63 in the Fql+Cs+Cfz+Lzd+Bdq group (p=0.01). By day 30, the values were 3.00 and 1.59, respectively (p=0.04). On days 60 and 90, the differences remained significant (p=0.05 and p=0.018), with levels of 2.98 and 3.03 in the second group. On day 180, the difference decreased (2.80 versus 0.67), but statistical significance disappeared (p=0.442). These data indicate higher nephrotoxicity of injectable anti-TB drugs in the early stages of treatment.
4. Discussion
The study results show that urinary cystatin C is an important marker for detecting early kidney function impairment in patients with drug-resistant tuberculosis receiving anti-tuberculosis drugs. The observed differences between patients with primary and secondary tuberculosis indicate more pronounced kidney function changes in secondary patients, potentially due to cumulative effects of prolonged treatment and the presence of comorbidities. Differences in GFR between groups were less significant at later treatment stages, suggesting stabilization of kidney function on ongoing therapy. These findings confirm the need for an individualized approach to treatment and kidney function monitoring in patients with different forms of tuberculosis.
5. Conclusions
This study demonstrates that monitoring cystatin C levels and GFR is a key component in assessing nephrotoxicity in patients with drug-resistant tuberculosis. The findings emphasize the importance of timely detection of kidney function impairments for therapy adjustment and prevention of severe complications. Implementing these diagnostic and monitoring methods into clinical practice could significantly improve treatment quality and enhance safety.
References
| [1] | Abera W., Cheneke W., Abebe G. Incidence of antituberculosis-drug-induced hepatotoxicity and associated risk factors among tuberculosis patients in Dawro Zone, South Ethiopia: A cohort study // The International Journal of Mycobacteriology. – 2016. – T. 5. – no. 1. – P. 14-20. |
| [2] | Ahmad N. et al. Occurrence, management, and risk factors for adverse drug reactions in multidrug resistant tuberculosis patients // American journal of therapeutics. – 2018. – V. 25. – no. 5. – pp. e533-e540. |
| [3] | Bezu H. et al. Prevalence and risk factors of adverse drug reactions associated multidrug resistant tuberculosis treatments in selected treatment centers in Addis Ababa Ethiopia // Journal of Tuberculosis Research. – 2014. – V. 2. – No. 3. – pp. 144-154. |
| [4] | Brown CS et al. Determinants of treatment-related paradoxical reactions during anti-tuberculosis therapy: a case control study //BMC infectious diseases. – 2016. – V. 16. – P. 1-9. |
| [5] | Buziashvili, M., et al. "Rates and risk factors for nephrotoxicity and ototoxicity among tuberculosis patients in Tbilisi, Georgia." The International Journal of Tuberculosis and Lung Disease 23.9 (2019): 1005-1011. |
| [6] | Carroll MW et al. Frequency of adverse reactions to first-and second-line anti-tuberculosis chemotherapy in a Korean cohort // The International journal of tuberculosis and lung disease. – 2012. – V. 16. – No. 7. – pp. 961-966. |
| [7] | Chiang YC et al. Tobacco consumption is a reversible risk factor associated with reduced successful treatment outcomes of anti-tuberculosis therapy // International Journal of Infectious Diseases. – 2012. – V. 16. – no. 2. – pp. e130-e135. |
| [8] | Chung-Delgado K. et al. Factors associated with anti-tuberculosis medication adverse effects: a case-control study in Lima, Peru // PloS one. – 2011. – V. 6. – No. 11. – P. e27610. |


 Abstract
 Reference
 Full-Text PDF
 Full-text HTML