-
Paper Information
- Next Paper
- Previous Paper
- Paper Submission
-
Journal Information
- About This Journal
- Editorial Board
- Current Issue
- Archive
- Author Guidelines
- Contact Us
American Journal of Medicine and Medical Sciences
p-ISSN: 2165-901X e-ISSN: 2165-9036
2024; 14(9): 2376-2381
doi:10.5923/j.ajmms.20241409.54
Received: Aug. 20, 2024; Accepted: Sep. 15, 2024; Published: Sep. 30, 2024

Modern Aspects of Diagnostic Criteria for Insulin Resistance Syndrome
 Abstract
 Reference
 Full-Text PDF
 Full-text HTML
Ziyatova G. Z.1, Khadzhimetov A. A.2, Akhmadaliev N. N.3
1Applicant for the Department of Medical and Biological Chemistry, Tashkent State Dental Institute, Uzbekistan
2Professor of the Department of Medical and Biological Chemistry of the TSDI, Tashkent State Dental Institute, Uzbekistan
3Head of Department of Medical and Biological Chemistry TSDI, Tashkent State Dental Institute, Uzbekistan
Copyright © 2024 The Author(s). Published by Scientific & Academic Publishing.
This work is licensed under the Creative Commons Attribution International License (CC BY).
http://creativecommons.org/licenses/by/4.0/

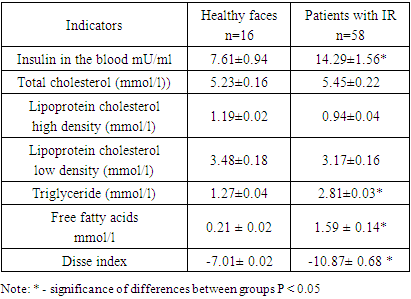
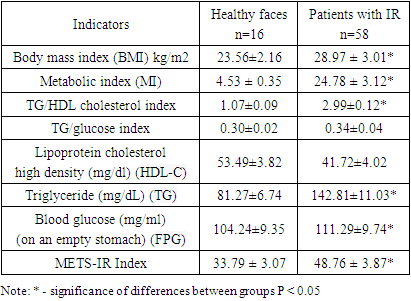
The purpose of this study was to evaluate the significance of non-insulin metabolic insulin resistance scales (METS-IR) for assessment risk of developing IR. 78 women with symptoms of insulin resistance, aged from 41 to 60 years, were examined. 16 healthy individuals served as controls. During the study, the following indices were calculated: BMI, MI, HOMA-IR, Disse and METS-IR. The blood lipid spectrum was studied. Against the background of insulin resistance, patients experience an increase in the level of C-reactive protein, C-peptide, insulin in the blood, which is confirmed by the index HOMA, which is elevated, indicating insulin resistance in the patients we examined. Similar dynamics were noted regarding the index Disse, which indicated the activation of the state of insulin resistance. High index values METS-IR demonstrated significant correlations with visceral, intrahepatic, and intrapancreatic fat in patients with IR.
Keywords: Insulin resistance, Diabetes type 2, Homeostasis, Obesity, Triglyceride, Cholesterol, Metabolic syndrome, Free fatty acids
Cite this paper: Ziyatova G. Z., Khadzhimetov A. A., Akhmadaliev N. N., Modern Aspects of Diagnostic Criteria for Insulin Resistance Syndrome, American Journal of Medicine and Medical Sciences, Vol. 14 No. 9, 2024, pp. 2376-2381. doi: 10.5923/j.ajmms.20241409.54.
1. Introduction
- The prevalence of insulin resistance has increased worldwide and averages between 15.5% and 46.5% of adults [1,2]. Insulin resistance is also a common pathophysiology of prehypertension and prediabetes [2]. In the long term, IR may not only directly lead to pathological conditions such as hyperglycemia, hypertension, hyperlipidemia, hyperuricemia, obesity, thrombotic state, elevated inflammatory markers and endothelial dysfunction [3,4], but also indirectly lead to metabolic diseases. such as diabetes, non-alcoholic fatty liver disease, cardiovascular disease and even death [5,6]. Progression of insulin resistance can lead to metabolic syndrome, non-alcoholic fatty liver disease (NAFLD) and type 2 diabetes [7,8]. Recently, there has been interest in the development of insulin resistance (IR) indices. Therefore, the search for new indicators characterizing IR in various pathological conditions has not stopped to this day. Currently, there are many ways to assess IR. To this end, some researchers have developed several indices to evaluate IR based on simple formulas, such as the Homeostasis Model Assessment for IR (HOMA-IR) [9], triglyceride to high-density lipoprotein cholesterol (TG/HDL-C) ratio and triglyceride glucose index (TyG index) [10,11]. However, these indices ignore the role of nutritional factors such as body mass index (BMI) in IR, so they also have certain limitations in building clinical disease prediction models. Meanwhile, METS-IR index is an etlon scale for assessing insulin sensitivity and identifying IR, combining laboratory and anthropometric indicators. The purpose of this study was to evaluate the significance of non-insulin metabolic insulin resistance scales (METS-IR) for assessment risk of developing IR in obese patients.
2. Material and Research Methods
- The material for this work was the results of a survey of 78 patients with symptoms of insulin resistance, aged from 41 to 60 years. 16 healthy individuals served as controls. Persons who did not make any complaints, had no history of diseases of the internal organs, and no pathology was found during examination and physical examination were considered practically healthy. A comprehensive clinical and laboratory study of patients with IR was carried out at the clinical bases of TSDI and TMA. Patients with established diabetes mellitus, coronary heart disease, congestive heart failure and pregnant women were excluded from the study. Informed consent was obtained from each participant and the study was conducted in accordance with the local ethics committee. All study participants underwent a thorough screening program that included assessment of a detailed personal and family history, physical examination, anthropometric measurements, and measurement of various biochemical parameters. The diagnosis of insulin resistance was made based on WHO criteria (Dedov I.I. Shestakova M.V., 2013). Venous blood was collected after an overnight fast, and plasma and serum samples were either used immediately for analysis or stored frozen at −80°C. Commercial enzyme test kits were used to determine serum high-density lipoprotein-cholesterol, triglyceride and total cholesterol concentrations, and low-density lipoprotein cholesterol was calculated using the Friedewald formula (low-density lipoprotein-cholesterol = total cholesterol - high-density lipoprotein cholesterol - triglyceride/5). mg/dl). The coefficient of variation between assays was less than 5.0% for high-density lipoprotein and cholesterol, less than 2.5% for triglycerides. Measurement of blood lipid parameters: total cholesterol (TC), triglycerides (TG), low-density lipoprotein cholesterol (LDL-C), high-density lipoprotein cholesterol (HDL-C) was carried out using a spectrophotometric method on a biochemical analyzer "Mindray" (China). During the study, the following indices were calculated: BMI, MI, HOMA-IR, Disse and METS-IR.BMI = weight (in kilograms): (height (m)2.Metabolic index (MI) = [TG (mmol/l) × fasting plasma glucose (mmol/l) / HDL cholesterol (mmol/l). IR index (HOMA-IR) = fasting glucose (mmol/l) × fasting insulin (µIU/ml) / 22.5. The degree of sensitivity of insulin resistance according to (HOMA), which was calculated according to the homeostasis model assessment (HOMA), was studied. An excess of the HOMA-IR index of more than 2.77 points indicated the presence of insulin resistance. The Disse index was calculated using the equation: Disse index = 12×(2.5×{[HDL cholesterol/total cholesterol (mmol/l)] - [FFA}) - insulin. Since the value of the Disse index is always less than zero, an increase in the index value corresponds to a decrease in RI. METS-IR index. This index is calculated using fasting glucose, TG and HDL cholesterol levels, as well as BMI. Here is how METS-IR is provided: Ln [(2 × fasting glucose (mg/dL)) + fasting TG (mg/dL)]×BMI (kg/m2))/ (Ln[high-density lipoprotein cholesterol (mg/dL) ) ]) or (ln ((2 × FPG) + TG) × BMI)/(ln (HDL-C). Statistical processing of the material was carried out using standard software packages (Statistica 6 0, Excel 2003). To determine the statistical significance of differences in continuous values depending on the distribution parameters, Student's t-tests or the Mann-Whitney test were used. For all analyses, differences were considered significant at a significance level of p<0.05.
3. Research Results
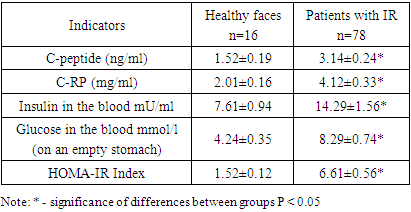
- The gold standard for measuring insulin resistance (IR) is the hyperinsulinemic-euglycemic glucose clamp test. Calculation of insulin resistance is based on the body's glucose utilization and body size. The homeostatic model assessment of insulin resistance (HOMA-IR), based on fasting glucose and insulin levels, is a widely used measure of insulin resistance in various studies. HOMA is a mathematical model that predicts IR simply by measuring insulinemia and fasting blood glucose and correlates well with the hyperinsulinemic-euglycemic clamp method, which is considered to have a standard for measuring IR. In our studies, the value of the Homa-IR index for diagnosing IR was high. As can be seen from the presented results of the study (Table 1), against the background of insulin resistance, patients also experience an increase in the level of C-reactive protein in the blood by 2.1 times, C-peptide by 2 times, which is accompanied by an increase in insulin in the blood by 1.9 times. background of hyperglycemia. The observed dynamics regarding carbohydrate metabolism markers is confirmed by the index HOMA, which increases in the blood of patients with IR by an average of 4.3 times, which indicated insulin resistance in the patients we examined. Although HOMA-IR is a widely used feasible method for assessing insulin resistance, there is significant random variability in HOMA-IR levels. Some studies have reported that HOMA-IR provides a valid assessment of insulin sensitivity in patients with type 2 diabetes, other studies have reported that HOMA-IR may not be a reliable predictor of insulin resistance compared with the gold standard euglycemic clamp in certain areas. population groups such as elderly patients with poorly controlled diabetes. Thus, the most commonly used HOMA index are reliable, accurate and reproducible methods that adequately predict changes in insulin sensitivity after therapeutic interventions, as well as the onset of diabetes. It must be remembered that the kidneys play an important role in the elimination of insulin, and impaired renal function can affect the level of this index.
|
|
|
4. Discussion
- Insulin resistance is one of the main factors aggravating metabolic syndrome. There are many methods for assessing insulin resistance: from complex to simple indicators. For all methods of assessing insulin resistance, it is important that their validity and reliability be established before they are used as research. The reference methods of the hyperinsulinemic euglycemic clamp test and its alternatives to the commonly used intravenous glucose tolerance test are the most reliable methods available for assessing insulin resistance. However, many simple methods from which indexes can be derived have been evaluated and tested, e.g. homeostasis model assessment (HOMA), quantitative insulin sensitivity test index (QUICKI). Given the growing number of simple HI measures, it may be difficult for clinicians and researchers to select the most appropriate index for their studies. This article provides guidelines and tips to consider before you begin your research. As you know, everything tissues with insulin receptors can become insulin resistant, but the tissues that primarily cause insulin resistance are the liver, skeletal muscle, and adipose tissue. Insulin resistance impairs glucose utilization, leading to a compensatory increase in beta cell insulin production and hyperinsulinemia.Investigating the state of insulin resistance Himsworth [23], showed that simultaneous injection of glucose and insulin in patients with diabetes leads to two results. However, some diabetics responded to the challenge with stable or low blood glucose levels. He called them insulin sensitive. In others, this provocation significantly increased blood glucose levels, and they turned out to be insensitive to insulin. Consequently, the second group of patients are typical of insulin resistance metabolic syndrome [18-22]. This insulin resistance requires increased insulin secretion to pulse, so fasting plasma insulin levels increase [24-30]. However, we need to take a differentiated approach to this issue, i.e. whether insulin resistance is due to "receptor defects" (i.e., decreased expression of INSR on the cell surface) or "post-receptor defects" (i.e., signal transduction defects) (i.e., signal transduction defects) [31]. Insulin resistance syndrome, formerly known as insulin receptor abnormalities, is characterized by a marked reduction in insulin action due to a functional impairment of insulin receptor signaling [32].There is some evidence that the molecular mechanisms involved in IR may include inflammation, mitochondrial dysfunction, oxidative stress, endoplasmic reticulum stress, and insulin receptor mutation [33]. This syndrome has traditionally been classified into type A and type B conditions, caused by abnormalities of the insulin receptor gene and insulin receptor autoantibodies, respectively [34]. The concept of insulin resistance syndrome was first proposed by Kahn et al in 1976 [35]. Although more than 25 years have passed since the publication of the study group's report, no changes have been made to the proposed diagnostic criteria. Moreover, there has been a need to clarify the classification of individuals with insulin receptor autoantibodies who exhibit hypoglycemia but not insulin resistance, possibly as a result of agonistic nature of antibodies [36]. Thus, insulin resistance syndrome is traditionally divided into type A, caused by abnormalities of the insulin receptor gene (INSR), and type B, caused by autoantibodies to the insulin receptor [37]. An accurate diagnosis of genetic syndrome of insulin resistance is determined by detecting mutations that likely affect the function of INSR or genes associated with insulin receptor signaling (including PIK3R1, AKT2, TBC1D4, and PRKCE) [38], together with the presence of characteristic clinical signs. Type B, caused by autoantibodies to the insulin receptor, is characterized by a sharp weakening of insulin action due to autoantibodies to the insulin receptor. Which is manifested by hyperinsulinemia, fasting serum insulin level > 30 µU/ml, hyperglycemia, hypoglycemia, autoimmune diseases (including systemic lupus erythematosus, Sjogren's syndrome and Hashimoto's disease) or abnormal immunological testing results. At the same time, insulin resistance syndrome is characterized by pronounced weakening of insulin action due to autoantibodies to the insulin receptor. The presence of insulin resistance can be determined on the basis of endogenous hyperinsulinemia using various indices. It is important to remember that about 76% of cases of type B insulin resistance syndrome are complicated by hypoglycemia [39], which is therefore an important clinical sign along with hyperglycemia. Moreover, among the examined individuals with this syndrome, 67% had other autoimmune diseases or abnormalities in immunological tests. The most common associated autoimmune disease was systemic lupus erythematosus (20%), as well as mixed connective tissue disease, Sjögren's syndrome, thrombocytopenia, and autoimmune diseases. Currently, only free fatty acid (FFA) meets these three criteria in patients. Since insulin-stimulated glucose uptake under euglycemic-hyperinsulinemic clamp conditions occurs mainly (more than 80%) in skeletal muscle [40], this suggests that FFAs cause acute insulin resistance in skeletal muscle. Acute increases in plasma FFA levels to levels often observed in obese individuals also inhibit insulin suppression of hepatic glucose production. This FFA-induced acute hepatic insulin resistance is primarily due to inhibition of insulin-mediated suppression of glycogenolysis with little or no acute effect on gluconeogenesis [41]. It should be noted that the level of FFAs increased during IR causes over synthesis of reactive oxygen species in the mitochondria of macrovascular endothelial cells, which leads to the oxidation of LDL-C and modification of HDL-C. At the same time, a high level of FFA is associated with increased formation of reactive oxygen species in mitochondria (oxidative stress), which ultimately leads to a decrease in the ability of cells to adequately respond to the action of insulin. Thus, the critical role of elevated plasma FFA levels as a cause of insulin resistance has been established. In addition, it has recently been recognized that FFAs simultaneously induce insulin resistance and activate the pro-inflammatory NF-κB pathway, leading to the secretion of many pro-inflammatory and pro-atherogenic cytokines and chemokines and the enhancement of the pro-oxidant system. Thus, quantification of IR may be useful in detecting its presence and assessing its severity, especially in subjects who have not yet developed abnormal glucose tolerance or diabetes. Although the presence of IR can be assessed clinically, its quantification in a clinical context is not currently common practice. Its quantification is largely limited to scientific research. Thus, biological variability should be considered whenever biochemical markers that are directly or indirectly affected by insulin are used to assess IR.