-
Paper Information
- Previous Paper
- Paper Submission
-
Journal Information
- About This Journal
- Editorial Board
- Current Issue
- Archive
- Author Guidelines
- Contact Us
American Journal of Medicine and Medical Sciences
p-ISSN: 2165-901X e-ISSN: 2165-9036
2024; 14(9): 2218-2222
doi:10.5923/j.ajmms.20241409.19
Received: Aug. 23, 2024; Accepted: Sep. 11, 2024; Published: Sep. 13, 2024

The Use of Various Regimens of Cholecalciferol Therapy in Obese Children with Vitamin D Deficiency and Deficiency
 Abstract
 Reference
 Full-Text PDF
 Full-text HTML
Garifullina Lilya Maratovna1, Ashurova Maqsuda Jamshedovna2
1Associate Professor, Head of the Department of Pediatrics, Faculty of Medicine, Samarkand State Medical University, Uzbekistan
2Assistant of the Department of Pediatrics of the Medical Faculty of Samarkand State Medical University, Uzbekistan
Copyright © 2024 The Author(s). Published by Scientific & Academic Publishing.
This work is licensed under the Creative Commons Attribution International License (CC BY).
http://creativecommons.org/licenses/by/4.0/

Vitamin D deficiency is prevalent in children, particularly those with obesity. This study investigated the efficacy of different cholecalciferol therapy regimens in optimizing vitamin D levels in obese children with deficiency. We recruited a cohort of obese children with confirmed vitamin D deficiency and assigned them to various cholecalciferol treatment groups based on dosage, frequency, and duration of supplementation. We then monitored their vitamin D levels over time using standard laboratory tests. Our findings will be presented, highlighting the most effective cholecalciferol regimens for achieving optimal vitamin D status in this population. This research aims to provide valuable insights for clinicians seeking to optimize vitamin D therapy in obese children, contributing to improved bone health and overall well-being.
Keywords: Vitamin D, Obesity, Overweight, Parathyroid hormone, Calcium, Phosphorus, Densitometry, Bone mineral density
Cite this paper: Garifullina Lilya Maratovna, Ashurova Maqsuda Jamshedovna, The Use of Various Regimens of Cholecalciferol Therapy in Obese Children with Vitamin D Deficiency and Deficiency, American Journal of Medicine and Medical Sciences, Vol. 14 No. 9, 2024, pp. 2218-2222. doi: 10.5923/j.ajmms.20241409.19.
1. Introduction
- Recent data indicate the relationship of obesity with vitamin D deficiency, while there is the same relationship with the companion of obesity as insulin resistance, vitamin D has an adverse effect on insulin secretion, i.e. biologically active metabolites of vitamin D contribute to the prevention and therapy of obesity and diabetes [1,2]. Currently, there is an insufficiency, and to a greater extent a deficiency of 25(OH)D represent a pandemic affecting the majority of the general population, including children and adolescents. The same situation is observed in Uzbekistan, which is confirmed by various studies conducted in the country. As in many countries of the world, vitamin D deficiency is typical for all age groups [3,4,5]. The high relevance of the problem and the lack of domestic recommendations on the dosage of vitamin D preparations, taking into account body weight, led to an attempt to create a scheme for the prevention and correction of hypovitaminosis D in school-age children using an aqueous solution of cholecalciferol, depending on body weight. The purpose of the work: to develop optimal algorithms for the correction and prevention of vitamin D deficiency and insufficiency in obese children.
2. Materials and Methods
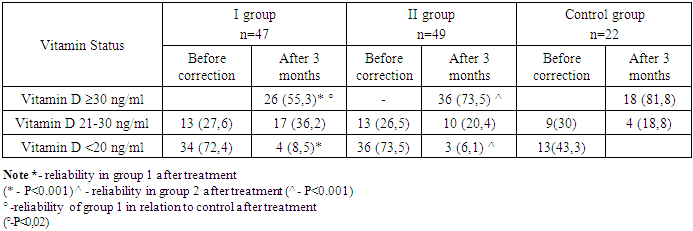
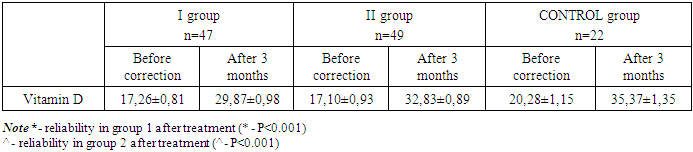
- Our research was conducted in family polyclinics No. 1 and 2 of the city of Samarkand, as well as in the regional endocrinological dispensary. 96 children with different body weights, without chronic pathology, which can negatively affect phosphorus-calcium metabolism and bone metabolism, aged 7 to 17 years (the average age of children was 11.56±0.23 years), who made up the general group, were examined. The control group included 22 practically healthy children, without pathology of the musculoskeletal system. Anthropometric studies were carried out using standard measuring instruments (floor height meter and medical scales). Anthropometric measurements included: measurements of height, body weight, waist and hip circumferences. The comparison of the data obtained and the assessment of physical development were carried out according to the consolidated centile tables of the distribution of height and body weight depending on age and gender for children aged 5-19 years [6]. Based on the measurements performed, the body mass index (BMI) was calculated. The results were evaluated using the standard deviations of BMI (SDS – standard deviation score), according to WHO recommendations. Obesity in children and adolescents should be defined as +2.0 SDS BMI, overweight from +1.0 to +2.0 SDS BMI, and body weight deficiency from -1.0 to -2.0 SDS BMI [6]. The study of the main indicators of mineral metabolism was carried out on the basis of a single study of serum concentrations of total calcium and phosphorus. As a marker of bone formation in blood serum, we studied the activity level of alkaline phosphatase (alkaline phosphatase) by spectrophotometric method. As a marker of bone resorption, we determined the level of morning calcium in the urine. Definition 25(HE)D was performed by the chemiluminescent method using Roche Diagnostics kits and calibrators (Germany) on an Abbott Architect 8000 analyzer (USA). The results were evaluated in accordance with the recommendations of the European Society of Endocrinology (2011) [7]: vitamin D - 25 deficiency(OH)D less than 20 ng/ml (less than 50 nmol/L); vitamin D deficiency - 25 (OH)D 20-29 ng/ml (51-75 nmol/L); normal vitamin D content - 25 (OH)D 30-100 ng/ml (76-250 nmol/l). The determination of bone mineral density (BMD) was evaluated by the method of dual–energy X-ray absorptiometry (DEXA) using the OsteoSys - Neo DEXXUM osteodensitometer using children's programs. The bone mineral density of the lumbar spine (frontal projection, L1-L4) was assessed in all children and adolescents examined by us, To achieve the purpose of the study and conduct a comparative study, all children of the main group with different body weight and Vitamin D levels: 21-30 ng/ml and Vitamin D: <20 ng/ml were divided into two groups by simple randomization Group I - 47 children with vitamin D deficiency and deficiency, included patients with different body weight (BMI SDS +1.0 to ≥+3.0), received an average level of cholecalciferol at a dosage of 2000 U/day for 3 months, then switching to a preventive dose of 1000 U / day. This group of children received 180,000,000 meals in the first 90 days of treatment. Group II - 49 children with different body weight (BMI SDS +1.0 to ≥+3.0) and vitamin D levels, received differentiated doses of cholecalciferol: in children BMI +1.0 to +2.0 SDS, vitamin D was used at a daily dose of 2000 units/day, BMI >+2<+3 SDS at a daily dose 3000 U / day and in children with a BMI ≥ +3 SDS at a dose of 4000 U / day for 3 months, then switching to a preventive dose of 1000 U for 3 months. The course therapeutic dose of vitamin D in children with a BMI of +1.0 to +2.0 SDS was 180,000,000 units, in children with a BMI of >+2<+3 SDS 270,000,000 units and in children with a BMI of ≥+3 SDS 360,000,000 for 3 months. The vitamin D preparation was given against the background of treatment of overweight and obese children, which included adherence to a hypocaloric diet, increased physical activity and giving metformin to children over 10 years old with obesity of 1-3 degrees with pathology in carbohydrate metabolism, at a daily dosage of 500 mg / day for 2 months. In children of the control group (22 children) with vitamin D deficiency and deficiency, cholecalciferol was used at an average daily dosage of 2000 units recommended by a number of studies. A preparation of an aqueous solution of vitamin D (cholecalciferol - 500 IU - in 1 drop) was used. Statistical processing of the received data was carried out on a personal computer by the Statistical 10 program. Methods of variation parametric and nonparametric statistics were used to determine the arithmetic mean (M), the mean square deviation (σ), the standard error of the mean (m), and relative values (frequency, %). The statistical significance of the measurements obtained was determined by the Student's criterion (t) with the calculation of the probability of error (P). Against the background of a three-month course of taking the drug cholecalciferol, a positive result was observed in both groups, which consisted in a significant decrease in children with vitamin D deficiency and insufficiency. Thus, in children of group 1, the frequency of children with vitamin D deficiency decreased from 34 children (72.4%) to 4 children (8.5%) (p<0.001), while the frequency of children with vitamin D deficiency increased from 13 (27.6%) to 17 children (36.2%) (p>0.5), against the background of the appearance of children with normal vitamin D levels, 26 children (55.3%) (p<0.001) (table 1). In children taking vitamin D, depending on body weight, there was also a significant positive trend in improving vitamin D indicators, with its deficiency from 36 children (73.5%) to 3 children (6.1%) (p<0.001), a decrease in the incidence of insufficiency from 13 cases (26.5%) to 10 cases (20.4%), with a significant increase in the frequency of occurrence of normal vitamin D levels - 36 cases (73.5%) (p<0.001).
|
|
|
3. Results and Discussions
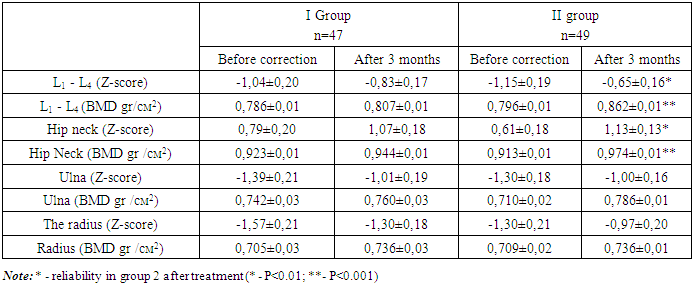
- At the present stage, the obesity pandemic, and similarly the pandemic of vitamin D deficiency among the child population, is actively discussed in domestic and foreign literature. According to various authors, there is a wide prevalence of reduced vitamin D availability due to various factors in up to 90% of the population [1,8]. At the same time, vitamin D deficiency is as widespread among the child population as among adults [5,8]. Modern authors consider obesity as a precursor or companion to the development of osteopenia. Studies conducted by a number of authors have shown that an increase in fat mass is associated with low bone mineral density [9,10,11]. Accurate diagnosis of "osteopenia and osteoporosis", especially in the pediatric population, is possible and advisable when using X-ray densitometry (the "gold standard" for bone mineral density studies), which takes into account height and age, and also has the ability to compare the data obtained with relevant pediatric databases. Scientists around the world disagree on the issue of prescribing a single dose of vitamin D for treatment and prevention. This is due to variations in age, weight indicators, the presence of comorbid pathology and many other factors [5,11]. In this regard, a differentiated approach was applied to prescribe an aqueous solution of cholecalciferol depending on SDS BMI, which showed statistically significantly better results in normalizing the pathological level of vitamin D and, along with normalization of vitamin D status, had a positive effect on bone resorption processes, and also contributed to improving BMD indicators in terms of rengenological densitometry.
4. Conclusions
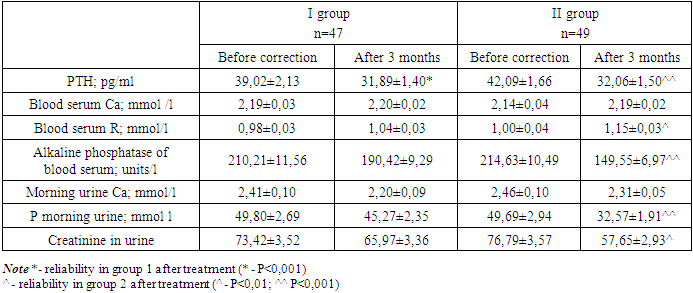
- The use of cholecalciferol, depending on body weight, for 3 months leads to normalization of the level of 25 (OH)D up to 73.5% of cases, increased bone mineral density (P<0.0001) and normalization of PTH levels (p<0.001). The developed method of differentiated correction of vitamin D deficiency and deficiency in obese school-age children can be recommended for practical use in medical institutions.
References
| [1] | Dedov I.I. et al. Vitamin D deficiency in adults: diagnosis, treatment and prevention. /Dedov I.I., Melnichenko G.A., Pigarova E.A., Dzeranova L.K., Rozhinskaya L.Ya., Troshina E.A. Textbook: Clinical recommendations of the Russian Association of Endocrinologists. – M.–Tver: LLC Publishing House "Triada", 2020. – 48 p. |
| [2] | Kaladze N.N. Indicators of bone metabolism and fat metabolism in overweight children / N.N. Kaladze, N.N. Skoromnaya // TMBV. - 2016. - No.1. - pp. 45-50. |
| [3] | Sharipova O.A. et al. Osteopenic syndrome in children with chronic lung diseases. Monograph. Samarkand 2021. 144 pages. |
| [4] | Shamansurova, E., Isakhanova, N. The status of vitamin D in recurrent respiratory diseases in children. // Journal bulletin of the doctor, 2018. - 1(4), 84-87. |
| [5] | Zakharova, I.N. Provision of vitamin D and correction of its deficiency in young children in the Russian Federation / I.N. Zakharova // Practical medicine. - 2017. – No. 106. – Vol. 5. – pp. 22-28. 6. Obesity and overweight. Newsletter.: website. - October, 2017. – URL: http://www.who.int/mediacentre/factsheets/fs311/ru/. |
| [6] | Looker AC., Johnson CL., Lachner DA., Pfeiffer CM., Schleicher RL., Sempos CT. Vitamin D status: United States, 2001-2006. NCHS Data Brief. 2011; 56. |
| [7] | Malyavskaya S.I. Components of metabolic syndrome in children and adolescents with different levels of vitamin D: results of a single-stage study // Issues of modern pediatrics. – 2017 - No.3 (volume 16). - pp. 213-219. |
| [8] | Shapses S.A. Obesity is a concern for bone health with aging / S.A. Shapses, L.C. Pop, Y. Wang // Nutrition Research. - 2017. – Vol.39. – P. 1-13. |
| [9] | Association between serum osteocalcin and body mass index: a systematic review and meta-analysis / H. Kord-Varkaneh, K. Djafarian, M. Khorshidi, S. Shab-Bidar // Endocrine. – 2017. – Vol.58. – P. 24–32. |
| [10] | Obesity, osteoporosis and bone metabolism / K. Gkastaris, D.G. Goulis, M. Potoupnis [et al.] // J Musculoskelet Neuronal Interact. – 2020. – Vol.20. - №3. – P. 372–381. |