-
Paper Information
- Next Paper
- Previous Paper
- Paper Submission
-
Journal Information
- About This Journal
- Editorial Board
- Current Issue
- Archive
- Author Guidelines
- Contact Us
American Journal of Medicine and Medical Sciences
p-ISSN: 2165-901X e-ISSN: 2165-9036
2024; 14(8): 2093-2098
doi:10.5923/j.ajmms.20241408.31
Received: Aug. 8, 2024; Accepted: Aug. 25, 2024; Published: Aug. 27, 2024

Coagulogram Indicators in Patients with Type 2 Diabetes with Macrovascular Complications
 Abstract
 Reference
 Full-Text PDF
 Full-text HTML
Shagazatova Barno Khabibullaevna1, Bakhadirov Said Komilovich2, Mamasodikov Bakhtiyor Rustam Ugli3
1MD, DSc, Professor, Tashkent Medical Academy, Tashkent, Uzbekistan
2Independent Researcher, Tashkent Medical Academy, Tashkent, Uzbekistan
3Student, Central Asian University, Tashkent, Uzbekistan
Copyright © 2024 The Author(s). Published by Scientific & Academic Publishing.
This work is licensed under the Creative Commons Attribution International License (CC BY).
http://creativecommons.org/licenses/by/4.0/

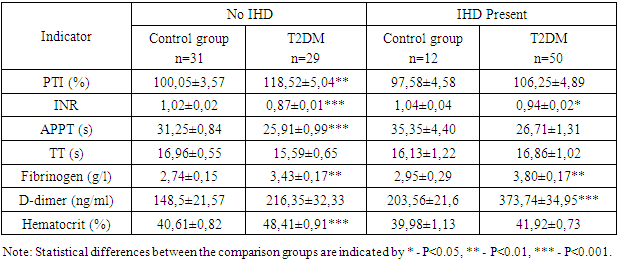
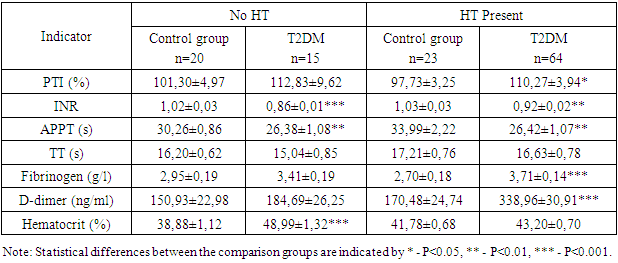
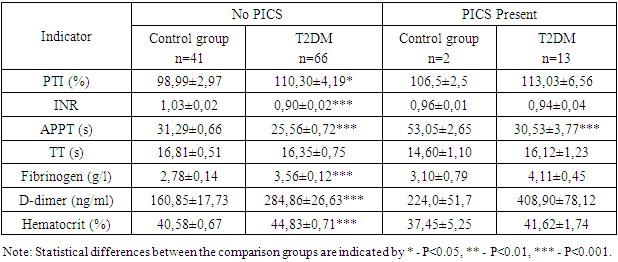
This study focuses on analyzing the coagulogram indicators in patients with type 2 diabetes mellitus (T2DM) with macrovascular complications, such as ischemic heart disease (IHD), hypertension (HTN), and post MI cardiosclerosis (PICS). A total of 122 patients were examined, including 79 patients with T2DM and 43 individuals in the control group. Significant differences in coagulation parameters were found between the groups. Patients with T2DM and IHD showed a significant increase in fibrinogen and D-dimer levels compared to the control group. Similar results were observed in patients with T2DM and HTN, as well as in patients with T2DM and PICS. The importance of these findings underscores the necessity for more careful monitoring of coagulation parameters in patients with T2DM to prevent thrombotic complications and improve their prognosis.
Keywords: Type 2 diabetes mellitus, Coagulogram, Macrovascular complications, Ischemic heart disease, Hypertension, Post MI cardiosclerosis, Fibrinogen, D-dimer
Cite this paper: Shagazatova Barno Khabibullaevna, Bakhadirov Said Komilovich, Mamasodikov Bakhtiyor Rustam Ugli, Coagulogram Indicators in Patients with Type 2 Diabetes with Macrovascular Complications, American Journal of Medicine and Medical Sciences, Vol. 14 No. 8, 2024, pp. 2093-2098. doi: 10.5923/j.ajmms.20241408.31.
1. Introduction
- Type 2 diabetes mellitus (T2DM) is one of the most prevalent chronic diseases, characterized by impaired carbohydrate metabolism and elevated blood glucose levels [9]. One of the most serious complications of T2DM includes macrovascular diseases such as ischemic heart disease (IHD), hypertension (HTN), and postinfarction cardiosclerosis (PICS), which are pathogenetically driven atherosclerotic conditions [13]. These complications significantly increase the risk of cardiovascular events and mortality among diabetic patients [15]. Thus, there is a substantial correlation between T2DM and the development of macrovascular complications, as evidenced by numerous studies. For example, patients with T2DM often suffer from complications such as ischemic heart disease and hypertension, which in turn increase the risk of cardiovascular events [8]. Research has also shown that the level of glycemic control and management of hypertension play a crucial role in the prevention and reduction of these complications [19]. To enhance the effectiveness of treatment and prevention of macrovascular complications in T2DM patients, it is recommended to regularly monitor and control major risk factors such as hypertension, glycemic levels, lipid profile, and lifestyle [3].A coagulogram is a set of laboratory tests used to assess the blood coagulation system, which is particularly important for patients at increased risk of thrombosis. It is known that patients with T2DM often exhibit alterations in coagulation parameters, which can exacerbate the course of macrovascular diseases and contribute to the development of thromboembolic complications [1]. Rheological disturbances are one component of macrovascular complications, with the coagulation process being key in this context. Studies, such as those by Madan et al. (2010), have shown significant differences in coagulation parameters between patients with macrovascular complications and control groups, thereby providing better insights into the pathophysiological mechanisms of thrombosis in this patient category and enabling the development of more effective monitoring and treatment strategies [12]. Thus, patients with T2DM often exhibit changes in coagulation parameters, which can exacerbate the course of macrovascular diseases and contribute to the development of thromboembolic complications [5]. Rheological disturbances are one component of macrovascular complications, with the coagulation process being key in this context [16]. Studies have shown significant differences in coagulation parameters between patients with macrovascular complications and control groups, thereby providing better insights into the pathophysiological mechanisms of thrombosis in this patient category and enabling the development of more effective monitoring and treatment strategies [21].The aim of this study is to investigate the coagulogram indicators in patients with T2DM complicated by macrovascular diseases such as IHD, HTN, and PICS.
2. Materials and Methods
- This study examined 122 patients, of whom 79 had T2DM and 43 comprised the control group. Patients with T2DM were divided into groups based on the presence of macrovascular complications such as IHD, HTN, and PICS.The control group included 43 patients, of whom 31 had no IHD, 12 had IHD, 20 had no HTN, 23 had HTN, 41 had no PICS, and 2 had PICS. The age of the patients ranged from 40 to 70 years.All patients underwent a comprehensive examination, including physical examination, instrumental, and laboratory diagnostics. To establish a diagnosis, all patients were examined by a cardiologist. The average duration of T2DM was 7.7±0.59 years. To achieve glycemic control, patients received medications from the sulfonylurea group (glibenclamide, gliclazide), biguanides (metformin), and insulin.Inclusion criteria for the study were a confirmed diagnosis of T2DM and the absence of exacerbation of comorbidities. Exclusion criteria included patients with a history of thromboembolism, hereditary coagulopathies, pregnant women, patients who had recently undergone surgery, patients with low hemoglobin levels, type 1 diabetes, acute complications of diabetes, liver or end-stage renal failure, thyroid dysfunction, as well as those with severe somatic and infectious diseases in the stage of decompensation of the pathological process or acute coronary syndrome.Standard laboratory methods were used to measure coagulogram indicators. Statistical analysis of the data was performed using the IBM® SPSS Statistics 25.0 software package. Data distribution normality was checked using the Kolmogorov-Smirnov test. Fisher's exact test, Student's t-test, and Mann-Whitney U test were used for comparative analysis of the frequencies of various indicators, depending on the normality of the distribution. Qualitative indicators were processed using Pearson's chi-square test. Differences were considered statistically significant at a significance level of p<0.05.
3. Results and Discussion
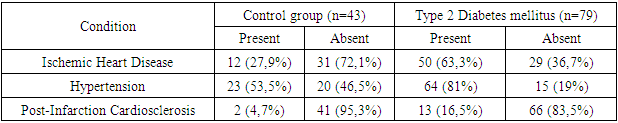
- The number of patients examined totaled 122, who were either hospitalized or treated on an outpatient basis at the "Akfa Medline University Hospital" from 2022 to 2024. Among them, 79 patients had type 2 diabetes mellitus (T2DM), and 43 individuals comprised the control group.Patients were divided into groups based on the presence of type 2 diabetes mellitus, as well as the presence of ischemic heart disease, hypertension, and postinfarction cardiosclerosis. In the context of diabetes, these conditions are referred to as macrovascular complications, due to the presence of additional risk factors that exacerbate the atherosclerotic process.Comparative characteristics of macrovascular complications in patients with type 2 diabetes mellitus (T2DM) and the control group are presented in Table 1. Significant differences in the percentage of diseases between the groups are noteworthy. Among patients with T2DM who have ischemic heart disease (IHD), 63.3% have macrovascular complications, whereas in the control group, this value is 27.9%. Hypertension (HT) is observed in 81% of patients with diabetes, compared to 53.5% in the control group, indicating a significantly increased risk of hypertension among diabetics. Post-infarction cardiosclerosis (PICS) is also more common among patients with T2DM: 16.5% versus 4.7% in the control group. The level of statistical significance (P<0.05) indicates substantial differences in the prevalence of IHD between the groups.
|
|
|
4. Conclusions
- The obtained results indicate a significant impact of the presence of ischemic heart disease (IHD), hypertension (HT), and postinfarction cardiosclerosis (PICS) on the coagulation profile in patients with type 2 diabetes mellitus (T2DM). Patients with IHD, HT, and PICS exhibit significant changes in coagulation and inflammatory markers, suggesting an increased risk of thrombosis, thromboembolism, and cardiovascular complications. These data emphasize the need for systematic monitoring of coagulation indicators for more effective patient management and prevention of serious complications. Special attention should be given to patients with concomitant hypertension and a history of myocardial infarction, as they are at a higher risk of thrombosis and require more careful monitoring and treatment adjustments. Monitoring the coagulation profile in patients with T2DM is crucial for the timely detection and prevention of thrombotic complications.
References
| [1] | Agarwal, C., Bansal, K., Pujani, M., Singh, K., Chauhan, V., Rana, D., & Lukhmana, S. (2018). Association of coagulation profile with microvascular complications and glycemic control in type 2 diabetes mellitus – a study at a tertiary care center in Delhi. Hematology, Transfusion and Cell Therapy, 41, 31-36. |
| [2] | Arnold, S., Khunti, K., Tang, F., Chen, H., Cid-Ruzafa, J., Cooper, A., Fenici, P., Gomes, M., Hammar, N., Ji, L., Saraiva, G., Medina, J., Nicolucci, A., Ramirez, L., Rathmann, W., Shestakova, M., Shimomura, I., Surmont, F., Vora, J., Watada, H., Kosiborod, M., & Investigators, O. (2021). Incidence Rates and Predictors of Microvascular and Macrovascular Complications in Patients with Type 2 Diabetes: Results from the Longitudinal Global DISCOVER Study. American heart journal. |
| [3] | Asakawa, H., Tokunaga, K., & Kawakami, F. (2000). Comparison of risk factors of macrovascular complications. Peripheral vascular disease, cerebral vascular disease, and coronary heart disease in Japanese type 2 diabetes mellitus patients. Journal of diabetes and its complications, 14 6, 307-13. |
| [4] | Ebrahim, H., Asrie, F., & Getaneh, Z. (2021). Basic Coagulation Profiles and Platelet Parameters Among Adult Type 1 and Type 2 Diabetes Patients at Dessie Referral Hospital, Northeast Ethiopia: Comparative Cross-Sectional Study. Journal of Blood Medicine, 12, 33-42. |
| [5] | Erem, C., Hacihasanoğlu, A., Çelik, Ș., Ovalı, E., Ersöz, H., Ukinç, K., Değer, O., & Telatar, M. (2004). Coagulation and Fibrinolysis Parameters in Type 2 Diabetic Patients with and without Diabetic Vascular Complications. Medical Principles and Practice, 14, 22 - 30. |
| [6] | Feuring, M., Wehling, M., Burkhardt, H., & Schultz, A. (2010). Coagulation status in coronary artery disease patients with type II diabetes mellitus compared with non-diabetic coronary artery disease patients using the PFA-100® and ROTEM®. Platelets, 21, 616 - 622. |
| [7] | Gedebjerg, A., Almdal, T., Berencsi, K., Rungby, J., Nielsen, J., Witte, D., Friborg, S., Brandslund, I., Vaag, A., Beck-Nielsen, H., Sørensen, H., & Thomsen, R. (2018). Prevalence of micro- and macrovascular diabetes complications at time of type 2 diabetes diagnosis and associated clinical characteristics: A cross-sectional baseline study of 6958 patients in the Danish DD2 cohort. Journal of diabetes and its complications, 32 1, 34-40. |
| [8] | Islam, I., Hoque, S., Khatun, R., Ali, Z., Islam, S., Islam, N., & Afrin, Z. (2017). Prevalence of Macrovascular Complications and Their Associated Risk Factors Among Type 2 Diabetic Patients Attending In A Tertiary Level Hospital. KYAMC Journal, 7, 662-667. |
| [9] | Khuwaja., A., Rafique, G., White, F., & Si, A. (2004). Macrovascular complications and their associated factors among persons with type 2 diabetes in Karachi, Pakistan--a multi-center study.. JPMA. The Journal of the Pakistan Medical Association, 54 2, 60-6. |
| [10] | Koteliukh, M. (2022). PECULIARITIES OF THE POST-INFARCTION PERIOD CLINICAL COURSE IN PATIENTS WITH DIABETES MELLITUS TYPE II AFTER PERCUTANEOUS CORONARY INTERVENTION. Clinical and experimental pathology. |
| [11] | Li, Z., Qi, C., Jia, Z., Zhen, R., Ren, L., Jia, Y., & Chen, S. (2022). The Correlation Between Estimated Glucose Disposal Rate and Coagulation Indexes in Type 2 Diabetes Mellitus. Diabetes, Metabolic Syndrome and Obesity: Targets and Therapy, 15, 2643 - 2652. |
| [12] | Madan, R., Gupt, B., Saluja, S., Kansra, U., Tripathi, B., & Guliani, B. (2010). Coagulation profile in diabetes and its association with diabetic microvascular complications. The Journal of the Association of Physicians of India, 58, 481-4. |
| [13] | Morrish, N., Stevens, L., Fuller, J., Jarrett, R., & Keen, H. (1991). Risk factors for macrovascular disease in diabetes mellitus: the London follow-up to the WHO Multinational Study of Vascular Disease in Diabetics. Diabetologia, 34, 590-594. |
| [14] | Nazimek-Siewniak, B., Moczulski, D., & Grzeszczak, W. (2002). Risk of macrovascular and microvascular complications in Type 2 diabetes: results of longitudinal study design. Journal of diabetes and its complications, 16 4, 271-6. |
| [15] | Paisey, R., Arredondo, G., Villalobos, A., Lozano, O., Guevara, L., & Kelly, S. (1984). Association of Differing Dietary, Metabolic, and Clinical Risk Factors with Macrovascular Complications of Diabetes: A Prevalence Study of 503 Mexican Type II Diabetic Subjects. I. Diabetes Care, 7, 421-427. |
| [16] | Pan, L., Ye, Y., Wo, M., Bao, D., Zhu, F., Cheng, M., Ni, X., & Fei, X. (2018). Clinical Significance of Hemostatic Parameters in the Prediction for Type 2 Diabetes Mellitus and Diabetic Nephropathy. Disease Markers, 2018. |
| [17] | Sherin, B., Ramamurthy, B., Sudalaimuthu, M., & Ganapathy, S. (2020). Comparison of Coagulation Profile in Type 2 Diabetic Patients with Good Glycaemic Control and Poor Glycaemic Control. Journal of Clinical and Diagnostic Research. |
| [18] | Tanaka, S., Tanaka, S., Iimuro, S., Yamashita, H., Katayamá, S., Akanuma, Y., Yamada, N., Araki, A., Ito, H., Sone, H., & Ohashi, Y. (2013). Predicting Macro- and Microvascular Complications in Type 2 Diabetes. Diabetes Care, 36, 1193 - 1199. |
| [19] | Wolffenbuttel, B., & Heine, R. (1999). [Glycemic regulation and management of essential hypertension in diabetics with type 2 diabetes mellitus; the 'United Kingdom prospective diabetes study' of diabetic complications]. Nederlands tijdschrift voor geneeskunde, 143 23, 1197-201. |
| [20] | Wu, S., Yuan, H., Zhou, Y., Long, Z., Peng, Y., & Peng, F. (2020). [Thromboelastography-based assessment of coagulation function in patients with chronic kidney disease and the risk factors of hypercoagulability]. Nan fang yi ke da xue xue bao = Journal of Southern Medical University, 40 4, 556-561. |
| [21] | Yamada, T., Sato, A., Nishimori, T., Mitsuhashi, T., Terao, A., Sagai, H., Komatsu, M., Aizawa, T., & Hashizume, K. (2000). Importance of hypercoagulability over hyperglycemia for vascular complication in type 2 diabetes. Diabetes research and clinical practice, 49 1, 23-31. |
| [22] | Zhao, H., Zhang, L., Liu, L., Li, C., Song, W., Pang, Y., Zhang, Y., & Li, D. (2021). Blood Levels of Glycated Hemoglobin, D-Dimer, and Fibrinogen in Diabetic Retinopathy. Diabetes, Metabolic Syndrome and Obesity: Targets and Therapy, 14, 2483-2488. |