Mamatkhujaeva Gulkhayo Azizbek Kizi1, Arziqulov Abduraim Shamsiyevich2
1Andijan State Medical Institute, Andijan, Uzbekistan
2DSc, Professor, Andijan State Medical Institute, Andijan, Uzbekistan
Correspondence to: Mamatkhujaeva Gulkhayo Azizbek Kizi, Andijan State Medical Institute, Andijan, Uzbekistan.
| Email: |  |
Copyright © 2024 The Author(s). Published by Scientific & Academic Publishing.
This work is licensed under the Creative Commons Attribution International License (CC BY).
http://creativecommons.org/licenses/by/4.0/

Abstract
The use of BMI to diagnose overweight and obesity is justified by the high correlation of its value with total body fat, morbidity and mortality. Purpose of the study: to study the characteristics of the physical development of children in the Andizhan region of the Republic of Uzbekistan depending on body mass index. Materials and methods of research: Anthropometric, anamnestic, clinical-epidemiological, laboratory, instrumental, biochemical and statistical data were used in the work. As part of an epidemiological study to assess the incidence of overweight/obesity in children, 2800 children were examined. Inclusion criteria at the first stage were: age from 10 to 17 years, attending school on the day of the study and the absence of acute illness with fever. Children were examined using a developed standard questionnaire that included personal data (gender, age), physical development parameters (body weight, waist size, abdominal, hip, neck and arm circumferences), determination of blood pressure, and BMI. Results and discussion: The distribution of children by BMI percentile showed that 1468 (52.99%) children had indicators below the 50th percentile, the remaining 855 (47.01%) children had a BMI exceeding 50, of which 252 children (9.09%) have a BMI between the 75th and 85th percentile. All children we examined were distributed according to BMI as follows: with BMI within normal limits - 2196 children (79.3% of cases), children with BMI violations - 574 (20.7% of cases), with low body weight 124 children (4.5% of cases), overweight/obesity – 450 children (16.2% of cases). Conclusions: every fifth child was diagnosed with body weight disorders, and the number of children with overweight and obesity exceeded the number of children with underweight, which indicates a larger proportion of children with excessive malnutrition.
Keywords:
Children and adolescents, Physical development, Body mass index, Overweight, Obesity
Cite this paper: Mamatkhujaeva Gulkhayo Azizbek Kizi, Arziqulov Abduraim Shamsiyevich, Epidemiological Features of Physical Development of Children in Andijan Region of the Republic of Uzbekistan Depending on Body Mass Index, American Journal of Medicine and Medical Sciences, Vol. 14 No. 8, 2024, pp. 2064-2069. doi: 10.5923/j.ajmms.20241408.25.
1. Introduction
Diagnosis of overweight and obesity is carried out primarily by clinical methods and is based on anthropometric measurements. Currently, the generally accepted criterion for identifying overweight and obesity in children and adults is the body mass index (BMI) or Quetelet index. BMI is an anthropometric index that is the ratio of body weight (in kilograms) to the square of height (in meters). The use of BMI to diagnose obesity is justified by the high correlation of its value with total body fat, morbidity and mortality. It has been established that girls and boys with excess body weight have a higher risk of developing diseases associated with obesity than their peers with normal body weight [1,2,3, 4,10,11,12,13]. Adults who had a childhood BMI value greater than the 75th percentile are more likely to suffer from coronary heart disease than those whose childhood BMI was between the 25th and 49th percentile [5,6,7,9]. The same study found that underweight children also had an increased risk of this disease in adulthood [8], compared with peers with normal BMI values. Unlike adults, whose BMI values are constant, in children the interpretation of BMI values has its own characteristics [7,8,14,15]. This is due to growth processes, physiological and sexual characteristics of their development. Therefore, BMI values that take into account age and sex are used to diagnose nutritional status in children [15]. Purpose of the study:To study the characteristics of the physical development of children in the Andijan region of the Republic of Uzbekistan depending on body mass index.
2. Material and Research Methods
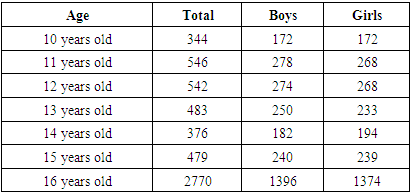
To achieve the goal, a two-stage study was conducted. The first stage - epidemiological, was carried out in secondary schools in Andijan, the second stage - case-control at the Department of Pediatrics of the Andijan State Medical Institute and the Andijan branch of the Institute of Human Immunology and Genomics of the Academy of Sciences of the Republic of Uzbekistan. At the first stage, as part of an epidemiological study to assess the incidence of overweight/obesity in children, 2800 children were examined. The children included in the study were selected from among high school students in secondary schools in the city of Andijan and the Andijan region of the Fergana Valley of the Republic of Uzbekistan. Inclusion criteria at the first stage were: age from 10 to 17 years, attending school on the day of the study and the absence of acute illness with fever. The examination was carried out as part of the annual school health examination in schools in collaboration with the school doctor and nurse. Children were examined using a developed standard questionnaire that included personal data (gender, age), physical development parameters (body weight, waist size, abdominal, hip, neck and arm circumferences), determination of blood pressure, and BMI. Using inclusion/exclusion criteria, 246 children were selected from the total number of children examined to form the sample for the second stage of the study and they also formed the main study group. The criteria for inclusion in the main group of the study were the following: 1) children aged 10 years to 16 years 11 months 29 days;2) the child’s presence at school on the day of the study; 3) lack of diagnosis with corresponding clinical manifestations and a confirmed diagnosis of secondary obesity due to endocrine, neurological and genetic diseases;4) consent of the parents or legal guardian of the patient and schoolchildren (over 14 years old) participating in the study; 5) absence of acute illness on the day of examination. The exclusion criteria were the following: 1) the child’s absence from school on the day of the study; 2) a confirmed diagnosis of secondary obesity due to endocrine, genetic, neurological diseases, with corresponding clinical manifestations; 3) acute illness in a child with an increase in body temperature during the days of the study; 4) refusal of parents and/or students to participate in the study. Control children were recruited as part of an epidemiological study and randomly selected based on rosters and informed parental consent. Children and adolescents from the control group had normal weight (BMI between the 5th and 85th percentiles for age and gender) and were comparable in age and gender to the main group. Participation in the studies was voluntary, based on informed consent signed by parents or guardians and children over 14 years of age. Informed consent was signed after parents and participating children were informed about the purpose, methods, techniques used in the study, rights of participants, confidentiality of personal data, risks, etc. The study was approved by the Research Ethics Committee of the Andijan State Medical Institute (protocol No. 16 of 10/04/2022). The work used anamnestic, clinical-epidemiological, laboratory, instrumental, biochemical and statistical data. Of the studied group of children, there were 1396 (50.4%) boys and 1374 (49.6%) girls. The ages of the children studied covered a period of 10-15 years, 11 months and 29 days, with an average age of 12.5 years ± 1.64 years, with no statistical differences between the sexes (Table 1). 2131 children (76.9%) had an urban environment and 639 (23.1%) had a rural environment.Table 1. Distribution of children by age and gender
 |
| |
|
The distribution of the examined children was carried out according to BMI into 4 subgroups: I – children with underweight (with BMI less than 5% by age and gender), II – children with normal weight (with BMI located between the 5th and 85th percentile), III – children with overweight body weight (BMI between 85 and 95 percentile), IV – obese children (BMI more than 95 percent). Methods for statistical evaluation of the results obtained Statistical analyzes were performed using IBM SPSS Statistics for Windows. version 20 and Microsoft Excel 2017. Revealed statistical differences in the frequency of qualitative and quantitative variables (nominal, ordinal - X2 criterion). For a smaller sample, Fisher's Exact Test was used, which is more suitable for a small number of observations. Identify statistical differences in mean values, Student's t-test was used; in cases where a comparison of 3 or more values was required, a one-way analysis of variants (ANOVA) was carried out, with the calculation of F-statistics. To determine risk factors, relative risk (RR), confidence interval (CI), etc. were calculated based on the “2x2 Contingency Table”. To assess the role of the studied risk factors, the method of logistic regression of the risk of developing the disease was used, which made it possible to develop a statistical model of the probability of excess body weight based on existing risk factors.
3. Results and Discussion
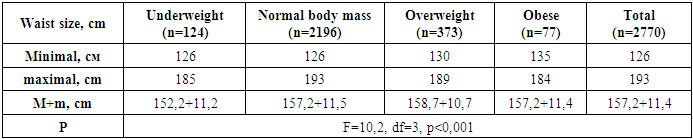
Waist values ranged from 126 to 193 cm (group average 157.2±11.4 cm). Boys had higher mean waist values (158.3±13.0 cm) compared to girls (156.0±9.4 cm) (df=1, F=28.04, p<0.001). Children with underweight had smaller waist sizes compared to other children (F=10.2, df=3, p<0.001) (Table 2). Table 2. Distribution of children by waist size and BMI
 |
| |
|
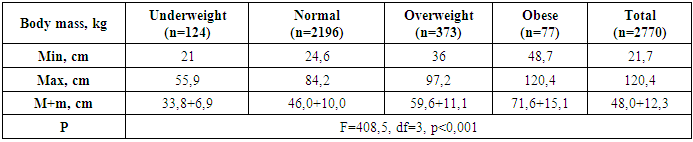
The jump in puberty in girls was observed at 10-11 years old, in boys - at 13 years old, thus, girls at 10-12 years old were taller than boys. Waist size deviations were detected in 164 children (5.9% of cases), 76 children (2.7% of cases) had smaller sizes, and 88 children (3.2% of cases) had larger sizes. In both groups, boys predominated (in the group with small waist sizes there were 47 boys (3.4%) and 29 girls (2.1%), in the group with large waist sizes there were 50 boys (3.6%) and 38 girls (2.8%), without significant statistical differences. Body weight values ranged from 21.7 to 120.4 kg (with average values of 48.0±12.3 kg). Statistically significant differences in average body weight values were revealed between children of all groups (F=408.5, df=3, p<0.001) (Table 3). Table 3. Distribution of children by body weight (kg) and BMI
 |
| |
|
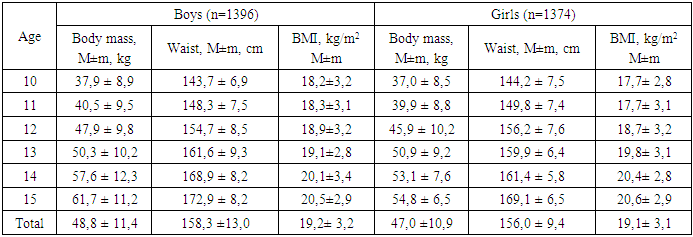
Average body weight values in boys (48.8±11.4 kg) were also higher compared to girls (47.1±10.9 kg) (df=1, F=14.17, p<0.001). After evaluating the data, we found that 260 children (9.4% of cases) had abnormal body weight. Children with higher percentage values predominated 97 (225 children or 8.1% of cases), of which boys predominated: 152 boys and 73 girls, respectively. Values less than 3% were found in 35 children (1.3% of cases), with a slight predominance of girls (20 and 15, respectively). Determination of body weight and waist size allowed the calculation of body mass index (BMI). The average BMI values for boys were 19.2±3.2 kg/m2 (18.2±3.2 kg/m2 - 20.5±2.9 kg/m2), and for girls -19.1±3.1 kg/m2 (17.7±2.8 kg/m2 - 20.6±2.9 kg/m2), without significant statistical differences (p>0.05). The distribution of children by body weight, waist size and BMI is shown in the table 4. Table 4. Distribution of children by weight, height and BMI by sex and age
 |
| |
|
Although in general the average BMI values for girls and boys do not differ significantly, boys under 12 years of age have higher BMI values than girls. But after the sexual leap during puberty, in boys aged 13-15 years, along with an increase in the waist, a decrease in BMI was noted. Thus, BMI values in girls are higher than in boys aged 13-15 years and level off after 15 years. (figure 1).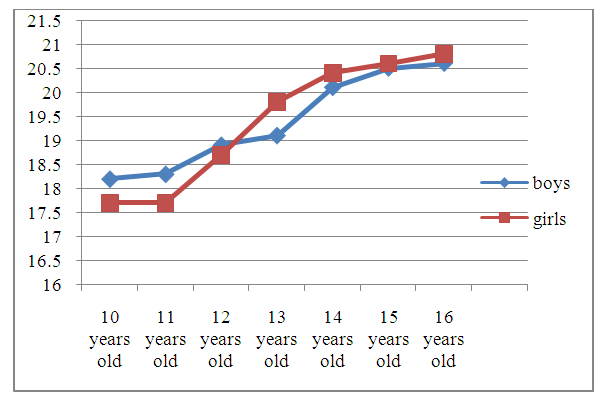 | Figure 1. Distribution of children by average BMI values by age and gender |
The distribution of children by BMI percentile showed that 1468 (52.99%) children have indicators below the 50th percentile, the remaining 855 (47.01%) children have a BMI exceeding 50, of which 252 children (9.09%) have a BMI of 75 to 85 percentile (Table 5).Table 5. Distribution of children by BMI percentiles
 |
| |
|
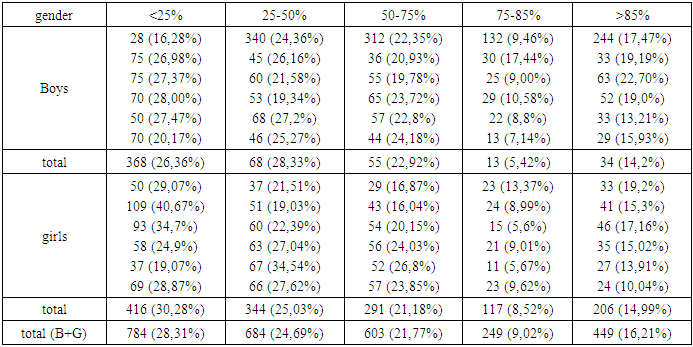
There are 120 girls (8.52%) and 132 boys (9.46%) with a BMI between the 75th and 85th percentiles by age and gender, (Figure 2). It should be noted that the higher frequency of such children aged 10 years (13.37% of girls and 17.44% of all 10-year-old boys) coincides with the number of overweight children.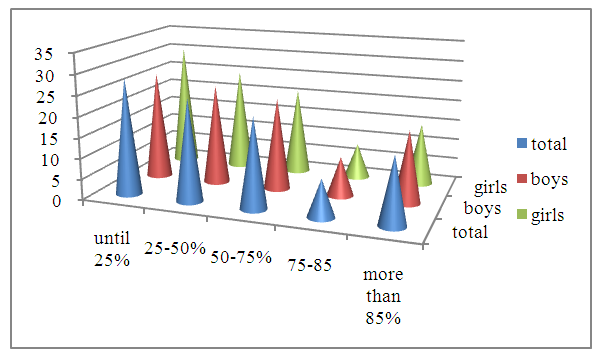 | Figure 2. Distribution of children by BMI percentile depending on gender |
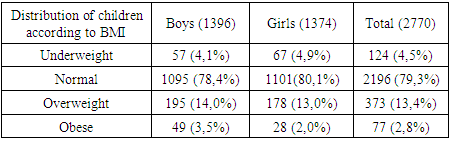
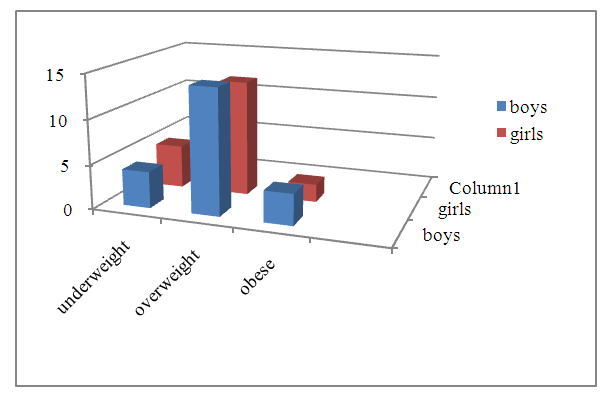
According to the literature, BMI above the 75th percentile at any age is an indicator of the risk of developing overweight [1,2]. This fact justifies increased clinical attention to initiating preventive measures to reduce or control children's weight gain. Thus, all the children we examined according to BMI were distributed as follows: with a BMI within the normal range - 2196 children (79.3% of cases), children with BMI violations - 574 (20.7% of cases), with low body weight 124 children (4.5% of cases), overweight/obesity – 450 children (16.2% of cases). Thus, every fifth child was diagnosed with body weight disorders, and the number of children with overweight and obesity exceeded the number of children with underweight, which indicates a larger proportion of children with excessive malnutrition (Figure 3). | Figure 3. Distribution of children by BMI |
There were 77 obese children (2.8% of cases), with a predominance of boys (49 versus 28) (Figure 4). The prevalence of overweight (13.4%) was also higher in boys (195 (14%) and girls 178 (12.9%) with a BMI greater than the 85th percentile), without significant differences (Table 6). It can be assumed that sex differences do not play a major role in explaining overweight and obesity in children. Literature data are contradictory for different countries and population groups [9,10,14]. Table 6. Distribution of children by BMI and gender
 |
| |
|
 | Figure 4. Distribution of children with BMI disorders by gender |
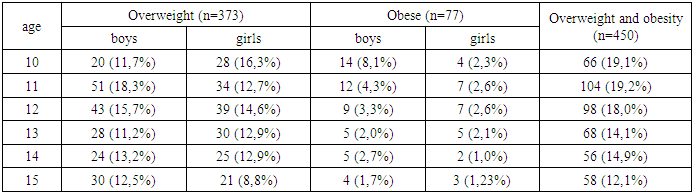
There is a decrease in the number of children with overweight/obesity depending on age; from 19.1% at 10 years old to 12.1% at 15 years old and the maximum number of overweight children in both sexes at the age of 10-12 years (Table 7). Table 7. Distribution of children with overweight and obesity by age and gender
 |
| |
|
The distribution of overweight/obese children by age and gender is shown in Figure 5, from which it follows that from 10 to 12 years old the number of boys is overweight and at 14-15 years old there is a predominance of boys. The predominance of girls at 13 years of age and a significant decrease in the number of boys with excess body weight in this age section (13.2% of boys and 15.0% of girls) can be explained by the pubertal jump in girls, and in boys with an enlarged waist. Similarly, previous research shows that, at a very young age (before 10 years), girls are more likely to be diagnosed as overweight/obese than boys, but this relationship reverses during puberty.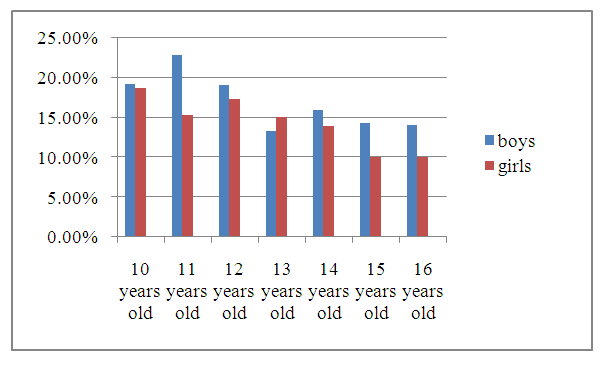 | Figure 5. Distribution of children with overweight and obesity by age and gender |
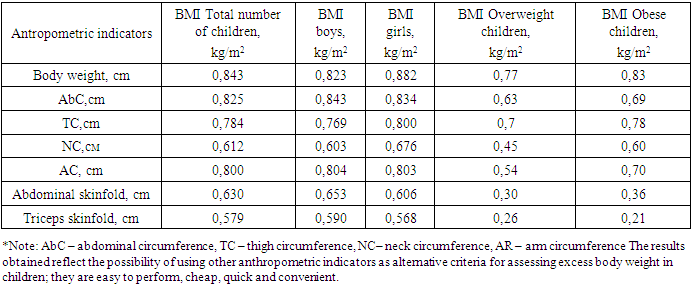
To establish the existence of a correlation between BMI and other anthropometric parameters, we calculated the Pearson linear correlation coefficient. The results indicate that there is a significant correlation between BMI and body weight (r=0.843), abdominal circumference (r=0.825), hip circumference (r=0.784), arm circumference (r=0.800); moderate correlation between BMI and OR (r=0.612), skin folds on the abdomen (r=0.630) and triceps (r=0.579), OB/T index (r=0.518). No statistical differences were found between the strength of correlation by gender (Table 8). Table 8. Correlations between BMI and anthropometric indicators depending on gender and type of malnutrition
 |
| |
|
4. Conclusions
In different countries, national maps have been developed for the diagnosis of overweight and obesity with a percentile distribution of BMI values depending on age and gender, according to which obesity is diagnosed at a BMI equal to or above the 95th percentile, and overweight - at a BMI from 85 to 95 percentile. Since 2007, many countries of the world, including developed ones - Canada, Switzerland and some other countries in the European region - have adopted WHO anthropometric criteria [9,10,14]. However, ESPGHAN recommends that the height guide for children aged 5–19 years be used only after approval by national health authorities, due to significant population differences in growth rates for children aged 5–19 years [8,9].In connection with the above, our developed and recommended reference values for physical development in children and adolescents are necessary for a more accurate assessment of overweight and diagnosis of obesity in children, depending on the characteristics of the studied population in Andijan region of the Republic of Uzbekistan.
References
| [1] | Akhmedova D.I., Popenkov A.V. Factors and degree of risk of overweight and obesity in children 7 years old. //Eurasian Bulletin of Pediatrics. 2023; 3(18), 2-7. |
| [2] | Gritsinskaya, V.L. Early “jump in body weight” as a predictor of obesity in adolescents // Issues of pediatric dietology. - 2017. - T. 15. - No. 3. - P. 20-23. |
| [3] | Overweight and obesity. WHO fact sheet dated February 16, 2018 [electronic resource]: URL: https://www.who.int/ru/news-room/fact-sheets/detail/obesity-and-overweight. |
| [4] | Obesity and overweight. //WHO Bulletin. June 9, 2021 [Obesity and overweight. Fact sheet. (In Russ).] |
| [5] | Khodzhieva M.V., Skvortsova V.A., Borovik T.E., Namazova-Baranova L.S., Margieva T.V., Bushueva T.V., Melnichuk O.S., Nekrasova S.V. . // Assessment of the physical development of children of primary school age (7–10 years): results of a cohort study // Pediatric pharmacology.- 2016. -Volume 13.- No. 4 – P.363. |
| [6] | Rakhimov B. B. Prevalence of obesity among children and adolescents in Uzbekistan: metabolic disorders, interventions and healthy risks. Education news: research in the 21st century. 2023.2, 14, 368–372. |
| [7] | Recommendations for the diagnosis, treatment and prevention of obesity in children and adolescents. M.: Praktika, 2015. [Recommendations for the diagnosis, treatment and prevention of obesity in children and adolescents. M.: Praktika, 2015.] WHO Information Bulletin dated 06/09/2021 (https://www.who.int/ru/news-room/fact-sheets/detail/obesity-and-overweight). [WHO Newsletter of 06/09/2021 (https://www.who.int/ru/news-room/factsheets/detail/obesity-and-overweight)] |
| [8] | NCD Risk Factor Collaboration (NCD-RisC). Worldwide trends in body-mass index, underweight, overweight, and obesity from 1975 to 2016: a pooled analysis of 2416 population-based measurement studies in 128·9 million children, adolescents, and adults // Lancet. 2017; 390: 2627. |
| [9] | Latest WHO data on child obesity shows that southern European countries have Lechaschi Vrach, VOL. 25, № 3, 2022, https://journal.lvrach.ru/ 63 Pediatrician’s page the highest rate of childhood obesity/доклад Dr Joao Breda 25 ЕСО май 2018, Австрия). |
| [10] | Styne D. M., Arslanian S. A., Connor E. L., Farooqi I. S., Murad M. H., Silverstein J. H., Yanovski J. A. Pediatric Obesity—Assessment, Treatment, and Prevention: An Endocrine Society Clinical Practice Guideline // J Clin Endocrinol Metab. 2017; 102 (3): 709-757. |
| [11] | Shin S. M. Association of meat intake with overweight and obesity among school-aged children and adolescents // J Obes Metab Syndr. 2017; 26: 217-226. |
| [12] | Spinelli A, Buoncristiano M, Kovacs VA, et al. Prevalence of Severe Obesity among Primary School Children in 21 European Countries. Obes Facts. 2019; 12(2): 244-258. |
| [13] | Weihrauch-Blüher S, Wiegand S. Risk Factors and Implications of Childhood Obesity. Curr Obes Rep. 2018; 7(4): 254-259. |
| [14] | Zou Z, Yang Z, Yang Z, et al. Association of high birth weight with overweight and obesity in Chinese students aged 6-18 years: a national, cross-sectional study in China. // BMJ Open. 2019; 9(5): 524-532. |
| [15] | WHO. Obesity and overweight. https://www.who.int/news-room/fact-sheets/detail/obesity-and-overweight/. |

 Abstract
 Reference
 Full-Text PDF
 Full-text HTML