-
Paper Information
- Previous Paper
- Paper Submission
-
Journal Information
- About This Journal
- Editorial Board
- Current Issue
- Archive
- Author Guidelines
- Contact Us
American Journal of Medicine and Medical Sciences
p-ISSN: 2165-901X e-ISSN: 2165-9036
2024; 14(5): 1273-1277
doi:10.5923/j.ajmms.20241405.25
Received: Apr. 20, 2024; Accepted: May 9, 2024; Published: May 13, 2024

Utilization of Various Treatment Plans of Cholecalciferol Therapy in Overweight Children Experiencing Vitamin D Insufficiency and Deficiency
 Abstract
 Reference
 Full-Text PDF
 Full-text HTML
Maksuda Djamshedovna Ashurova
Department of Paediatrics, Faculty of Medicine, Samarkand State Medical University, Uzbekistan
Correspondence to: Maksuda Djamshedovna Ashurova, Department of Paediatrics, Faculty of Medicine, Samarkand State Medical University, Uzbekistan.
Copyright © 2024 The Author(s). Published by Scientific & Academic Publishing.
This work is licensed under the Creative Commons Attribution International License (CC BY).
http://creativecommons.org/licenses/by/4.0/

A study was conducted on a group of 96 children, aged 7 to 17 years, who were classified as obese. Additionally, 22 children with a normal body weight were included in the study. An individualized method of prescribing cholecalciferol aqueous solution based on BMI SDS was utilized. This approach demonstrated statistically significant improvements in normalizing abnormal vitamin D levels and positively impacted bone resorption processes. Additionally, it contributed to enhancing BMD indices as measured by radiological densitometry. The findings indicated that administering cholecalciferol based on body weight over a period of 3 months resulted in the normalization of 25(OH)D levels in 73.5% of cases, a rise in bone mineral density (P<0.0001), and the normalization of PTH levels (P<0.001).
Keywords: Vitamin D, Obesity, Overweight, Parathyroid hormone, Calcium, Phosphorus, Densitometry, Bone mineral density
Cite this paper: Maksuda Djamshedovna Ashurova, Utilization of Various Treatment Plans of Cholecalciferol Therapy in Overweight Children Experiencing Vitamin D Insufficiency and Deficiency, American Journal of Medicine and Medical Sciences, Vol. 14 No. 5, 2024, pp. 1273-1277. doi: 10.5923/j.ajmms.20241405.25.
Article Outline
1. Significance of the Issue
- Recent data indicate a correlation between obesity and vitamin D deficiency, as well as a similar correlation between obesity and insulin resistance. Vitamin D hurts insulin secretion, meaning that biologically active vitamin D metabolites can help prevent and treat obesity and diabetes [1,2]. Currently, there is a widespread occurrence of insufficient levels of 25(OH)D, and to a larger degree, a deficiency of 25(OH)D, which is impacting a significant portion of the overall population, including children and adolescents. Similar circumstances are evident in Uzbekistan, as substantiated by numerous research carried out within the nation. Vitamin D inadequacy is prevalent in all age groups, as is the case in many countries worldwide [3,4,5].Due to the urgent nature of the problem and the absence of specific guidelines on the appropriate dosage of vitamin D supplements based on body weight, an effort was made to develop a protocol for preventing and treating vitamin D deficiency in school-age children. This protocol involves the use of an aqueous solution of cholecalciferol, with the dosage adjusted according to the child's body weight. Objective: to devise effective algorithms for mitigating and averting vitamin D shortage and insufficiency in overweight children. The study was conducted in Family Polyclinics No. 1 and 2 in Samarkand city, as well as at the regional endocrinological dispensary. We conducted a study on a total of 96 children, ranging in age from 7 to 17 years, who had varying body weights and did not have any chronic diseases that could impact their phosphorus-calcium metabolism and bone health. The average age of the children in the study was 11.56±0.23 years. These children formed the overall group for analysis. The control group consisted of 22 youngsters who were in good health and did not have any musculoskeletal system disorders.Anthropometric tests were conducted utilizing conventional measuring instruments, such as a floor rostometer and medical scales. The anthropometric measurements consisted of height, body weight, waist circumference, and hip circumference. The data obtained was compared and the physical development was assessed using the WHO summary centile tables for height and weight distribution based on age and sex for children aged 5-19 [6]. The body mass index (BMI) was computed using the measurements. The results were assessed using standard deviation scores (SDS), by the standards of the World Health Organization (WHO). Obesity in children and adolescents should be classified as a Body Mass Index (BMI) that is 2.0 standard deviations (SDS) above the average, overweight as a BMI that is between 1.0 and 2.0 SDS above the average, and underweight as a BMI that is between -1.0 and -2.0 SDS below the average [6].The primary measures of mineral metabolism were examined using a singular investigation of the overall levels of calcium and phosphorus in the bloodstream. We analyzed the level of alkaline phosphatase (ALP) activity in blood serum as an indicator of bone formation using the spectrophotometric approach. To assess bone resorption, we measured the concentration of calcium in urine samples collected in the morning.The measurement of 25(OH)D was conducted using the chemiluminescent method with kits and calibrators provided by "Roche Diagnostics" firm (Germany) on the Abbott Architect 8000 analyzer (USA). The results were assessed following the guidelines provided by the European Society of Endocrinologists (2011) [7]. Vitamin D deficiency was defined as having a 25(OH)D level below 20 ng/ml (below 50 nmol/l). Vitamin D insufficiency was defined as having a 25(OH)D level between 20-29 ng/ml (51-75 nmol/l). Normal vitamin D levels were defined as having a 25(OH)D level between 30-100 ng/ml (76-250 nmol/l). Bone mineral density (BMD) was measured using dual-energy X-ray absorptiometry (DEXA) with the Osteos-Neo DEXXUM osteodensitometer and pediatric protocols. The bone mineral density of the lumbar spine (frontal projection, L1-L4) was evaluated in all children and adolescents who were examined.To accomplish the objective of the research and carry out a comparison analysis, all children in the primary group, who had varying body weights and Vitamin D levels (ranging from 21-30 ng/ml and less than 20 ng/ml, respectively), were randomly separated into two groups using a simple randomization procedure. Group I consisted of 47 children who had insufficient or deficient levels of vitamin D. These children had varying body weights, ranging from a BMI SDS of +1.0 to ≥+3.0. They were given a moderate dose of cholecalciferol, namely 2000 IU per day, for a duration of 3 months. After this initial period, the dosage was reduced to a preventive dose of 1000 IU per day. The initial 90-day therapy period involved administering a total of 180,000,000 international units (IU) to this particular set of children.Group II consisted of 49 children with varying body weights (ranging from a BMI SDS of +1.0 to ≥+3.0) and various levels of vitamin D. These children were given individualized dosages of cholecalciferol. Children with a body mass index (BMI) between +1.0 and +2.0 standard deviation scores (SDS) were given a daily dose of 2000 IU of vitamin D. Those with a BMI greater than +2 and less than +3 SDS received a daily dose of 3000 IU, while children with a BMI equal to or greater than +3 SDS were given a dose of 4000 IU per day for a period of 3 months. After this initial period, the dosage was reduced to a prophylactic dose of 1000 IU per day for another 3 months.The recommended therapeutic dosage of vitamin D for children with a BMI between +1.0 and +2.0 SDS is 180,000,000 IU. For children with a BMI greater than +2 and less than +3 SDS, the recommended dosage is 270,000,000 IU. Children with a BMI equal to or greater than +3 SDS should take 360,000,000 IU for a duration of 3 months. Vitamin D supplementation was administered alongside the treatment of overweight and obese children. The treatment included a low-calorie diet, increased physical activity, and metformin for children over 10 years old with obesity of 1-3 degrees and abnormalities in carbohydrate metabolism. The daily dosage of metformin was 500 mg/day for a duration of 2 months. The control group consisted of 22 children who had insufficient or deficient levels of vitamin D. They were given cholecalciferol at an average daily dosage of 2000 IU, as suggested by several research. An aqueous solution of vitamin D (cholecalciferol - 500 IU - in 1 drop) was utilized as a preparation. The acquired data was statistically processed using the Statistica 10 software on a personal computer. Parametric and nonparametric statistical methods were utilized to determine the arithmetic mean (M), mean square deviation (σ), standard error of the mean (m), and relative values (frequency, %). The statistical significance of the acquired measures was assessed using Student's t-test, which calculated the probability of error (P).
2. Findings of the Investigation
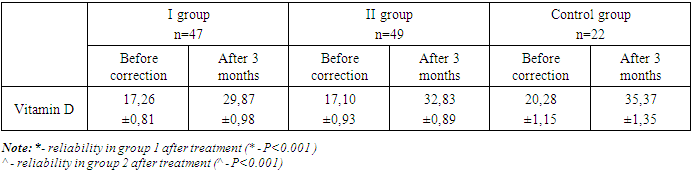
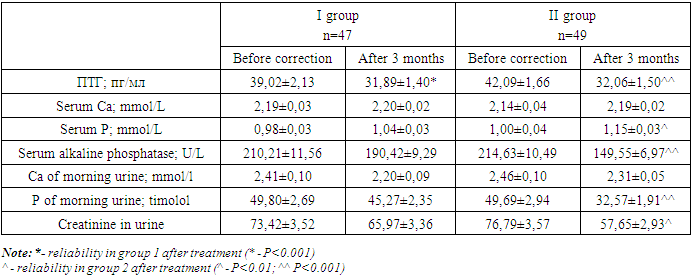
- After three months of administering cholecalciferol, both groups showed a positive outcome. This outcome was characterized by a considerable decrease in the number of children with vitamin D deficiency and insufficiency. In group 1, the prevalence of children with vitamin D deficiency decreased significantly from 72.4% (34 children) to 8.5% (4 children) (p<0.001). However, the prevalence of children with vitamin D deficiency increased from 27.6% (13 children) to 36.2% (17 children) (p>0.5). Additionally, 55.3% (26 children) had normal vitamin D levels (p<0.001) (Table 1). Among children who received vitamin D based on their body weight, there was a notable and statistically significant improvement in their vitamin D levels. The number of children with vitamin D deficiency decreased from 36 (73.5%) to 3 (6.1%) (p<0.001), while the incidence of deficiency decreased from 13 cases (26.5%) to 10 cases (20.4%). Additionally, there was a significant increase in the number of children with normal vitamin D levels, which rose to 36 cases (73.5%) (p<0.001).
|

|
|
3. Discussion of the Results Obtained
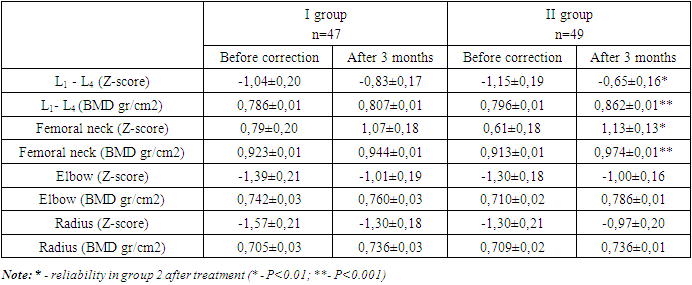
- Currently, there is extensive discussion in both domestic and foreign literature regarding the ongoing epidemics of obesity and vitamin D insufficiency among children. Multiple authors have reported a high frequency of decreased vitamin D availability, affecting up to 90% of the population due to various reasons [1,8]. Simultaneously, the prevalence of vitamin D deficiency is equally common among children as it is among adults [5,8]. Contemporary authors regard obesity as a precursor or a concurrent condition that often accompanies the development of osteopenia. Multiple studies undertaken by various authors have demonstrated a correlation between higher fat mass and lower bone mineral density [9,10,11].Accurate diagnosis of osteopenia and osteoporosis, particularly in children, can be achieved through the use of X-ray densitometry. This method, considered the most reliable for measuring bone mineral density, takes into consideration the individual's age and growth stage, and allows for comparison of the results with established pediatric databases. There is a lack of consensus among scientists worldwide on the prescription of a standardized dosage of vitamin D for both treatment and preventative purposes. The changes in age, weight, the existence of concomitant pathology, and other factors contribute to this phenomenon [5,11]. We implemented a customized approach to administering an aqueous cholecalciferol solution based on the SDS BMI. This approach resulted in significantly improved outcomes in normalizing vitamin D levels and positively impacting bone resorption processes. Additionally, it led to improvements in BMD indices as measured by radiological densitometry.
4. Conclusions
- Administering cholecalciferol based on body weight for a period of 3 months results in the normalization of 25(OH)D levels in 73.5% of cases, an increase in bone mineral density (P<0.0001), and the normalization of PTH levels (P<0.001). The method of differentiated correction of vitamin D insufficiency and deficiency in school-age children with obesity has been established and is approved for practical usage in medical institutions.
References
| [1] | Dedov I.I. et al. Vitamin D deficiency in adults: diagnosis, treatment and prevention. / Dedov I.I., Melnichenko G.A., Pigarova E.A., Dzeranova L.K., Rozhinskaya L.Y., Troshina E.A. Study guide: Clinical recommendations of the Russian Association of Endocrinologists. - M.-Tver: LLC "Publishing House "Triada", 2020. - 48 с. |
| [2] | Kaladze N.N. Indicators of bone metabolism and fat metabolism in children with excess body weight / N.N. Kaladze, N.N. Skoromnaya // TMBV. - 2016. - №1. - С.45-50. |
| [3] | Sharipova O.A. et al. Osteopenic syndrome in children with chronic lung diseases. Monograph. Samarkand 2021. 144 pp. |
| [4] | Shamansurova, E., Isakhanova, N. Vitamin D status in recurrent respiratory diseases in children. //Journal of the doctor's bulletin, 2018. - 1(4), 84-87. |
| [5] | Zakharova, I.N. Provision of vitamin D and correction of its insufficiency in young children in the Russian Federation / I.N. Zakharova // Practical Medicine. - 2017. - № 106. - VOL. 5. - P.22-28. |
| [6] | Obesity and overweight. Newsletter.: website. - October, 2017. - URL: http://www.who.int/mediacentre/factsheets/fs311/ru/. |
| [7] | Looker AC., Johnson CL., Lachner DA., Pfeiffer CM., Schleicher RL., Sempos CT. Vitamin D status: United States, 2001-2006. NCHS Data Brief. 2011; 56. |
| [8] | Malyavskaya S.I. Components of metabolic syndrome in children and adolescents with different levels of vitamin D: results of a one-stage study // Voprosy sovremennoi paediatria. - 2017 - №3 (vol. 16). - P.213-219. |
| [9] | Shapses S.A. Obesity is a concern for bone health with aging / S.A. Shapses, L.C. Pop, Y. Wang // Nutrition Research. - 2017. - Vol. 39. - P.1 -13. |
| [10] | Association between serum osteocalcin and body mass index: a systematic review and meta-analysis / H. Kord-Varkaneh, K. Djafarian, M. Khorshidi, S. Shab-Bidar // Endocrine. - 2017. - Vol.58. - P.24-32. |
| [11] | Obesity, osteoporosis, and bone metabolism / K. Gkastaris, D.G. Goulis, M. Potoupnis [et al.] // J Musculoskeletal Neuronal Interact. 2020. - Vol.20. - №3. - P.372-381. |