-
Paper Information
- Next Paper
- Paper Submission
-
Journal Information
- About This Journal
- Editorial Board
- Current Issue
- Archive
- Author Guidelines
- Contact Us
American Journal of Medicine and Medical Sciences
p-ISSN: 2165-901X e-ISSN: 2165-9036
2024; 14(5): 1222-1226
doi:10.5923/j.ajmms.20241405.17
Received: Apr. 13, 2024; Accepted: May 7, 2024; Published: May 11, 2024

Evaluation of the Circulating Biomarker Apelin 12 in Visceral Obesity
 Abstract
 Reference
 Full-Text PDF
 Full-text HTML
Rasulova Z. D., Nuritdinova M. D.
Central Consultative and Diagnostic Clinic No. 1 of the Main Medical Directorate under the Administration of the President of the Republic of Uzbekistan
Copyright © 2024 The Author(s). Published by Scientific & Academic Publishing.
This work is licensed under the Creative Commons Attribution International License (CC BY).
http://creativecommons.org/licenses/by/4.0/

Is the assessment of apelin 12 in obese patients in relation to indicators of visceral obesity. A study of the level of apelin in relation to indicators of visceral adipose tissue dysfunction depending on cardiovascular risk showed correlations, which makes it possible to predict the intensification of visceral obesity using additional markers of visceral obesity. An assessment of a marker such as apelin-12 to predict the progression of fat metabolism disorders, visceral tissue dysfunction can be included along with an assessment of calculated VAT indicators (VOI, % adipose tissue, visceral fat level according to bioimpedance analysis, hepatic steatosis index (HSI) and liver steatosis index (LSI)), epicardial fat thickness tissue into the patient examination algorithm to assess visceral adipose tissue (VAT) dysfunction and prevent cardiovascular risks.
Keywords: Obesity, Visceral obesity, Biomarkers, Adipokine, Apelin 12, Cardiovascular diseases
Cite this paper: Rasulova Z. D., Nuritdinova M. D., Evaluation of the Circulating Biomarker Apelin 12 in Visceral Obesity, American Journal of Medicine and Medical Sciences, Vol. 14 No. 5, 2024, pp. 1222-1226. doi: 10.5923/j.ajmms.20241405.17.
Article Outline
1. Introduction
- Obesity, which in the 21st century has received the status of a non-infectious pandemic, and associated metabolic disorders are becoming one of the main risk factors for the development and progression of cardiovascular pathology [3,11]. The greatest risk of cardiovascular diseases (CVD) is associated with visceral obesity and its characteristic metabolic changes (insulin resistance (IR), hyperglycemia, dyslipidemia, imbalance of adipokines and inflammatory markers). Visceral obesity is associated with an increased risk of developing disorders of carbohydrate and fat metabolism, as well as cardiovascular complications. Currently, many adipokines are known: leptin, adiponectin, apelin, etc. An increase in the concentration of apelin in obesity and its connection with the visceral type of distribution of adipose tissue has been noted [2,7]. Thus, a number of authors indicate that the increase in the degree of abdominal obesity is accompanied by a statistically significant increase in the content of plasma apelin. At the same time, there is a positive correlation of apelin with waist circumference (WC) and the ratio of waist circumference to hip circumference (WC/HC). Foreign authors note an increase in apelin levels in obesity in combination with hyperinsulinemia [2,6]. In this aspect, prediction and early detection of cardiomebolic disorders is an urgent task of modern medicine, the solution of which can be achieved using clinical methods, functional diagnostics, as well as through non-invasive laboratory diagnostic methods [9,11]. Currently, there are a number of anthropometric and instrumental methods for quantifying adipose tissue. However, not all of them fully reflect the degree of visceral obesity and cardiovascular risk (CVR). Currently, apelin is being actively studied as a predictor of complications of obesity in various age and gender groups. According to some authors, serum levels of apelin were higher in obese individuals compared to the control group, while the concentrations of the biomarker were positively correlated with OW, cholesterol, insulin, fasting glucose levels and the index of insulin resistance (IR) [2,6] and apelin is a more sensitive biomarker of visceral adipose tissue (VAT) dysfunction than adiponectin and leptin. The search for new reliable biomarkers and methods for diagnosing visceral obesity is an urgent task in the prevention of cardiometabolic complications.Purpose of the study: assessment of apelin 12 in obese patients in relation to indicators of visceral obesity.
2. Material Method
- A total of 167 individuals aged 40-70 years without diagnosed CVD (coronary heart disease, chronic heart failure, clinically pronounced atherosclerosis with hemodynamically significant stenosis of the great arteries, etc.) were examined. All patients were distributed depending on the degree of obesity: group 1 with overweight consisted of 27 individuals with OW=29.3±1.4 kg/m2, group 2 with 1 degree of obesity consisted of 108 individuals with OW=34.9±1.3, Group 3 with 2nd degree obesity consisted of 32 individuals with OW=39.2±2.4. The control group consisted of 12 healthy individuals with low CVR according to SCORE2 and normal body weight. Cardiovascular risk (CVR) was assessed according to SCORE-2: with low and moderate CVR - 82, with high CVR - 49 individuals, with very high CVR without coronary CVD - 36 individuals. The examination included assessment of anthropometric indicators: body weight BW, height, waist (WC) and hips (HC), OW (OW=kg/height, m2), WC/HC ratio; clinical and laboratory parameters: blood pressure, determination of cholesterol ChSD, low-density lipoprotein ChS-LDL, triglycerides TG, high-density lipoprotein ChS-HDL, glucose in blood serum, C-reactive protein (C-RP) apelin 12 in blood serum, Echocardiography (EchoCG) with determination of structural and geometric parameters of the heart (end-diastolic size EDS, end-systolic size ESS), thickness of epicardial adipose tissue (TEAT) along the atrioventricular groove (AVS) [1,4]. The content of apelin-12 in blood plasma was determined by the enzyme immunoassay using the “Apelin-12 (Human, Rat, Mouse, Bovine) EIA Kit” reagent kit produced by Phoenix Pharmaceuticals (USA) [6,8]. The body composition was assessed using bioimpedance analysis: determination of the percentage of visceral and total fatty tissue. To assess the state of fat metabolism, indicators were also used [3,5,9]:• accumulation of lipid products (LAP) was studied according to Kahn, LAP=(WC (cm)–65)×TG;• visceral obesity index (VOI) was calculated using Amato:for men - VI = (waist circumference/39.68 + 1.88×OW) × (TG/1.03) × (1.31/ChS HDL); in women - VOI = (waist circumference/36.58 + 1.89×OW) × (TG/0.81) × (1.52/ChS HDL). (VAI -1.93 normal, 1.94–2.32 slight dysfunction of adipose tissue, 2.32–3.25 moderate dysfunction of adipose tissue, VOI >3.25 high dysfunction of adipose tissue).• liver steatosis index LSI = -3.5856+(0.0141*age)+(0.4711*DM)+ (4.4373*WC/Height*100), where diabetes is present - 1, if diabetes is not present - 0.• hepatic steatosis index HSI= 8* alanine transpeptidase (АLT)/aspartate transpeptidase (AST)+OW (+2 in the presence of T2DM, +2 if female). HSI values >36.0 indicate the presence of hepatic steatosis in the patient with a sensitivity of 93.1%, specificity of 92.4% with an accuracy of AUROC of 0.812.Statistical processing of the research results was carried out using the generally accepted method using a personal computer (Excel 2010 program). The arithmetic mean (M) and the error of the arithmetic mean (m) were determined. To determine the statistical significance of differences between the compared indicators, Student's t-test was used.
3. Research Results and Discussion
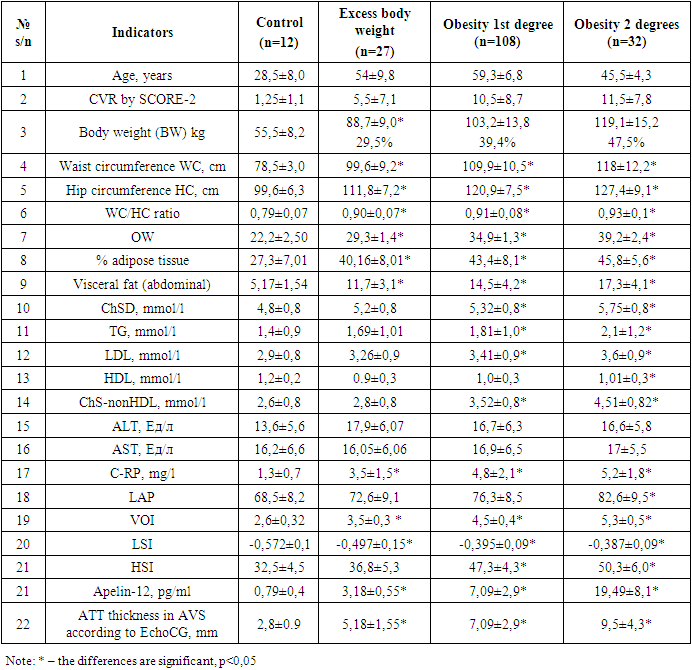
- When assessing anthropometric parameters, the following were assessed: body weight, height, waist (WC) and hip (HC) with an assessment of the WC/HC ratio), OW. As well as additional data from bioimpedance analysis of body composition: determination of the percentage of visceral and total adipose tissue, biochemical indicators of lipid metabolism disorders, glucose, apelin 12, calculated indicators of visceral obesity. These indicators are presented in Table 1.
|
4. Result Discussion
- One new method for assessing abdominal adipose tissue is VOI, a marker of VAT dysfunction. In many studies, increased indices of VAT dysfunction such as VOI, visceral fat levels according to bioimpedance analysis, and hepatic steatosis index HSI were associated with high cardiometabolic risk, both in the general population and in patients without any obvious metabolic disorders [3,5]. The results of our study showed a significant increase in epicardial visceral tissue thickness (EVTT) in groups with overweight, grade 1 and 2 obesity by 85% (p<0.05), 150% (p<0.05) and 239% (p<0.05), respectively compared to control indicators. An increase in EVTT is associated with insulin resistance - with EVTT more than 9.5 mm, IR develops significantly more often. According to O.M. Drapkina et al., with an AT layer thickness of 2.7 to 4.5 mm and diastolic function E/A of less than 0.8, IR can be diagnosed with high accuracy [4,10]. The results of our study showed a significant increase in EVTT in groups with overweight, grade 1 and 2 obesity by 85% (p<0.05), 150% (p<0.05) and 239% (p<0.05), respectively compared to control indicators. An increase in EVTT is associated with insulin resistance - with TAT more than 9.5 mm, IR develops significantly more often. According to O.M. Drapkina et al., with an AT layer thickness of 2.7 to 4.5 mm and diastolic function E/A of less than 0.8, IR can be diagnosed with high accuracy. The results of our study showed a significant increase in EVTT in groups with overweight, grade 1 and 2 obesity by 85% (p<0.05), 150% (p<0.05) and 239% (p<0.05), respectively compared to control indicators. An increase in EVTT is associated with insulin resistance - with EVTT more than 9.5 mm, IR develops significantly more often. According to O.M. Drapkina et al., with an AT layer thickness of 2.7 to 4.5 mm and diastolic function E/A of less than 0.8, IR can be diagnosed with high accuracy. The results of our study showed a significant increase in EVTT in groups with overweight, grade 1 and 2 obesity by 85% (p<0.05), 150% (p<0.05) and 239% (p<0.05), respectively compared to control indicators. An increase in EVTT is associated with insulin resistance - with EVTT more than 9.5 mm, IR develops significantly more often. According to O.M. Drapkina et al., with an AT layer thickness of 2.7 to 4.5 mm and diastolic function E/A of less than 0.8, IR can be diagnosed with high accuracy. The results of our study showed a significant increase in EVTT in groups with overweight, grade 1 and 2 obesity by 85% (p<0.05), 150% (p<0.05) and 239% (p<0.05), respectively compared to control indicators. An increase in EVTT is associated with insulin resistance - with EVTT more than 9.5 mm, IR develops significantly more often. According to O.M. Drapkina et al., with an AT layer thickness of 2.7 to 4.5 mm and diastolic function E/A of less than 0.8, IR can be diagnosed with high accuracy. The results of our study showed a significant increase in EVTT in groups with overweight, grade 1 and 2 obesity by 85% (p<0.05), 150% (p<0.05) and 239% (p<0.05), respectively compared to control indicators. An increase in EVTT is associated with insulin resistance - with EVTT more than 9.5 mm, IR develops significantly more often. According to O.M. Drapkina et al., with an AT layer thickness of 2.7 to 4.5 mm and diastolic function E/A of less than 0.8, IR can be diagnosed with high accuracy. The results of our study showed a significant increase in EVTT in groups with overweight, grade 1 and 2 obesity by 85% (p<0.05), 150% (p<0.05) and 239% (p<0.05), respectively compared to control indicators. An increase in EVTT is associated with insulin resistance - with EVTT more than 9.5 mm, IR develops significantly more often. According to O.M. Drapkina et al., with an AT layer thickness of 2.7 to 4.5 mm and diastolic function E/A of less than 0.8, IR can be diagnosed with high accuracy. The results of our study showed a significant increase in EVTT in groups with overweight, grade 1 and 2 obesity by 85% (p<0.05), 150% (p<0.05) and 239% (p<0.05), respectively compared to control indicators. An increase in EVTT is associated with insulin resistance - with TAT more than 9.5 mm, IR develops significantly more often. According to O.M. Drapkina et al., with an AT layer thickness of 2.7 to 4.5 mm and diastolic function E/A of less than 0.8, IR can be diagnosed with high accuracy. The results of our study showed a significant increase in EVTT in groups with overweight, grade 1 and 2 obesity by 85% (p<0.05), 150% (p<0.05) and 239% (p<0.05), respectively compared to control indicators. An increase in EVTT is associated with insulin resistance - with EVTT more than 9.5 mm, IR develops significantly more often. Analysis of the Apelin 12 index as an early predictor of adipose tissue dysfunction in groups with overweight, grade 1 and grade 2 obesity revealed a significant increase of 75% (p<0.05), 88.8% (p<0.05) and 95.9% (p<0.05), respectively, compared with control indicators. A high correlation between the apelin 12 indicator and OW, visceral fat level, CVR according to SCORE-2 according to impedance analysis and EVTT was revealed with a correlation coefficient of r=0.80, r=0.86, r=0.70 and r=0,40 respectively.The identified results showed that the assessment of such a marker as apelin can be used to assess and predict the progression of fat metabolism disorders, dysfunction of visceral adipose tissue and can be included together with the assessment of calculated VAT indicators (VOI, % adipose tissue, visceral fat level according to bioimpedance analysis , HSI and LSI), determination by the EchoCG EVTT method into an algorithm for examining patients in the high and very high CVR groups in order to assess VAT dysfunction and prevent cardiovascular risks [2,6].It is no coincidence that visceral obesity is identified as the main criterion for diagnosing metabolic syndrome (MC). It is this that is a powerful risk factor for metabolic disorders and leads to the development of IR and compensatory hyperinsulinemia. Abdominal fat has some features that lead to the formation of IR, while the accumulation of subcutaneous fat, in contrast, does not lead to metabolic disorders and may even be protective against MC. In addition, an increase in EVTT is associated with signs of vascular wall remodeling, endothelial dysfunction, lipid metabolism disorders, and impaired left ventricular diastolic function [4]. A close relationship between the amount of epicardial adipose tissue and coronary heart disease (CHD) was also revealed (r=0.3) - EVTT less than 7 mm predisposes to the development of subclinical atherosclerosis, more than 7 mm - to the development of CHD [4,10]. According to D. Corradi et al., EVTT correlated with myocardial hypertrophy and left ventricular diastolic function.Abdominal fat is hormonally active. It is known that visceral adipose tissue produces many different biologically active substances, which are called adipokines. These adipokines play an important role in the formation of IR. Apelin is an adipokine that is relatively little studied. It is noted that its level increases with obesity and is directly related to the visceral type of distribution of adipose tissue. It was found that plasma apelin concentration significantly increases with increasing degree of abdominal obesity and directly correlates with WC and the ratio of WC to hip circumference (WC/HC) [2]. High apelin content has also been recorded in obesity in combination with hyperinsulinemia [8]. Of particular interest is the work of researchers who analyzed the relationship between plasma apelin concentrations and cardiac remodeling in patients with abdominal obesity. It was shown that apelin concentrations in obese patients were higher than in healthy controls, and levels of the marker negatively correlated with structural changes in the heart, which may indicate the importance of apelin as a factor with cardioprotective properties [7].
5. Conclusions
- The identified results indicate dysfunction of adipose tissue and excessive accumulation of visceral fat tissue in high and very high risk patients, both obese and overweight, and with normal body weight. The established correlations make it possible to predict the intensification of visceral obesity using additional markers of visceral obesity; being simple, easily reproducible and inexpensive, they can be widely used in everyday clinical practice. Assessment of a marker such as apelin 12 can be used to assess and predict the progression of fat metabolism disorders, visceral tissue dysfunction and can be included together with the assessment of calculated VAT indicators (VOI, % adipose tissue, visceral fat level according to bioimpedance analysis, HSI and LSI) in algorithm for examining patients to assess VAT dysfunction and prevent cardiovascular risks.