-
Paper Information
- Previous Paper
- Paper Submission
-
Journal Information
- About This Journal
- Editorial Board
- Current Issue
- Archive
- Author Guidelines
- Contact Us
American Journal of Medicine and Medical Sciences
p-ISSN: 2165-901X e-ISSN: 2165-9036
2023; 13(12): 1926-1934
doi:10.5923/j.ajmms.20231312.23
Received: Nov. 25, 2023; Accepted: Dec. 10, 2023; Published: Dec. 13, 2023

Features of Voice in Children after Laryngeal Surgery
 Abstract
 Reference
 Full-Text PDF
 Full-text HTML
Munira Ulugbekovna Alieva1, Abdumannop Abdumazhidovich Abdukayumov2, Nazima Shamsutdinovna Nadzhmutdinova3, Flora Ilyasovna Inoyatova4
1Phoniatrist, Junior Researcher, Republican Specialized Scientific and Practical Medical Center of Pediatrics (RSNPMC Pediatrics), Tashkent, Republic of Uzbekistan
2Director, Doctor of Medical Sciences, Republican Specialized Scientific and Practical Medical Center of Pediatrics (RSNPMC Pediatrics), Tashkent, Republic of Uzbekistan
3Senior Researcher, Doctor of Medical Sciences, Republican Specialized Scientific and Practical Medical Center of Pediatrics (RSNPMC Pediatrics), Tashkent, Republic of Uzbekistan
4Head of the Scientific Program, Academician of the Academy of Sciences of the Republic of Uzbekistan, Republican Specialized Scientific and Practical Medical Center of Pediatrics (RSNPMC Pediatrics), Tashkent, Republic of Uzbekistan
Correspondence to: Munira Ulugbekovna Alieva, Phoniatrist, Junior Researcher, Republican Specialized Scientific and Practical Medical Center of Pediatrics (RSNPMC Pediatrics), Tashkent, Republic of Uzbekistan.
| Email: |  |
Copyright © 2023 The Author(s). Published by Scientific & Academic Publishing.
This work is licensed under the Creative Commons Attribution International License (CC BY).
http://creativecommons.org/licenses/by/4.0/

The article presents the results of a study of the larynx of children with phonia, the methods of laryngoscopy and spectral computer acoustic analysis of voice. The studies examined 113 children aged 3 to 17 years with hoarseness and dysphonia lasting more than 1 month after surgical interventions in the larynx. First, a phoniatrist performed a visual examination of the larynx and assessed the condition of the larynx using video endostroboscopy. Then, using acoustic voice analysis, spectrograms with indicators of voice characteristics were obtained. The results showed that after laryngeal surgery in sick children, there is an improvement in the respiratory function of the larynx, but the vocal function does not always improve. Studies have shown that in cases of vocal cord movement dysfunction, the rate of zero points was 3.9 times higher than in the control group. Also informative are the indicators of the minimum and maximum values of the sound signal and the energy of discrete signals. Research has shown that most parameters of voice characteristics (loudness, pitch, timbre, pitch frequency) are subjective characteristics that can vary widely, with only some differences in maximum and minimum values. However, acoustic voice analysis is an indispensable method for diagnosing voice disorders, which allows you to quickly and accurately assess the degree of voice disorder, evaluate the effectiveness of the treatment and develop treatment tactics for dysphonia.
Keywords: Voice, Dysphonia, Video endostroboscopy, Spectral acoustic analysis of voice, Spectrogram
Cite this paper: Munira Ulugbekovna Alieva, Abdumannop Abdumazhidovich Abdukayumov, Nazima Shamsutdinovna Nadzhmutdinova, Flora Ilyasovna Inoyatova, Features of Voice in Children after Laryngeal Surgery, American Journal of Medicine and Medical Sciences, Vol. 13 No. 12, 2023, pp. 1926-1934. doi: 10.5923/j.ajmms.20231312.23.
Article Outline
1. Introduction
- Clinical voice disorders are heterogeneous conditions that may involve both anatomical damage and physiological disturbances, including problems with voice production and central nervous system control of voice. Mood, anxiety, and personality characteristics are hypothesized to influence the occurrence and development of voice disorders [1]. In case of voice disorders caused by the adverse effects of environmental factors - triggers (microorganisms - viruses, bacteria, exogenous allergens, polluting particles - pollutants), the same changes of a psychogenic nature are observed, with minimal quantitative differences between functional and organic diagnoses of dysphonia.Research shows that almost 30% of the population will experience a voice disorder at least once during their lifetime [2]. Hoarseness more constantly accompanies a certain group of the population, which includes teachers and the elderly; in recent years, other groups of the population cannot be excluded - the younger generation, which actively uses the voice in their professional activities, regardless of gender [3,4,5,6]. In addition, voice impairment has a negative impact on the quality of life, which leads to loss of performance and frequent visits to the doctor [7].The cause of hoarseness can be both benign diseases and progressive conditions that threaten the patient’s life. The term “hoarseness” describes a qualitative loss of voice and implies an abnormal change in voice. Dysphonia is a voice production disorder in which the quality of the voice (pitch, strength, timbre) is impaired, as a result of which the voice becomes defective. Dysphonia negatively affects the social and professional life of the patient.Most often, the cause of dysphonia is disorders of a psychogenic nature, which are expressed in functional disorders of voice reproduction. However, some patients are susceptible to dysphonia-modifying factors resulting from previous laryngeal surgery, surgical procedures involving the neck or recurrent laryngeal nerve, recent endotracheal intubation, radiation therapy to the neck, and dysphonia in singers or performers affected by traditional treatment procedures. psychotherapeutic nature are not applicable.The epidemiology of dysphonia shows that the lifetime prevalence of dysphonia in the population is 29.9% - who have had dysphonia at some point in their lives. At the same time, the prevalence of the disease is 6.6% - these are those patients who have dysphonia at a given time [2]. A study of the prevalence of dysphonia among population groups shows that its level is high among traders (31%), various instructors (44%) and teachers (58%). At the same time, women get sick more often than men, with a ratio of 60:40 [3,6].Various studies have shown that the prevalence of dysphonia in children varies widely from 3.9% to 23.4% and is more common between the ages of 8 and 14 years. At the same time, voice problems persist longer (4 years or more) in 38% of patients, which requires more active medical intervention, given the emotional instability of the child population and the possibility of dysphonia influencing the child’s entire future life [8,9,10].Modifying factors for dysphonia (factors leading or provoking dysphonia) can be: operations or manipulations to ensure emergency airway patency, or directly on the larynx, which can lead to changes in the structure of the larynx and voice pathology [11]. Prolonged endotracheal intubation leads to dysphonia - for example, direct laryngoscopy during intubation in 94% of patients causes laryngeal injury with loss of voice for more than four days (an average of nine days) [12]. However, persistent patterns observed with prolonged intubation include laryngeal edema and ulceration of the middle and posterior third of the vocal folds. In 44% of patients with prolonged intubation (more than 4 weeks), vocal fold granulomas may develop. Also, in 18% of cases, long-term true immobility of the vocal cords was observed within a month after extubation. Chronic vocal dysfunction may also develop after prolonged intubation. Short-term intubation under general anesthesia can lead to dysphonia and pathology of the vocal cords in more than 50% of cases, with symptoms leveling off after 5 days [13]. In newborns, prolonged intubation can lead to erosion of the arytenoid process and ulceration of the posterior commissure mucosa with the development of dysphonia. Chronic dysphonia is quite common in young children, ranging from 15 to 24%. In children, dysphonia in 77% of cases is caused by nodules on the vocal folds, which, in the absence of proper treatment, can persist for a long time until adolescence [14]. Also, the causes of dysphonia can be craniofacial anomalies, such as orofacial clefts associated with voice disorders caused by resonator disorders, requiring a completely different approach to both diagnosis and treatment [15]. In infants, the causes of dysphonia may be birth trauma, intracranial pathology (Arnold-Chiari malformation), posterior fossa formations, or mediastinal pathology [16]. Traditionally, visualization of the larynx using laryngoscopy has been used to diagnose dysphonia. However, laryngoscopy examination should be carried out after three months of dysphonia duration, since positive changes may be transient, taking into account modifying factors and the clinical picture of the disease.Currently, the diagnosis and effective treatment of dysphonia is ensured by the introduction into the practice of a phoniatrist of modern innovative objective methods for assessing the state of the vocal function of the larynx. The method of computer spectral acoustic analysis of the voice is a non-invasive method for diagnosing voice dysphonia, which is based on subjective and objective data of the patient’s voice [17,18,19], and the acoustic parameters of the voice objectively reflect the qualitative and quantitative characteristics of the voice [20,21,22,23].Scientific studies of patients with voice disorders are relevant, helping to identify differences between anatomical and functional disorders of the larynx.The purpose of this work is to study the parameters of the voice of children with dysphonia using the method of spectral acoustic analysis of the voice and to identify the features of the functional characteristics of the voice of children with dysphonia.
2. Material and Research Methods
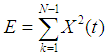
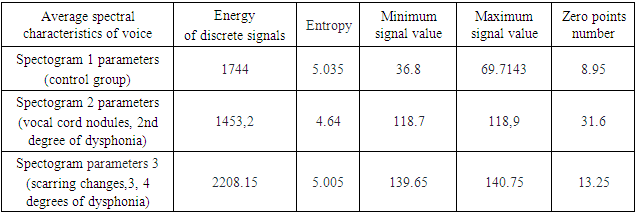
- The studies examined 113 children aged 3 to 17 years with dysphonia, 65 boys (57.5%) and 48 girls (42.5%). By age, the sick children were: 3-6 years old - 63 patients (55.8%), 7-11 years old - 32 patients (28.3%), 12-17 years old - 18 patients (15.9%). Subjective assessment of the degree of voice impairment (degree of hoarseness) was carried out using a special scale by N. Yanagihara (1967) in points from 0 to 5 [24]: 0 – normal voice; 1 – dull voice; 2 – mild degree of hoarseness; 3 – moderate degree of hoarseness; 4 – severe degree of hoarseness; 5 – aphonia.The main acoustic characteristics of the patients' voices were assessed based on the method of spectral computer voice analysis. In a special room equipped with soundproofing, children's voices were recorded using a microphone equipped with a built-in noise level meter. The microphone was placed at a distance of 30 cm from the child’s mouth. The optimal mode for voice recording was a noise level of no more than 40 dB. As a test signal, a long sound “a” was recorded with a sample rate of 44.1 kHz [13], and the sound of the child’s voice was recorded on a microphone on a computer with audio signals of WAV format with a sampling frequency of 44100 Hz, mono type software for recording and editing audio data recording Audacity. The patients' voices were recorded when they pronounced the vowel sounds “A”, “I”, “U” with the same voice strength, and the corresponding spectrograms were obtained. Based on the spectrograms, graphs were created and voices were assessed according to 5 (five) acoustic parameters of the voice:1) Energy of discrete signals plays an important role in detecting useful signals against the background of interference and noise, because useful components of sound signals have more energy than random interference and noise. The energy of a discrete signal is formed as the sum of the squares of samples on a given segment:
 | (1) |
 | (2) |
 of the function y=f (x) at the point
  is called the largest value of the function f (x) on the set X if for any point
  the inequality
  is satisfied.4) Minimum signal value is the smallest instantaneous value of the audio signal over a given time interval. The value
  of the function y=f (x) at the point
  is called the smallest value of the function f (x) on the set X if for any point
  the inequality
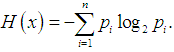
  is satisfied.5) The number of zero points (Zero points number) is an acoustic parameter of the voice, containing information about the number of zero crossings (zero amplitude). From the point of view of program development, the concept of a counter is introduced, which records the number of zero points and the counter is increased by one if a positive and then a negative value is found in the vector of signal values, or vice versa. It is an indicator of noise level of both speech and non-speech signals.
3. Research Results and Discussion
- All children studied were subjected to surgical treatment of the larynx.The results showed that the modifying factors for the development of dysphonia are: prolonged intubation with the development of scar changes - 19 patients (16.8%), vocal cord nodules - 25 patients (22.1%), respiratory papillomatosis of the larynx - 58 patients (51.3%), congenital pathologies (membranes) – 11 patients (9.7%).The results showed that grade 2 dysphonia is observed in 57 patients (50.4%), of which: 25 patients after removal of vocal cord nodules (VCN), 7 patients after elimination of the laryngeal membrane (LM), 10 patients after surgical treatment of scar changes after long-term intubation, 15 patients – after treatment of respiratory recurrent populitis (RRP). Grade 3 dysphonia is observed in 32 patients (28.3%), of which: 3 patients after treatment with MG, 29 patients after treatment with RRP. Grade 4 dysphonia is observed in 21 patients (18.6%), of which: 12 patients after RRP and 8 patients after surgical treatment of scar changes after long-term intubation, 1 patient after excision of the laryngeal membrane. Aphonia of the 5th degree is observed in 3 patients (2.7%), of which: 2 patients after RRP and 1 patient after surgical treatment of scar changes after long-term intubation (Table 1).
|
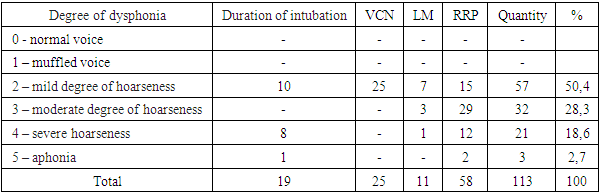
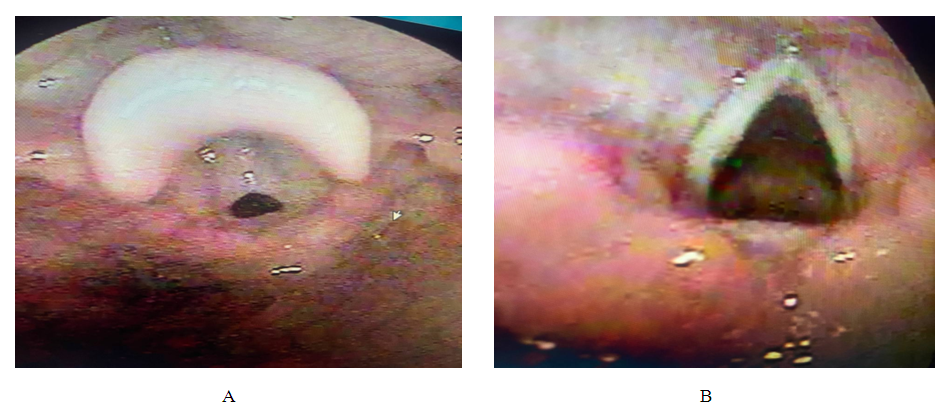
 | Figure 1. Photograph of the larynx of a sick 8-year-old child diagnosed with vocal cord nodules (VCN) before removal of the VCN (A) and after removal of the VCN (B) |
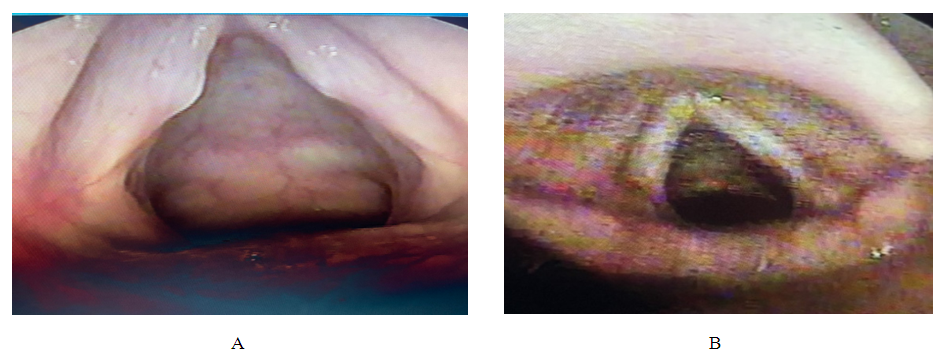
 | Figure 2. Photograph of the larynx of a sick 7-year-old child (since 3 years old, operated on 4 times, received antiviral treatment, remission for 2 years) with a diagnosis of respiratory recurrent papillomatosis (RRP) before RRP surgery (A) and after RRP surgery (B) |
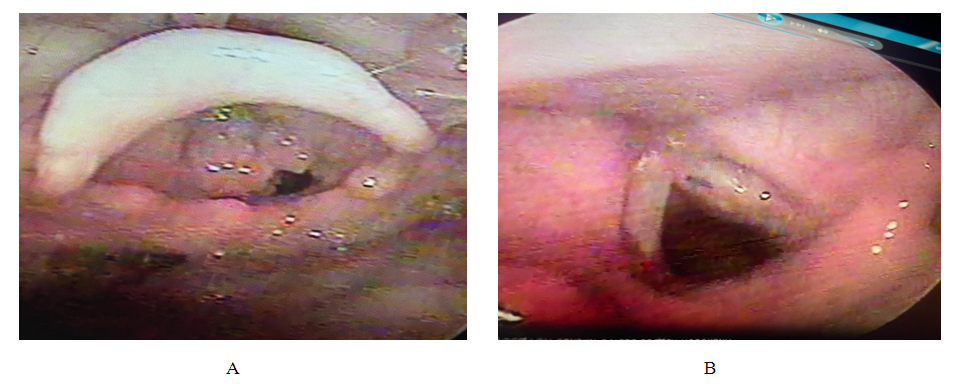
 | Figure 3. Photograph of the larynx of a sick 6-year-old child diagnosed with congenital membrane (CM) of the larynx before CM surgery (A) and after CM surgery (B) |
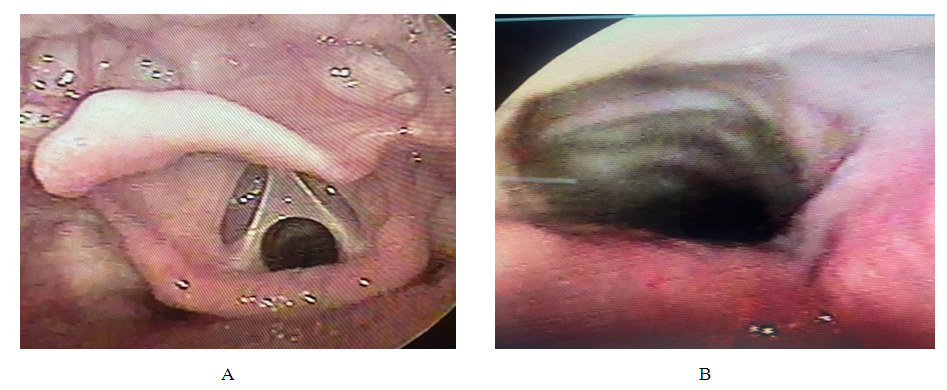
 | Figure 4. Photograph of the larynx of a sick 11-year-old child with a diagnosis of post-intubation laryngeal stenosis (long-term intubation due to brain injury), excision of the scar with dilatation for 2 months using a T-tube, before surgery (A) and after surgery (B) |
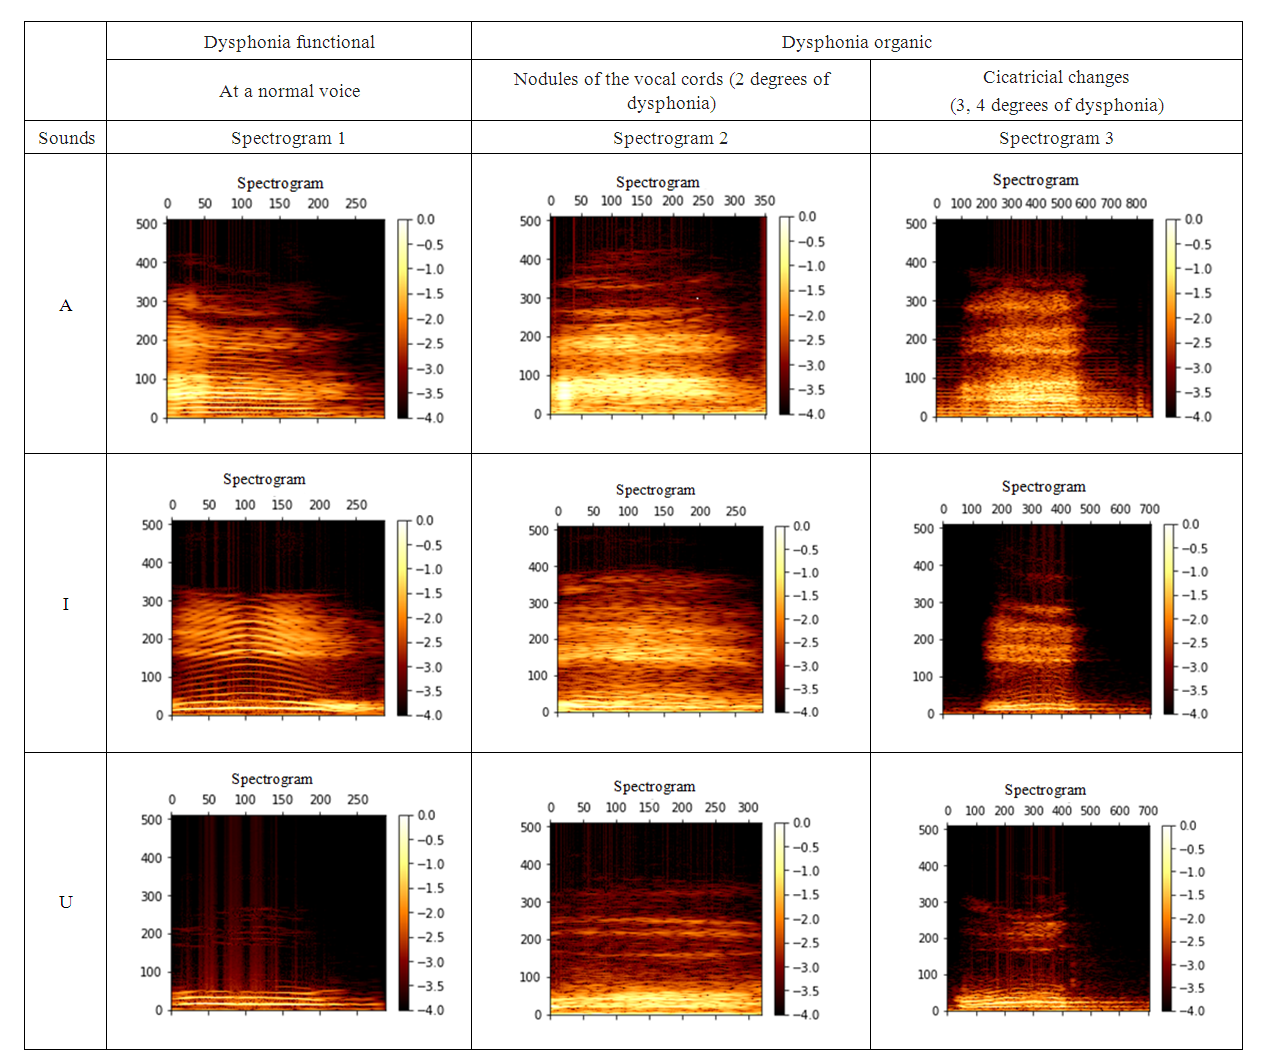 | Figure 5. Voice spectrograms |
|
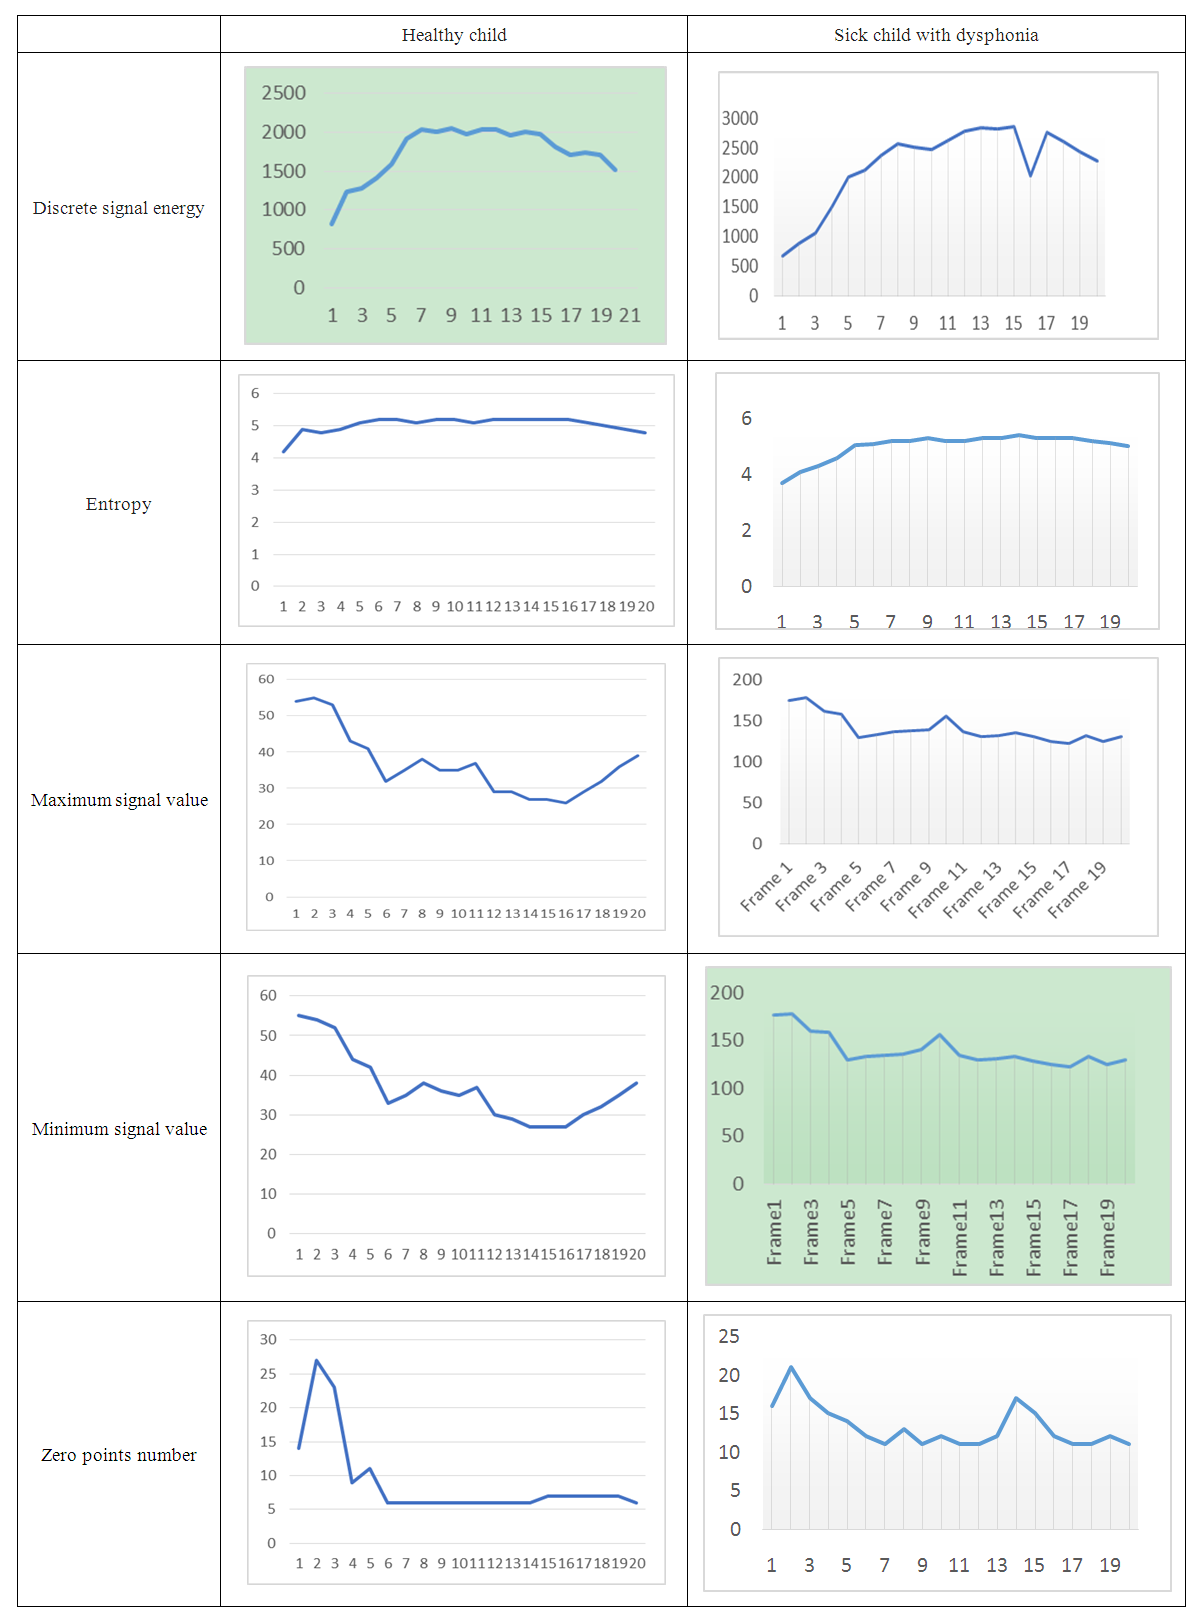 | Figure 6. Diagrams of the main spectral characteristics of the voice in the control group of children and sick children with dysphonia |
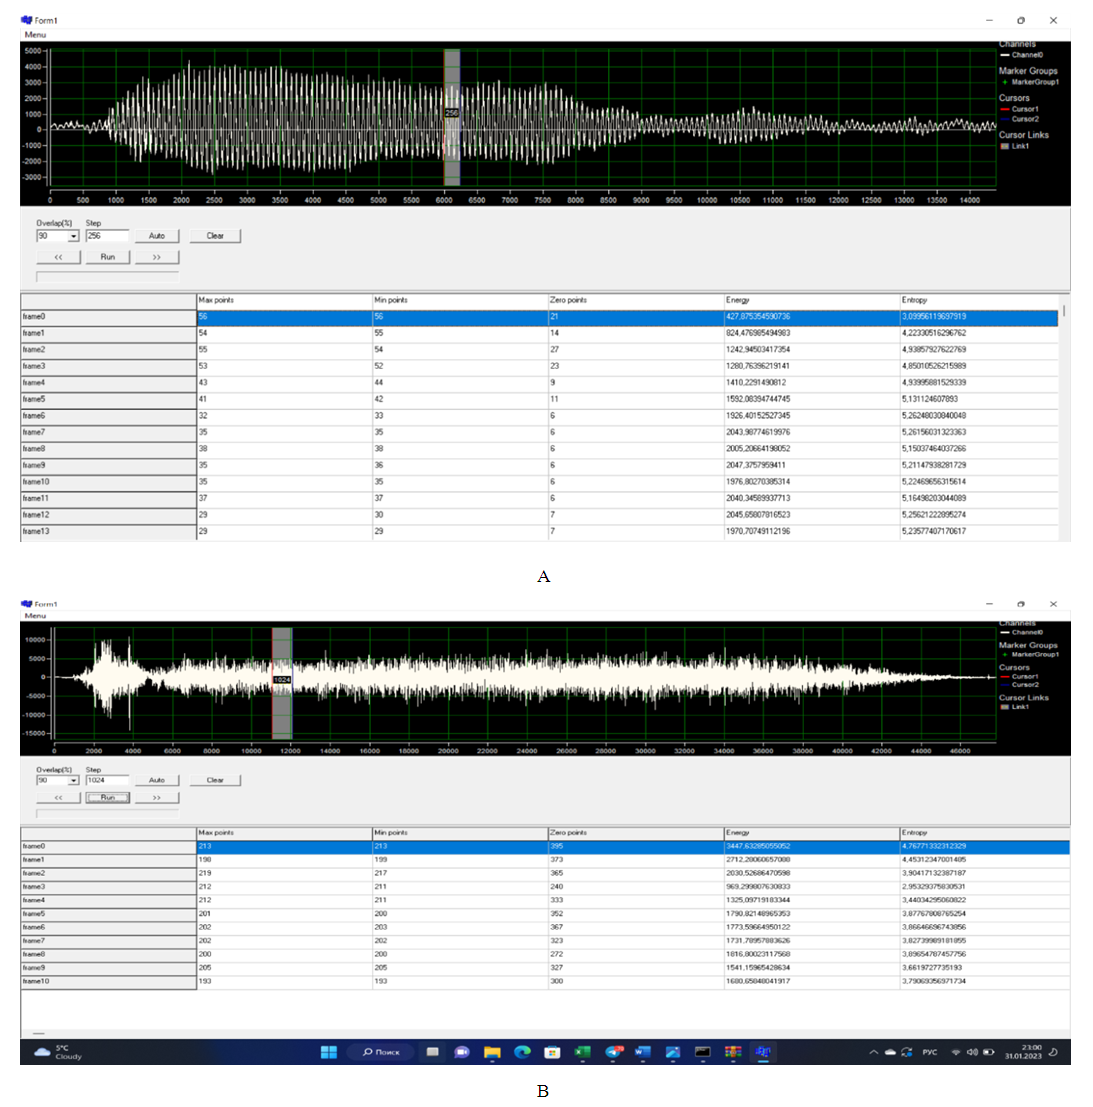 | Figure 7. Parameters of the audio signal of the voice of a healthy child (A) and a sick child with dysphonia (B) |
4. Conclusions
- Most of the voice parameters used to characterize the voice (loudness, pitch, timbre and fundamental frequency) can vary widely, having restrictions only in the maximum and minimum values, while these voice indicators are subjective indicators. The method of acoustic voice analysis provides an opportunity for a phoniatrist to objectively assess the course of the disease of the vocal apparatus in children with dysphonia and evaluate the effectiveness of various treatment methods. Indicators of the acoustic characteristics of the voice are objective characteristics and their use for diagnosing dysphonia requires additional scientific research to identify the features of the functional characteristics of the voice of children with dysphonia and to develop tactics for treating dysphonia.