A. G. Gadaev, R. K. Dadabaeva
Tashkent Medical Academy, Tashkent, Uzbekistan
Correspondence to: R. K. Dadabaeva, Tashkent Medical Academy, Tashkent, Uzbekistan.
| Email: |  |
Copyright © 2023 The Author(s). Published by Scientific & Academic Publishing.
This work is licensed under the Creative Commons Attribution International License (CC BY).
http://creativecommons.org/licenses/by/4.0/

Abstract
The purpose of the study. To study the features of clinical, metabolic, and hormonal indicators in Uzbek women with metabolically complicated obesity. Materials and methods. The study included 224 Uzbek women with a confirmed diagnosis of obesity. The observed patients were divided into 2 groups according to criteria including metabolic syndrome, group 1 consisted of 133 women, whose average age was 42.0 ± 0.5 years of Metabolic Complicated Obesity (MCO); group 2 consisted of 91 women with Metabolic Healthy Obesity MHO, whose average age was 41.7±0.7 years. The control group consisted of 45 healthy volunteers (women, average age 43.2 ± 0.8g. BMI < 30 kg/m2, waist circumference less than 80 cm). In all groups anthropometry, BP, the biochemical and lipid spectrum of blood, hormonal activity of adipose tissue with the enzyme immunoassay, and HOMA-IR index have been determined and evaluated comparatively. Results. The indices of body mass index - BMI, waist circumference - WC, Waist Circumference/ the Visceral Adiposity Index (VAI) in the INR group were significantly increased in relation to the group with MNO and the control group, and this is comparable with an increase in the level of leptin, insulin in blood plasma, as well as these metabolic - hormonal changes in the body of carbohydrate, lipid metabolism, and uric acid metabolism acids. At the same time, in group 1, VAI, BMI, systolic blood pressure - SBP, diastolic blood pressure - DBP, fasting glucose, HbA1c, total cholesterol - TC, triglycerides - TG, low-density lipoproteins - LDL, uric acid, positive with HOMA-IR index, in group 2, DBP, TC, TG, LDL and HDL had a positive correlation (p < 0.01; p < 0.001). In both groups, it was shown that the content of leptin and insulin in blood plasma is higher than the reference values, a violation of carbohydrate metabolism in group 1 was proved. Conclusion. Increased BMI, WC, and VAI in both phenotypes of obesity, are associated with increased disorders of carbohydrate and lipid metabolism, as well as uric acid metabolism. These interrelated processes lead to an increase in the hormonal activity of adipose tissue and an increase in cardiometabolic risk, which was clearly confirmed in the MOO group. In the MPG group, metabolic disorders occur subclinically and are the basis for being considered a cardiovascular risk group.
Keywords:
Metabolically healthy and metabolic complicated obesity, Body mass index and visceral obesity index, Insulin resistance, Leptin, Insulin
Cite this paper: A. G. Gadaev, R. K. Dadabaeva, Comparative Characteristics of Clinical, Metabolic, and Hormonal Indicators in Uzbek Women with Metabolically Healthy and Complicated Obesity, American Journal of Medicine and Medical Sciences, Vol. 13 No. 10, 2023, pp. 1572-1579. doi: 10.5923/j.ajmms.20231310.43.
1. Introduction
Metabolic syndrome (MS) is a complex of symptoms characterized by impaired carbohydrate, lipid, and purine metabolism as well as arterial hypertension [8]. According to official data, the prevalence of obesity in the world over the past 40 years has increased by 2 times among women and 3 times in men, as well as an increase in the body mass index of 0.59 in women and 0.63 kg/m2 in men every 10 years [28].Regardless of the definition of obesity, it is one of the components of metabolic syndrome, in the presence of which the likelihood of developing cardiovascular diseases (CVD) increases by 23%, and the occurrence of diabetes mellitus (DM) increases by 44%. This is caused by a decrease in insulin sensitivity of tissues caused by a slow inflammatory process in the body and dyslipidemia [35].It is known that MS is accompanied by subclinical damage to vital organs, in particular a decrease in the filtering nature of the kidneys, microalbuminuria (MAU), endothelial dysfunction, increased arterial stiffening, left ventricular dysfunction and hypertrophy, thickening of the wall of the carotid artery, fatty hepatosis of the liver or the development of non-alcoholic steatohepatitis [7,27]. However, not all patients with excess body weight or obesity are diagnosed with metabolic disorders, including changes in arterial blood pressure (AP), and lipid and carbohydrate metabolism. Such patients are included in the group of metabolic healthy obesity (MHO) [9,11,13]. Regardless of the population under study, MHO is more common in women compared to men, and this difference becomes less as one grows up [33]. Today, opinions about MHO are disproportionate to each other, while most studies argue that there is no correlation between it and the risk of developing CVD and DM disease [10,24,30], another group of scientific studies substantiated that this phenotype of obesity is not stationary, it is an intermediate stage of physiologically healthy and leading to the development of metabolic complicated obesity [14,19,31]. It is known that many studies have pointed out that by determining the body mass index (BMI), waist and lateral circumference (WC and LC), and their ratio (W/L), it is possible to predict the risk of infection, course, and death caused by them, which indicates that indeed abdominal obesity plays an important role in the development of unpleasant cardiovascular diseases [17,20]. Studies in recent years have pointed out that, in addition to an increase in BMI, an increase in the volume of visceral adipose tissue in the body, the visceral adiposity index (VAI) determined through them directly increases the risk of infection and death, a condition characterized by the hormonal activity of adipose tissue [2,5,18,22]. Therefore, comparative estimation of fat tissue size and hormonal activity in the body with specificity, anthropometric, and metabolic indicators of the course of obesity phenotypes is important in preventing various cardiometabolic complications that can occur as a result of obesity.The purpose of the study is to assess the specificity of clinical-metabolic and hormonal indicators in women of Uzbek nationality, in which healthy and metabolically complicated obesity is detected.
2. Research Materials and Methods
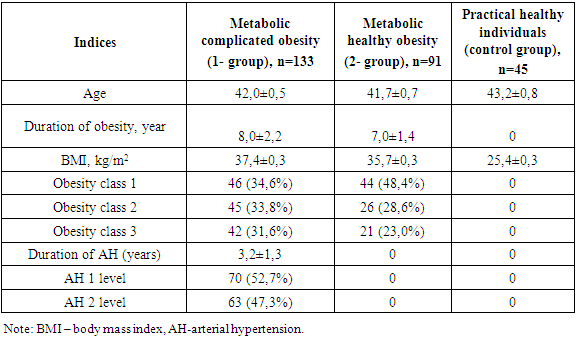
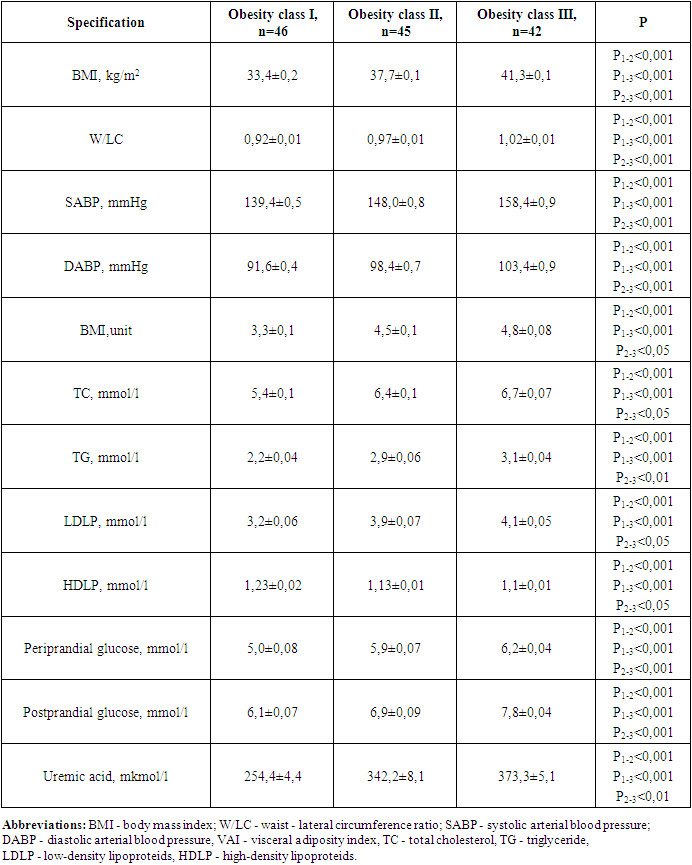
In 2019-2022, 224 women of Uzbek nationality who were diagnosed with obesity were involved in the study, and were registered in Tashkent city family polyclinics. They met all the criteria developed and agreed to participate in the study.The study was carried out by simple and randomized selection. The following criteria were met in the study's involvement: women aged 15-49 years, BMI ≥ 30 kg/m2, VAI > 80 cm, arterial Hypertension Stage I-II, insulin resistance, and lack of clinical signs of kidney damage (kidney disease in Anamnesis, pathological changes in renal vessels and parenchyma in ultrasound, changes in urine deposition and no proteinuria, and calculated renal pelvis filtration rate ≥ 60 ml/min/1.73 m2), and written consent was given to participate in the study. The diagnosis of Arterial hypertension (AH) was diagnosed on the basis of the criteria of the European Society of AH (2018) and the Russian Medical Society on AH (2019). The office determined if arterial blood pressure values (ABP) ≥ 140/90 mmHg the diagnosis of AH would be confirmed. Initially, anthropometric indicators of women (BMI, WC, VAI, W/L) were determined (WHO, 2016). Also, ABP patients were recorded in medical documents, and in case of suspicion, daily monitoring of ABP (Schillir BR-102 plus, Switzerland) was carried out. Observed women were classified into 2 groups according to the above examinations and metabolic syndrome criteria (WHO, 2016; International Diabetic Federation, 2009), with 133 MCO-identified women with an average age of 42.0±0.5; Group 2 was made up of 91 MHO-identified women with an average age of 41.7±0.7.The control group consisted of 45 healthy volunteer individuals (females, average age 43.2±0.8, BMI<30 kg/m2, waist circumference less than 80 cm). While BMI was 37.4±0.3 in group 1, 35.7±0.3 kg/m2 in group 2 (р <0.001), obesity class I was 34.6% (46 individuals) in group 1, 48.4% (44 individuals) in group 2, its II class was 33.8% (45 individuals) in group 1, 28.6% (26 individuals) in Group 2 (p<0.01), and obesity class III was 31.6% (p<0.01) in group 1 (42), in group 2, 23.0% (21) (p < 0.001) were recorded in women. I degree of AH were found in 52.7% (70 individuals) of group 1 and II degree of AH were found in 47.3% (63 individuals), with AH duration averaging 3.2±1.3 years. The description of the women involved in the study is given in Table 1.Table 1. Description of the women involved in the study
 |
| |
|
In the groups involved in the study, a comparative assessment of the total and biochemical blood count, coagulogram, lipid spectrum, and serum uric acid content was carried out. Also, serum leptin levels were determined using immunoferment analysis in the case where "DBC human leptin, ELISA" (Canada) reagents were used, and its reference (control group) index was 11.9 [1.8; 17.8] ng/ml. Serum insulin levels were determined by an immunoferment method using "ELISA Monobind Inc" (Germany) reagents. Its reference factor was 12.02 [8.0; 15.0] mkME/ml. Enzyme immunoassays were carried out using the stat Fax 2100 device (USA) in the laboratory of enzyme immunoassay of the Department of Sanitary and Epidemiological Surveillance of the main medical administration at the administration of the President of Uzbekistan.After 12 hours of fasting, a glucose tolerance test was performed in women with high serum glucose of 5.6 mmol/l. Before and after testing, venous serum glucose levels were detected, causing morning glycemia disorders (morning glucose serum levels ≥ 6.1 - < 7.0 and <7.8 mmol/l 2 hours after test) and impaired glucose tolerance ( morning serum glucose levels < 7.0 and ≥7.8 - <11.1 mmol/l 2 hours after test), and their combined occurrence differed.Insulin resistance (IR) condition determined by Matthews D. R. et al. (1985) using the HOMA-IR (Homeostasis Model Assessment of Insulin Resistance) method proposed by the following formula:HOMA-IR = morning serum glucose (mmol/l) x morning insulin (mkU /ml) / 22.5.In this, the HOMA-IR indicator was evaluated as an ir state with ≥ 2.77. The higher this indicator, the lower the insulin sensitivity of insulin-dependent cells as well as the absorption of glucose by tissues.The visceral adiposity index (VAI) was determined by the following formula:VAI = WC/(36.58+(1.89×BMI)) × (TG/0.81) × (1.52/HDLP), where, WC - waist circumference, BMI - body mass index, TG - triglycerides, HDLP - high-density lipoproteins [12]. The proper distribution of adipose tissue, BMI, TG, and the VAI factor in the HDLP regulatory control group was 1.01.In the statistical processing of the data obtained in the study, a packaged MS Excel (2010) computer program. The average arithmetic and standard deviations (M±m) of the indicators presented in all tables were calculated. The reliability of differences between groups was determined by applying the Student criteria to odd and even differences. Correlation analysis was conducted by applying the Pearson correlation coefficient and determining its significance based on reliability tables.
3. Results and Discussion
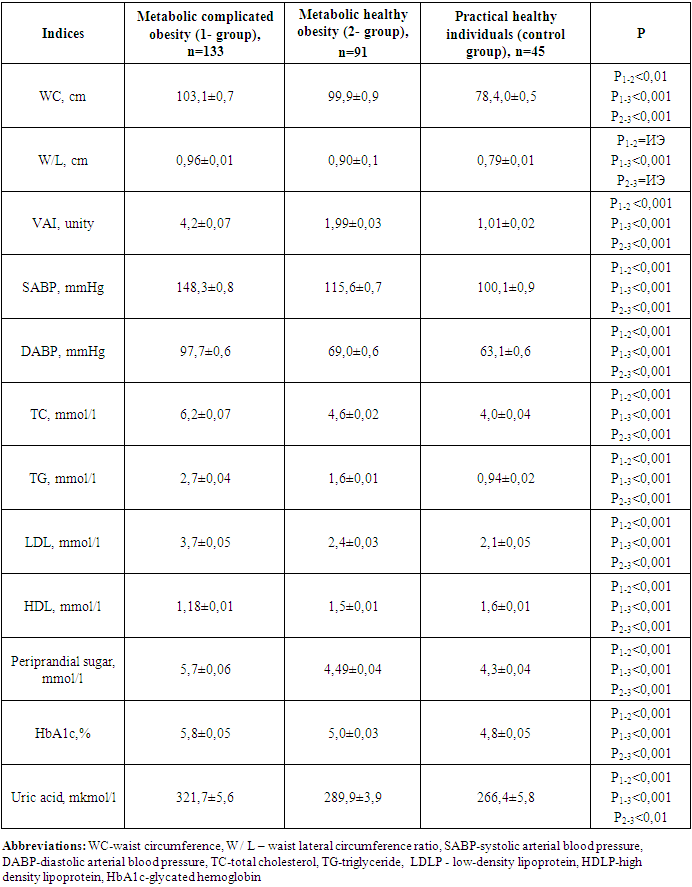
When anthropometric, hemodynamic, and metabolic indicators were analyzed in the groups involved in the study, the following were found (Table 2).Table 2. Comparative description of anthropometric and hemodynamic indicators in groups involved in the study
 |
| |
|
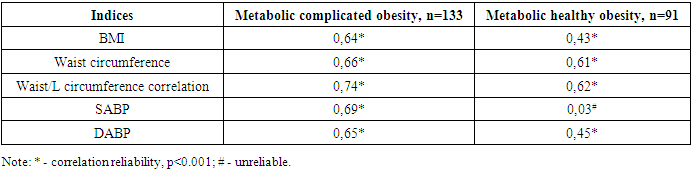
The clinical recommendation of "Metabolic syndrome", approved by the World Health Organization and the Russian National Society of Cardiologists, found that the presence of WC 80 cm, W/L above 0.85 in women is one of the criteria for metabolic syndrome [4], in the 1st group involved in our study WC increased from the normative limit by 28.9%, W/L 12,9%, in 2 groups, it turned out that these indicators increased by 24.8 and 5.8%, respectively.Group 1 contains WV SABP (r=0.64; p<0.001), DABP (r=0.55; p<0.01), morning glucose (r=0.77; p<0.001), glycated hemoglobin (r=0.62; p<0.001), TC (r=0.79; p<0.001), TG (r=0.79; p<0.001), positive with LDLP (r=0.68; p<0.001) and uric acid (R=0.71; p<0.001), negative with HDLP (r=-0.57; p<0.01), DABP in group 2 (r=0.26; p<0.05), TC (r=0.35; p<0.05), TG (R=0.34; p<0.05), LDLP a positive, HDLP (r=-0.48; p<0.01) was observed with negative correlation relationship (r=0.42; p<0.01).In group 1 all metabolic indicators in relation to 2- and control group indicators, including TC 1.3 (4.6 vs. 6.2 mmol/l) and 1.6 (4.0 vs. 6.2 mmol/l) respectively, TG 1.7 (1.6 vs. 2.7 mmol/l) and 2.9 (0.94 vs. 2.7 mmol/l), LDLP 1.5 (2.4 vs. 3.7 mmol/l) and 1.8 (2.1 vs. 3.7 mmol/l), periprandial and postprandial glucose 1.27 (4.49 vs. 5.7 mmol/l) and 1.32 (4.3 vs. 5.7 mmol/l) and 1.3 (5.5 vs. 6.9 mmol/l) as well as 1.4 (4.9 vs. 6.9 mmol/l), HbA1c 1.16 and 1.21 (5.0 vs. 4.8 vs. 5.8%), respectively, uric acid was noted to be convincingly high at 1.1 and 1.2 (289.9 and 266.4 vs. 321.7 mmol/l), respectively (p<0.001).It was also revealed that in this group, the amount of HDLP with an antiaterogenic effect decreased by 1.3 and 1.4 times, respectively, compared to this indicator of the 2nd and control group (p<0.001).In the MHO group, serum lipids, periprandial and postprandial glucose levels and HbA1c, as well as uric acid levels were noted, although they were also higher than these indicators in the control group.In a healthy organism, the correct distribution of fat and the normative indicators of high density lipoproteins (HDLP) and triglyceride (TG) in BMI and serum were taken as equal to VAI 1 [12]. Increasing this indicator means that the risk of cardiometabolic complications increases. In both groups involved in our study, the VAI reference was higher than the indicator and this indicator was equal to 4.2±0.07 in group 14,2±0,07 in group 21,99±0,03. When the correlation of VAI with anthropometric and hemodynamic indicators in groups was hypothesized, the following were found (Table 3).Table 3. Correlation of visceral adiposity index in groups with anthropometric indicators and arterial blood pressure
 |
| |
|
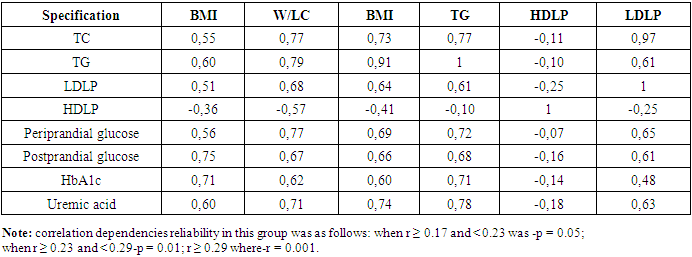
VAI in the MCO group, a strong positive correlation relationship was noted with BMI (r=0.64; p<0.001), waist circumference (r=0.66; p<0.001), Waist/LC ratio (r=0.74; p<0.001), SABP, and DABP (r=0.69 and r=0.65; p<0.001, respectively). It was found to have a convincing positive correlation relationship with BMI (r=0.43; p<0.001), waist circumference (R=0.61; p<0.001) waist/lateral circumference ratio (r=0.62; p<0.001), DABP (r=0.45; p<0.001) in the MHO group. The BMI has consistently exceeded the VAI in both involved in the study groups. The increase in VAI was characterized by increased cardiometabolic risk factors, specifically W/LC and arterial blood pressure, and this process was evident in the MCO group.When correlational correlations of metabolic indicators were studied in the MCO group, the following were found (Table 4).Table 4. Correlation relationship of metabolic indicators in the group of metabolically complicated obesity
 |
| |
|
In the MCO group, BMI, W/LC, and VAI were noted to have a convincing positive correlation with serum total cholesterol, triglyceride, low-density lipoproteins, and a convincing negative correlation with high-density lipoproteins (p=0.001). It was also observed that the increase in these indicators coincides with a violation of the metabolism of peri - and postprandial glucose, glycated hemoglobin and uric acid. When correlation correlations between VAI and serum TG levels with metabolic indicators in the MHO group were hypothesized, the following were found (table 5).Table 5. Correlation relationship of metabolic indicators in the metabolic healthy obesity group, r
 |
| |
|
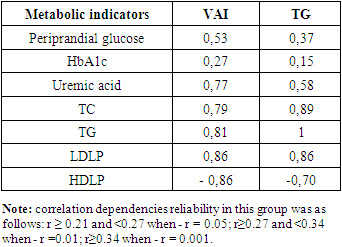
In the MHO group, a convincing negative correlation of VAI and serum TG levels with periprandial sugar, glycirated hemoglobin, uric acid, total cholesterol, and low-density lipoprotein indicators with convincing positive, high-density lipoproteins was noted. When it was hypothesized that metabolic disorders were associated with obesity rates in the MCO group, the following were found (Table 6).Table 6. Association of metabolic disorders with obesity rates in the group of metabolically complicated obesity
 |
| |
|
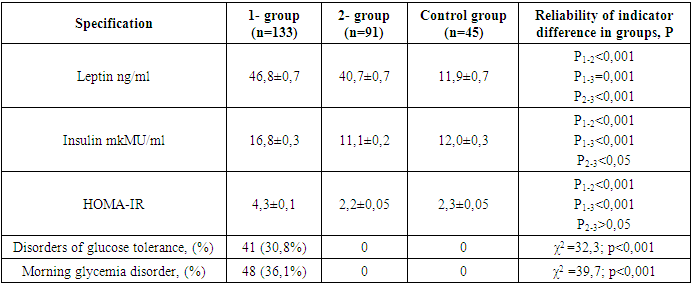
In the MCO group, it became known that obesity levels are consistent with metabolic disorders. In particular, the waist/visceral adiposity index, SABP and DABP rates were found to be 5.4 and 10.8, 6.2 and 13.6, and 7.4 and 12.9% higher, respectively, compared to patients diagnosed with obesity levels I and II (r<0.001). In this group, BMI was noted to be 1.4 and 1.5 times higher than this indicator in levels I and II of obesity, consistent with dyslipidemia, one of the main risk factors for Atherosclerotic Genesis infection, i.e. increased serum TC, TG, LDLP, decreased amount of HDLP (r<0.001). An increase in BMI and VAI in obesity levels was characterized by an increase in serum periprandial and postprandial glucose levels, in particular increased morning glycemia and glucose tolerance disorder, as well as hyperuricemia. It is known that the occurrence of metabolic disorders in obesity is caused by increased synthesis of a number of biologically active substances [1,15,34]. Studies have found that there is a proper correlation between the volume of adipose tissue in the body and serum leptin levels [6,26]. The hormone Leptin is mainly developed by adipocytes in the subcutaneous and visceral adipose tissue, and its regulatory index is approved as < 27.6 ng/ml in women [16,25,32]. Quantitative indicators of serum leptin and insulin were found in groups, as well as the following when the HOMA-IR - IR index was compared (Table 7).Table 7. Comparative description of the hormonal activity of adipose tissue in groups
 |
| |
|
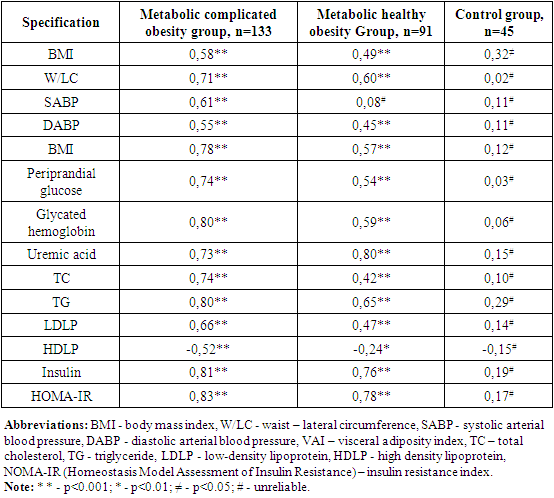
In the observed group 1 and 2, serum leptin levels were noted to be 3.9 and 3.4 times higher than this indicator of healthy women in the control group, respectively, with an increase of 69.6 and 47.5% from the accepted normative indicator (r=0.001), respectively. In the MCO group, morning insulin levels and HOMA-IR index were noted to be significantly higher than those of the MCO and control group (p<0.001). 41 (30.8%) of patients in the metabolically complicated obesity group were found to have glucose tolerance disorder (χ2 =32.3; r<0.001), and 48 (36.1%) had morning glycemia disorder (χ2 =39.7; r<0.001).When studying the correlation of serum leptin levels with clinical-metabolic and hormonal indicators in groups, the following were found (Table 8):Table 8. Correlation relationship of serum leptin levels in groups with clinical-metabolic indicators
 |
| |
|
In the MCO and MHO groups, serum leptin levels were observed to increase in tune with BMI and VAI. These proportional were manifested by increased serum uric acid levels, increased ABP, and increased IR by disrupting carbohydrate and lipid metabolism in the body p<0.001). When the correlation of the morning insulin serum state and IR with clinical–metabolic indicators was hypothesized, it was noted that these indicators were consistent with a violation of BMI, ABP, carbohydrate, and lipid metabolism in Groups 1 and 2. It has also been found that in these groups, the nahorgi insulin and IR state is inversely correlated with a decrease in the amount of HDLP that represents a weight level of lipid metabolism disorder in the body (p<0.001). In studies conducted, it has been argued that vsini correlates strongly with lipid profile and metabolic indicators of blood, hormonal activity of adipose tissue, as opposed to anthropometric indicators (BMI, WC, W/LC) [3,12].In patients involved in our study, the fact that VAI has a higher indicator in Group 1 compared to Group 2, the increase in BMI is consistent with a higher BMI indicator, their manageability with clinical-metabolic disorders, the fact that these processes are clearly manifested in the MHO group has once again confirmed the above data. It is known that the extratcellular matrix (EM) plays an important role in ensuring the balance of the processes of formation, morphogenesis, and perfecting of the architectonics of adipose tissue in MCO. It ensures the natural course of adipogenesis by providing free interaction of biologically active substances accumulated in it [21,23]. In the early stages of MHO, EM mediators control adipocyte adaptation to excess nutrients, eliminating the development of hypoxia as well as decreased insulin sensitivity. Increasing VAI and BMI leads to increased production of biologically active substances that activate these imbalances, adipocyte hypertrophy, and inflammatory processes [29,33]. In the 1st and 2nd group of observations, serum leptin levels are 3.9 and 3.4 times higher than this indicator of healthy women in the control group, respectively, which makes it an auto -, para-and endocrine property in violation of vascular, metabolic, and immune system homeostasis in the body. Based on the results obtained, in both phenotypes of obesity, an increase in the level of obesity, BMI, WC, W/LC, and VAI are consistent with a violation of carbohydrate and lipid metabolism in the body and uric acid metabolism. This proportion increases the level of cardiometabolic risk and corresponds with increased hormonal activity of adipose tissue. Also, although there are no clinical manifestations of metabolic disorders in the MHO group, the fact that certain clinical–metabolic and hormonal indicators in it are higher than the reference indicators implies the compensatory capabilities of the body as well as the subclinical course of the process and provides the basis for the fact that this group is considered a cardiovascular risk group.Therefore, the organization of periodic medical examinations among the population identified with obesity, in which dynamic monitoring of the above-mentioned clinical, metabolic and hormonal indicators is carried out, is important in the prevention of unpleasant cardiovascular diseases.
References
| [1] | Dedov I.I., Troshina E.A., Mazurina N.V. and others. The role of neurotransmitters in the regulation of energy homeostasis and the possibility of drug correction of its disorders in obesity. // Obesity and metabolism. – 2016. – Volume No. 13(1). – P. 9 – 15. |
| [2] | Kologrivova I.V., Vinnitskaya I.V., Koshelskaya O.A., Suslova T.E. Visceral obesity and cardiometabolic risk: features of hormonal and immune regulation // Obesity and metabolism. - 2017. - T.14. - No.3 - P.3 - 10. doi: 10.14341/OMET201733-10. |
| [3] | Kurbanov A.K. Cardiovascular diseases. - Tutorial. - People's publishing house. - Tashkent. – 2023. - 184 p. |
| [4] | Kytikova O.Yu., Antonyuk M.V., Kantur T.A., Novgorodtseva T.P., Denisenko Yu.K. Prevalence and biomarkers of metabolic syndrome // Obesity and metabolism. - 2021. - T. 18. - No. 3. - pp. 302-312. doi: https://doi.org/10.14341/omet12704. |
| [5] | Libis R.A., Isaeva E.N. The possibility of using the visceral obesity index in diagnosing metabolic syndrome and predicting the risk of its complications. // Russian Journal of Cardiology. – 2014. – T. (9). – R. 48 - 53. doi: 10.15829/1560-4071-2014-9-48-53. |
| [6] | Matosyan K.A., Oranskaya A.N., Gurevich K.G., Mkrtumyan A.M., Evdokimov A.I. Biochemical markers of obesity in patients 18-25 years old // Cardiovascular therapy and prevention. – 2017. – T.16. No. 5. – pp. 34 - 39. doi: 10.15829/1728-8800-2017-5-34-39. |
| [7] | Mychka V.B., Vertkin A.L. et al. Expert consensus on an interdisciplinary approach to the management, diagnosis, and treatment of patients with metabolic syndrome // Cardiovascular Therapy and Prevention. – 2013. - Volume 12 (6). – P. 41-81. |
| [8] | Oganov R.G., Simanenkov V.I., Bakulin I.G. and others. Comorbid pathology in clinical practice. Algorithms for diagnosis and treatment // Cardiovascular therapy and prevention. - 2019. - T. 18. - No. 1. - P. 5-66. https://doi.org/10.15829/1728-8800-2019-1-5-66. |
| [9] | Ostrovskaya E.V., Romantsova T.I., Gerasimov A.N., Novoselova T.E. Prevalence of metabolically healthy obesity according to a sample of the Moscow region // Obesity and Metabolism. - 2017. - T.14. No. 4. - P.51-56. doi: 10.14341/OMET2017451-56. |
| [10] | Al Suwaidi J. Is there an increased cardiovascular risk in metabolically healthy obese individuals? Lessons from the HUNT (Nord-Trøndelag Health) study // Glob Cardiol Sci Pract. – 2014. - № 2014 (2). - Р. 44 - 7. |
| [11] | Alam I., Ng T.P., Larbi A. Does Inflammation Determine Whether Obesity Is Metabolically Healthy or Unhealthy? The Aging Perspective // Mediators Inflamm. – 2012. – P. 1 - 14. doi: 10.1155/2012/456456. |
| [12] | Amato M.C., Pizzolanti G., Torregrossa V. et al. Visceral adiposity index (VAI) is predictive of an altered adipokine profile in patients with type 2 diabetes. // PLoS One. – 2014. Vol. 9(3). - e91969. doi:10.1371/journal.pone.0091969. |
| [13] | Boutens L., Stienstra R. Adipose tissue macrophages: going off track during obesity. // Diabetologia. – 2016. – Vol. 59 (5). – P. 879 - 894. doi: https://doi.org/10.1007/s00125-016-3904-9. |
| [14] | Brown R.E., Kuk J.L. Consequences of obesity and weight loss: a devil’s advocate position // Obes Rev. – 2015. – Vol. 16(1). – P. 77–87. |
| [15] | Bugescu R., Brown J. A., Mayer T. et al. Loss of Leprb Expression in Lateral Hypothalamic Neurotensin Neurons Disrupts Adaptive Behavioral Responses to Leptin and Ghrelin. Hormone and Nutrient Regulation of Body Weight: Basic Mechanisms. // Endocrine Society. – 2014. – Vol. 35 (3). |
| [16] | Chen X., Van Sinderen M.L., Steinberg G.R. et al. Effects of Estrogens on Adipokines and Glucose Homeostasis in Female Aromatase Knockout Mice // PLoS One. – 2015. – Vol. 10(8). - e0136143. doi:10.1371/journal.pone.0136143. |
| [17] | Chrysant S.G., Chrysant G.S. The single use of body mass index for the obesity paradox is misleading and should be used in conjunction with other obesity indices. // Postgraduate Medicine. – 2019. - Vol.131(2). – Р. 96 - 102. doi: 10. 1080 / 00325481.2019.1568019. |
| [18] | Coutinho T., Goel K., Corrêa de Sá D. et al. Central Obesity and Survival in Subjects With Coronary Artery Disease // J Am Coll Cardiol. – 2011. – Vol. 57 (19). – P.1877 - 1886. doi:10.1016/j.jacc.2010.11.058. |
| [19] | Eckel N., Li Y., Kuxhaus O., Stefan N., Hu F.B., Schulze M.B. Transition from metabolic healthy to unhealthy phenotypes and association with cardiovascular disease risk across BMI categories in 90 257 women (the Nurses’ Health Study): 30-year follow-up from a prospective cohort study // Lancet Diabetes Endocrinol. – 2018. – Vol. 6. – P. 714 – 724. |
| [20] | Flegal K.M., Kit B.K., Orpana H. et al. Association of all-cause mortality with overweight and obesity using standard body mass index categories: a systematic review and meta-analysis. // JAMA. – 2013. – Vol. 309 (1). – Р. 71 - 82. doi:10.1001/jama.2012.113905. |
| [21] | Kahn C.R., Wang G., Lee K.Y. Altered adipose tissue and adipocyte function in the pathogenesis of metabolic syndrome. // J Clin Invest. – 2019. – Vol. 129 (10). – P. 3990 - 4000. doi: https://doi.org/10.1172/jci129187. |
| [22] | Kouli G.M., Panagiotakos D.B., Kyrou I. et al. Visceral adiposity index and 10-year Cardiovascular Disease incidence: the ATTICA Study. // Nutrition, Metabolism and Cardiovascular Diseases. – 2017. - Vol. 27 (10). doi: 10.1016/j.numecd. 2017.06.015. |
| [23] | Liu R., Nikolajczyk B.S. Tissue Immune Cells Fuel Obesity-Associated Inflammation in Adipose Tissue and Beyond. // Front Immunol. – 2019. – Vol. 10. – P. 1587. doi: https: //doi. org/ 10. 3389 / fimmu. 2019. 01587. |
| [24] | Luo D., Liu F., Li X. et al. Comparison of the effect of ‘metabolically healthy but obese’ and ‘metabolically abnormal but not obese’ phenotypes on development of diabetes and cardiovascular disease in Chinese // Endocrine. – 2014. № 9. – Р. 23 - 33. |
| [25] | Marino J.S., Xu Y., Hill J.W. Central insulin and leptin - mediated autonomic control of glucose homeostasis. // Trends Endocrinol Metab. - 2011.-Vol. 37 (9). - P. 2053 - 2079. doi:https://doi.org/10.1016/j.tem.2011.03.001. |
| [26] | Mathew H., Castracane V.D., Mantzoros C. Adipose tissue and reproductive health. // Metabolism. - 2018. - Vol. 86. - P. 18 - 32. |
| [27] | Moore J.B., Boesch C. Getting energy balance right in an obesogenic world // Proc Nutr Soc. – 2019. – Vol. 78 (3). – P. 259 - 261. doi: https://doi.Org/10.1017/S0029665118002720. |
| [28] | Ng M., Fleming T., Robinson M. et al. Global, regional, and national prevalence of overweight and obesity in children and adults during 1980–2013: a systematic analysis for the Global Burden of Disease Study 2013 // The Lancet. – 2014. – Vol. 384 (9945). – P. 766 - 781. doi: 10.1016/s0140-6736(14)60460-8. |
| [29] | Rey-López J.P., de Rezende L.F., Pastor-Valero M., Tess B.H. The prevalence of metabolically healthy obesity: a systematic review and critical evaluation of the definitions used // Obes Rev. – 2014. – Vol. 15(10). – P. 781-790. |
| [30] | Rhee E.J., Lee M.K., Kim J.D. et al. Metabolic health is a more important determinant for diabetes development than simple obesity: a 4-year retrospective longitudinal study // PLoS One. – 2014. – Vol. 9 (5). – P. e98369. |
| [31] | Roberson L.L., Aneni E.C., Maziak W. et al. Beyond BMI: The “Metabolically healthy obese” phenotype & its association with clinical/subclinical cardiovascular disease and all-cause mortality - a systematic review // BMC Public Health. – 2014. - №14. – Р.14. |
| [32] | Tao Y., Juan L.I., Wei-Gang Z. et al. Effects of Estrogen on Insulin Sensitivity and Adipokines in Mice // Zhongguo Yi Xue Ke Xue Yuan Xue Bao. – 2015. – Vol. 37(3). – P. 269 - 273. doi:10.3881/j.issn.1000-503X.2015.03.004. |
| [33] | Van Vliet - Ostaptchouk J.V., Nuotio M.L., Slagter S.N. et al. The prevalence of metabolic syndrome and metabolically healthy obesity in Europe: a collaborative analysis of ten large cohort studies // BMC Endo Dis. – 2014. – Vol. 14(1). doi: 10.1186/1472-6823-14-9. |
| [34] | Virdis A., Lerman L., Regoli F. et al. Human ghrelin: a gastric hormone with cardiovascular properties. // Current Pharmaceutical Design. - 2016. - Vol. 22 (1). - P. 52 - 58. DOI: 10.2174 /1381612822666151119144458. |
| [35] | World Health Organization Media Centre. Obesity and overweight. Fact sheet no 311. – Geneva. - World Health Organization. - 2013. |

 Abstract
 Reference
 Full-Text PDF
 Full-text HTML