Yusupova Nargiza Abdikodirovna, Oripov Firdavs Suratovich
Samarkand State Medical University, Samarkand, Uzbekistan
Copyright © 2023 The Author(s). Published by Scientific & Academic Publishing.
This work is licensed under the Creative Commons Attribution International License (CC BY).
http://creativecommons.org/licenses/by/4.0/

Abstract
In recent years, energy drinks have begun to progressively conquer not only the market of European and Western countries, but they have also conquered the market of Asian countries. For this reason, WHO believes that the risk of such mass consumption of energy drinks among adolescents and young people can lead to serious public health disorders and negative health complications in the future. Moreover, this condition remains largely ignored among scientists and the public. Analysis of the literature data with a high degree of persuasiveness indicates that excessive consumption of energy drinks can have an extremely adverse effect on human health and can lead to the development of multiple organ failure, with damage, first of all, to the cardiovascular, central nervous, endocrine systems, as well as the digestive and excretory systems. To substantiate indications and contraindications, recommendations for the use (volumes and dosages) of energy drinks.
Keywords:
Energy drinks, Chronic atrophic gastritis, Pepsinogen 1, Oncomarker
Cite this paper: Yusupova Nargiza Abdikodirovna, Oripov Firdavs Suratovich, Serological Diagnosis of Morpho-Functional Changes in the Stomach Wall under the Influence of Energy Drinks in the Experimental Approach, American Journal of Medicine and Medical Sciences, Vol. 13 No. 10, 2023, pp. 1513-1520. doi: 10.5923/j.ajmms.20231310.31.
1. Introduction
It is difficult to diagnose at the nosological level because the clinical manifestations of various diseases of the gastrointestinal tract are invisible with general symptoms. As diseases of the gastrointestinal tract do not have complex symptoms characteristic of a separate clinical variant, in the diagnosis, first of all, it is necessary to exclude organic diseases with similar symptoms. This requires specific laboratory and instrumental examinations within the approved algorithm for accurate diagnosis. Invasive endoscopy has become more effective and easier non-invasive methods for screening various diseases of the stomach, including peptic ulcers of the stomach and duodenum, gastroesophageal reflux, atrophic gastritis and other diseases of the stomach. A number of studies were conducted on replacement with [10, P.1198].As a result of these studies, it was found that the detection of PGI, PGII in the blood serum can be used as a biological marker of these diseases, and their concentration in the blood serum sheds light on the morpho-functional state of the stomach wall, and in the future, when changes are detected, it is confirmed by the histological examination method [6, P. 30].Pepsinogens are inactive protein precursors of pepsin, which are converted into catalytically active pepsin under the influence of hydrochloric acid in the stomach. In healthy people, the amount of PG1 normally produced is three times higher than that of PG2. It is known that the gastric mucosa, regardless of the mechanism of its damage, can regenerate and restore its original structure. At the same time, in progressive inflammation of the gastric mucosa, the damaged glands lose their ability to regenerate, and instead of the mucous membrane, metaplastic epithelial cells appear, and atrophic gastritis may develop [11, P.205; 12, P.199].Chronic atrophic gastritis is a disease classified as a precancerous condition, which significantly increases the risk of gastric cancer [5, P.26]. The greatest danger in the development of stomach cancer is atrophic gastritis, which is accompanied by a decrease in the acid-producing function of the stomach (cancer development increases to 13%).Oncological diseases of the gastrointestinal tract take the leading place among all diseases. In the histological examination of the biopsy material of patients with stomach cancer, 82.5% of the cases revealed adenocarcinoma of various degrees, and 17.5% of the cases revealed ring cell carcinoma. The article presents the study and practical use of the oncomarker Ca 74-2, which allows for the diagnosis of oncological disease at an early stage and, of course, more successful treatment.CA 74-2 is a glycoprotein that is located on the surface of the epithelium of the digestive tract during fetal development. In adults, it is detected in stomach cancer and colorectal cancer, and other malignant tumors. At the same time, its increase in 6.7% of patients was also determined in the presence of good-quality tumors [3].In gastric cancer, the sensitivity of this marker is 40-46%, and the higher the level of the tumor marker, the higher the risk of malignancy, that is, the change in the amount of the oncomarker is related to the stage of the tumor process. After the cancer is radically removed, the CA 74-2 indicator returns to normal within 3-4 weeks, which is considered a sign of successful treatment. Regarding metastases, this oncomarker is more sensitive than CEA or CA 19-9 in gastric cancer. Detection of CA 74-2 in patients diagnosed with gastric carcinoma allows assessment of survival. The higher the tumor marker, the higher the stage of the disease [4, P.63].A proteolytic enzyme that breaks down food proteins into peptides - pepsin (pepsinase) was discovered by J. Schwann in 1836 and found in the stomach of all vertebrates, except for some types of fish; it is mainly secreted by adenomorph cells of the gastric fundus glands and pyloric glands. Interest in the study of pepsin and especially its precursors has increased in the last decade. In particular, the wide implementation of their detection methods helped to non-invasively detect the precancerous state of the stomach and thereby prevent gastric cancer (GC). Chronic atrophic gastritis (SAG) is one of the underlying diseases that cause gastric cancer. Detailed studies by P. Correa showed that the formation of gastric cancer naturally has a number of consecutive morphological stages (called the Correa cascade): Superficial gastritis - atrophic gastritis - metaplasia of the type of small intestine - no intestinal type metaplasia - progressive dysplasia and cancer in situ, ending with invasive cancer. This process usually takes 20-30 years.The purpose of the scientific work: to evaluate the morpho-functional changes in the stomach of 24-week-old (6-month-old) white rats under the influence of energy drinks using immunological laboratory methods.
2. Materials and Methods
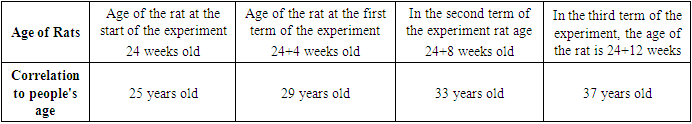
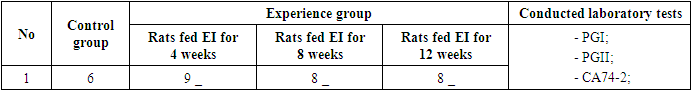
The study was conducted on 31 six-month-old male white rats with body weight in the range of 200 ± 20 g. The rats included in the study were divided into a control group and an experimental group. The control group included 6 male albino rats of six months of age who did not drink EI. 25 six- month-old albino male rats were taken into the experimental group. In the experimental group, the duration of energy drink intake was 3 different: 9 rats consumed energy drink for 4 weeks, 8 rats for 8 weeks, and another 8 rats for 12 weeks (table 1).Table 1. Correlation of the age of experimental animals with the age of humans
 |
| |
|
There is a long-standing need to extrapolate the results of experimental studies conducted on animals to humans. Common biological and medical experiments are not conducted directly on humans. Many studies are conducted on small mammals. Many such animals are laboratory white rats, because they are kept in comfortable conditions. Rats have a short gestation period and rapid reproduction, their average lifespan is 2 years. The following correlation was developed in the research conducted on the creation of proportional age ratios between humans and white laboratory rats.When conducting a comparative analysis of proportional age relationships in postnatal ontogeny, the coefficient was adopted. A coefficient of 1.7 was adopted based on the fact that the age of a rat of 120 days corresponds to the period of late adulthood of a person, i.e. 17 (204 months). It is calculated according to the formula given below. X (age of people in months) = 1.7 x Age of Rats (in days).So, the ratio of human life in months to rat life days is equal to 1.7 (K=1.7). Thus, according to the calculations of the compatibility between the biological age of a person and white laboratory rats, 1 day of a rat corresponds to 52 days of a person's life.The correlation between the age of the animals taken in our study and the human age was as follows: the correlation between the age of 12-week-old (90-day) rats and the age of humans was 25 years. At the same time, taking into account that the age of the rats in the experiment was changed for 4, 8, 12 weeks, the age categories in the study were covered in a wider range. That is, 6-month-old (24-year-old) animals grew up by 4, 8, 12 weeks until the end of the experiment, and the age group studied in the study corresponded to the range of 25-37 years old (table 1). was conducted based on the rules established by the research ethics committee. Rats were kept in special plastic cages with controlled temperature (t = 24 ± 1 °C) and relative humidity of 70%. 12 -hour light-dark cycles were provided in the laboratory. At the same time, in the experiment, two groups of animals had free access to water and special food for rats (rodent food, pellets).Table 2. Distribution of experimental animals in groups
 |
| |
|
In this study, the experimental animals were given "Gorilla", a widely consumed energy drink available on the market of Uzbekistan, and the functional changes in the stomach were evaluated using immunological methods. In the experiment, energy drink (EI) "Gorilla" was injected intragastrically through a plastic tube for 4, 8, 12 weeks.Each rat received EI at a daily dose of 10 mg/kg body weight. This dose was produced based on the Paget and Barnes conversion table for rats, and was calculated as equivalent to the human consumption dose [8, P. 368]. "Gorilla" drink contains caffeine, taurine, glucuronolactone, sugar and other carbohydrates, food dyes, flavorings, vitamins, inositol, niacin, herbal supplements and other ingredients. The animals in the control group were injected with 7.5 ml of physiological solution by gavage once a day for 4,8,12 weeks, and the rats in the experimental group were given 10, Diluted to 0 ml. On the last day of the experiment, the animals were not given food for one night, then at 8 am they were anesthetized by light inhalation of ether, and blood samples were taken directly from the heart for laboratory tests. Then the head was cut off, bled, and the internal organs were opened.Enzyme Immunoassay (IFA): Blood samples were left at room temperature for 30 minutes, then centrifuged at 4000 rpm for 15 minutes. After extraction, serum samples were stored in a refrigerator at -20°C until IFA analysis. Pepsinogen 1 and 2, oncomarker CA74-2 immunological tests were carried out using special immunoenzyme analysis (IFA) kits manufactured in Russia. Laboratory studies were performed at the end stages of each experimental period.Basic description of reagent kits: "Pepsinogen 1" IFA – BEST (Russia); The measured concentration range is 0–200 μg/l. Serum sample volume for analysis is 10 µl. The analysis is 1 stage. The total incubation time is 1 hour and 15 minutes."Pepsinogen 2" IFA - BEST (Russia); The measured concentration range is 0–50 μg/l. Serum sample volume for analysis is 10 µl. The analysis is 1 stage. The total incubation time is 1 hour and 15 minutes."CA 74-2" IFA-Khema (Russia) test set. The measured concentration range is 0-200 IU/ml. Serum sample volume for analysis is 50 µl. The analysis is 1 stage. The total incubation time is 1 hour and 15 minutes. The shelf life of these reagents is 12 months.Reagent kits PG1 and PG2 contain ready-to-use samples of specific concentration reagents for calibration and control, respectively, for CA74-2.
3. Results and Discussion
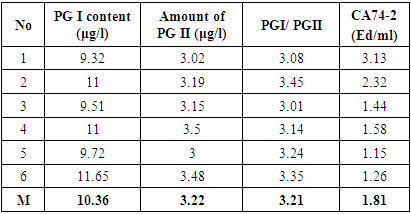
Pepsinogens are proenzymes of pepsin, which provide the initial and important step of the digestive cascade, in the process of converting proteins into amino acids. At the same time, the level of pepsinogens in the blood is a reliable diagnostic indicator of the morphological and functional state of the gastric mucosa, which allows non-invasive biopsy. The pepsinogen concentration indicators, which vary in a wide range - from minimum to maximum values, to a large extent allow assessing the risk of developing not only stomach diseases, but also various diseases associated with reflux esophagitis, duodenal ulcer. Decreased level of pepsinogen I and II is considered as one of the risk factors for atrophic gastritis and gastric cancer. Determining the level of unequivocal pepsinogens allows the widespread introduction of non-invasive screening in various diseases of the stomach.Epsinogens differ in molecular weight, amino acid sequence, physical conformation of the molecule, antigenic determinants, and, accordingly, biochemical and immunological properties. Currently, several types of PG have been isolated using the gel electrophoresis method. Isoenzymes 1-5 are identified in the PGI group, and 6 and 7 isozymes are identified for the PGII group. PGI is produced by the principal cells of the gastric fundus and gastric body glands, and PGII is produced by the neck cells of the fundal part, the cardiac and pyloric part, and the glands in the proximal part of the duodenum. Changes in the amount of these two types of pepsinogen can give information about which part of the stomach is damaged. In healthy people, the amount of PGI secreted is 3 times or more than the level of PGII. Both PGs can be detected in human gastric juice and blood, only PGI is detected in urine.In a study of the South Korean population, N. Kim and H. Jung showed that the level of PGI was higher in men than in women, but no difference was found in PGII or their ratio. It has been shown that the level of PGI is not related to body mass index. Smoking was a significant sex-related variable in subjects, but no significant correlation was found between PG levels and smoking. These results suggest that the difference in PG in both sexes may be related to the effects of hormones. According to HP (Helicobacter pylori) infection and the age of the subjects, the level of PGI did not change significantly, but in HP-positive patients aged 30 to 70 years, the level of PGII increased by 2 times, which, in turn, affected the ratio of PGI and PGII. made a secret. In addition, PGII levels were found to increase significantly with age, regardless of HP infection. Thus, it can be assumed that gender and age affect the level of PGI, PGII and the ratio of PGI and PGII, which can be the basis for differentiated interpretation of normative indicators in the case of atrophic gastritis or gastric cancer. In rats, the normal level of PG I in blood serum is 9-11 µkg/l (ng/ml). Digestive and urinary organs, blood serum and urine contain different amounts of PG. A very large amount of PG is produced in the glandular part of the stomach. This shows that immunoreactive PG gets into the blood and urine from the glandular part of the stomach. The amount of PG in the blood serum of rats of different ages, sexes, and in some conditions of the body is different from normal. Serum PG levels are found to change during fasting; first rises, then falls. These data indicate that human serum PG levels depend on the time elapsed after a meal. It is noted that there is no significant difference in the average level of PG I in serum at different stages of pregnancy in humans. However, it was found that the level of PG in the blood serum in rats is slightly higher during pregnancy, and in addition, during lactation, the level of PG is much higher than during pregnancy. During pregnancy and lactation, there are no changes in the size of the mucous membrane and stomach. An increase in serum PG levels in this condition may be associated with increased gastric function. Based on these and subsequent studies, the results of the quantitative analysis of pepsinogen in the serum began to be used in the assessment of the condition of the gastric mucosa. Thus, a decrease in the level of PG in the blood serum indicates a decrease in its synthesis or a violation of its release by the chief cells of the glands in the stomach wall. The main reason for this may be related to the decrease in the number of cells as a result of the atrophic process caused by various reasons. However, a high level of PGI is often observed in diseases such as Zollinger-Ellison syndrome or duodenal ulcer (DU), and an increase in the mass of the gastric mucosa and, in parallel, an increase in the secretion of gastric juice. goes with [5, C.28].In our research, the concentration of PGI in the blood serum of rats in the range of 0-200 μg/l and PGII in the range of 0-50 μg/l was studied with the help of "Vector-Best" test kits. Laboratory testing of blood samples was carried out based on the instructions provided by the special manufacturer.The results of determining the concentration of PGI and PGII in rats in the control group were as follows. Concentrations of PGI and PGII in all samples were reference indicators (Table 3), no signs of pathological changes were observed in the animals of this group.Remember We are in a " healthy " population _ of pepsinogen low level quantity to be determined situations presence, stomach raki took diseases early in determining i.e screening in transfer _ this serological diagnosis methods wide current to reach requirement is enough of pepsinogen low values atrophic gastritis existence and As a result stomach cancer danger existence shows. _ _ A high level of pepsinogen indicates a hyperacid state in the stomach and a tendency to peptic ulcers [2, C.28]. To determine the function of the stomach, the animals in the experimental group drank EI for three different periods - 4 (acute effect), 8 (sub-acute effect), 12 weeks (chronic effect). the results of testing PGI and PGII in blood samples are as follows;Table 3. Amount of PG I, PG II, CA74-2 in control group rats
 |
| |
|
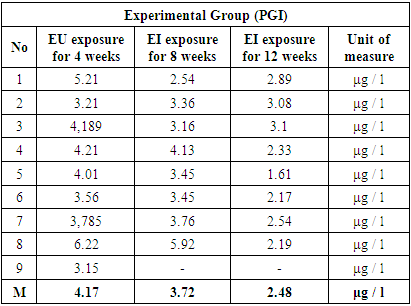
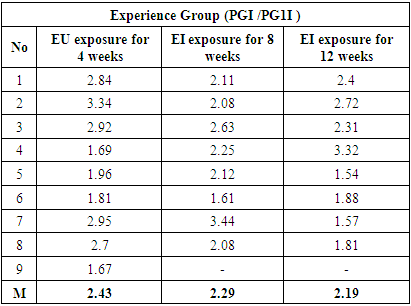
The average concentration of PGI in the blood serum of rats under the influence of energetics for 4 weeks is 4.17 μg/l (Table 4). During this period, the average concentration of PGII in rats that consumed EI was 1.79 μg/l (Table 4) and the average ratio of PGII/PGII was 2.43 (Table 4).Table 4. The amount of PGI in rats in the experimental group
 |
| |
|
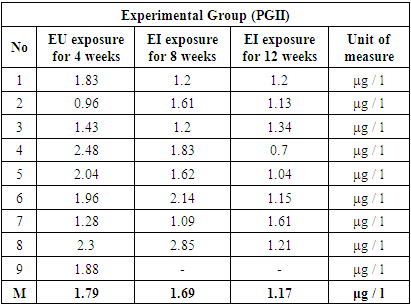
At the same time, we can see that these three indicators are dramatically reduced in rats under the chronic effect of EI: in the group receiving EI for 8 weeks, the serum PGI level was 3.72 μg/l (Table 4), PGII was 1.69 μg/l l and the PGI/PGII ratio was 2.29.As a result of chronic exposure to energy drinks for 12 weeks, the concentration of the above markers in blood serum in rats was as follows: PGI 2.48 μg/l (Table 3), PGII 1.17 μg/l (Table 4) and The PGI/PGII ratio decreased to 2.19 (Table 5).Table 5. Amount of PGII in experimental group rats
 |
| |
|
PGI is secreted by the main cells of the gastric fundus and body glands, and PGII by the epithelial cells of the fundus, cardiac and pyloric part and the proximal duodenum.When analyzing the production by the glands, it is possible to make a conclusion about which part of the OIT is damaged. So, 100% of the rats that consumed EI during the 12 weeks involved in the experiment showed a sharp decrease in PGII level in all parts of the stomach, that is, total damage, and in rats that received EI for 4 and 8 weeks, the PGII level (1.69 μg/l; 1.79 taking into account the high (μg/l) and the sharp decrease in the amount of PGI, it is possible to think that the mucous membrane of the stomach and body is more damaged in these rats. Based on the above data, we can see that serologically, the symptoms of atrophic gastritis have appeared, and the depth of the level of pathological changes due to the chronic effect of EI on the body.Table 6. Amount of PGII in experimental group rats
 |
| |
|
Criteria such as a decrease in the amount of pepsinogen I and II, and a PGI/PGII ratio of less than 3 have been adopted to diagnose atrophic gastritis [1, C.71]. In the observation rats, the level of pepsenogens was found to decrease during the period of EI consumption during 3 different periods of study. Such changes were especially evident in the chronic effect of energy drinks. It has been shown that the ratio of PG1 and PG2 concentrations in blood serum is less than 3, which serves as a diagnostic criterion confirming atrophic gastritis [2, C.26]. Determining the amount of PG1, PG2 in serum and the PG1/PG2 ratio allows to distinguish functional dyspepsia from serious organic gastropathologies (tumor, other disease), which requires additional investigations to confirm the final diagnosis [5, C.28].Chronic atrophic gastritis occurs in 90% of patients with gastric cancer. Therefore, at present, timely diagnosis of gastric atrophy is considered the first step in determining the risk of gastric cancer [5, C.30]. The difficulty of early diagnosis of atrophic gastritis is that in the early stages of the disease, this disease lasts a long time and develops asymptomatically or is characterized by a subclinical course. The main method of diagnosis of this disease is endoscopic examination, in which signs of atrophy in the gastric mucosa are found, and the diagnosis is confirmed by morphological analysis of biopsy samples taken during endoscopy [5, C.30].Detailed studies conducted by P. Correa showed that there are naturally a series of consecutive morphological stages in the formation of gastric cancer (called the Correa cascade): Superficial gastritis - atrophic gastritis - metaplasia of the type of small intestine - no Intestinal type metaplasia - progressive dysplasia and cancer, ending with invasive cancer. This process usually takes 20-30 years.It is clear from the obtained data that the changes occurring at different stages of EI exposure in the studied groups are not the same.PG1 and PG2 decreased in 100% of cases in rats that consumed EI, and the level of changes in PG1 was 2.54-5.92 μg/l, PG2 was 0.96-2.48 μg. /l was observed in the range. In studying the activity of laboratory indicators of gastric function, obvious changes were observed in rats that consumed EI for 8 and 12 weeks (Figures 1 and 2). PG1 and PG2 levels decreased in 100% blood samples of rats fed EI for eight weeks, PG1 concentration was 2.54-5.92 μg/l, and PG2 concentration was observed in the range of 1.09-2.85 μg/l, and 12 It was found that PG1 and PG2 decreased from the reference level in 100% of animals after exposure for a week, and their concentration in blood serum was as follows: PG1 1.61-3.1 μg/l, PG2 0.7-1.61 μg /l formed the range.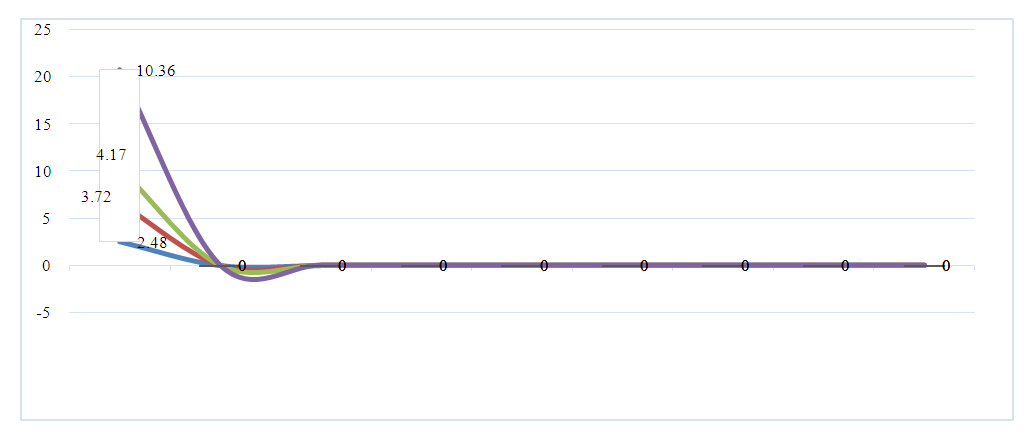 | Figure 1. Arithmetic mean of PGI in control and experimental group rats quantity (12 weeks, 8 weeks, 4 weeks, control group) |
After 12 weeks of EI consumption, PG1, PG2 in the blood serum of all rats decreased sharply (Figure 2).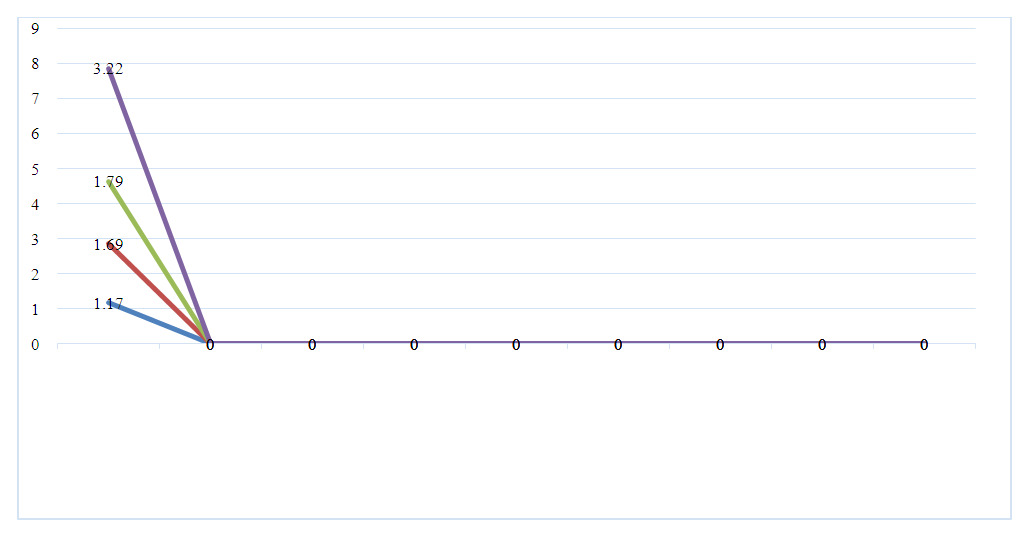 | Figure 2. Arithmetic mean of PGII in control and experimental group rats quantity (12 weeks, 8 weeks, 4 weeks, control group) |
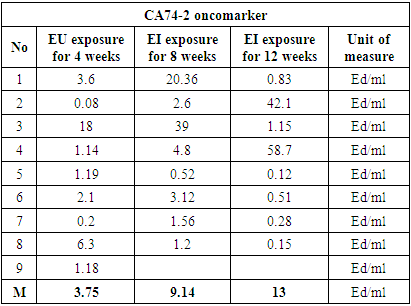
These data showed that foci changes may occur in the stomach wall, especially in the epithelium of the mucous layer, in animals that have consumed EI for a short period of time. Chronic exposure to energy drinks can cause irreversible organic changes in the stomach wall and mucous membrane. In the chronic effect gi Changes in the data indicate serological signs of atrophic gastritis. In atrophic gastritis, the secretion of hydrochloric acid is significantly reduced, and as a result, the concentration of PG1 in the serum decreases to values less than 1.84 μg/l [14, P.7176-7184].The use of quantitative analysis of PG1 for the diagnosis of atrophic gastritis, including its early asymptomatic stage, is now widespread in many developed countries. The sensitivity and specificity of this method exceeds 90%, and the level of reliability of the obtained results is more effective in the early stages of the disease than endoscopy and histological examinations [5, P.57]. Screening results allow distinguishing individuals at high risk of developing gastric cancer and patients at risk of duodenal ulcer.The level of PGI in the blood depends on the number of chief cells in the gastric mucosa. That is, a decrease in the concentration of PGI in the blood is an indicator of atrophic changes in the bottom and body of the stomach.There is a large body of data on the association between serum PG levels and gastrointestinal disease in humans. Serum PG levels reflect gastric function. High level of PG in blood serum is observed in gastric and duodenal ulcer diseases. In an experiment conducted on rats, when the amount of PG in the blood was checked in the wounds created experimentally in the bottom of the stomach, body and pyloric part or duodenal mucosa, the level of PG in the blood serum formed two different indicators in two types of peptic ulcer. A high level of PGI in blood serum was observed in an experimental wound in the fundus and body of the stomach. However, high levels of PGI were not observed in pyloric or duodenal ulcers.In addition, although the ulcer index was the same in cases of stress and ethanol, the level of pepsinogens in the serum was found to be different, and this is explained by the different damage to the mucosa [13, P.1020].CA74-2 is a non-specific marker of oncological diseases of the stomach, colon and ovaries. Usually, this component is absent in adults. Only poor-quality tumor cells produce this protein in large quantities and it is detected during laboratory analysis. CA74-2 antigen is a high molecular weight glycoprotein produced by cells of almost all tissues of the fetal body. In an adult, its production stops completely, so this antigen is usually not detected in the blood or its quantity is low. CA74-2 oncomarker is more sensitive than REA and Ca 19-9 in detecting malignant tumors of the stomach. Normal values of its concentration should not exceed 6.9 Ed/ml, an indicator above 7 Ed/ml is considered as an indication for additional investigations [3].In our study, it was found that the concentration of CA74-2 oncomarker in the blood samples of rats in the control groups did not exceed the normal range. In this case, the average concentration of the oncomarker was 1.08 Ed/ml (Table 3). This shows that this oncomarker is usually not detected in healthy rats or is normally present in a low amount. The average concentration of CA74-2 indicator in the blood serum of animals of the experimental group exposed to EI for 4 weeks was 3.75 Ed/ml, and in the blood serum of animals exposed to EI for 8 weeks the average concentration of the indicator was 9.14 Ed/ml, and the average concentration in the blood serum of animals exposed to EI for 12 weeks was 13/ml (Table 7). As can be seen from the data presented below, as a result of the influence of energy drinks for 4, 8, 12 weeks, the concentration of the oncomarker in 24-week-old rats exceeded the reference range in some animals. Especially these changes were clearly observed in the effect of energy drinks of the experimental group during 8 and 12 weeks. In these groups, we observed that the concentration of CA74-2 in the blood serum of animals was increased in 4 cases (12%) and the symptoms of oncological disease were absent.Table 7
 |
| |
|
Table 6 and Figure 3 show that in the main group, the level of oncomarker was in the range of 0.2-18 Ed/ml in rats that consumed EI for 4 weeks. In the blood samples of rats that consumed EI for 8 weeks, the level of oncomarker was in the range of 0.52-39 Ed/ml, and when exposed to EI for 12 weeks, the level of tumor marker was in the range of 2.1-24.15 Ed/ml organized in. | Figure 3. Arithmetic average amount of CA74-2 oncomarker in the control and experimental groups quantity (12 weeks, 8 weeks, 4 weeks, control group) |
4. Conclusions
1. Thus, determining the level of PG is a reliable indicator of the functional state of the stomach. It is considered appropriate if it is widely used in the detection of hyper- and hypoacid pathologies in the stomach. In recent years, it has been confirmed that the low level of pepsinogen concentration in the blood and their ratio can be a risk factor for the development of stomach cancer. These examinations are one of the indicators of pathological changes in the stomach wall and may reflect the pre-cancerous state of the gastric mucosa. At the same time, the study of the oncomarker CA74-2 in the blood serum allows to determine the presence of oncological diseases in the stomach. With the help of the above mentioned laboratory indicators, it helps to determine the morphofunctional state of the stomach wall under the influence of EI. This approach is a non-invasive method of detecting pre-cancerous diseases in the population, and is important in the screening process, which selects them for the next stages of examination.2. The evaluation of the tested parameters in the blood serum showed that the level of changes in the laboratory indicators determining the functional state of the stomach was higher as a result of the long-term effect of EI in animals compared to the short-term effect. This indicates that organic changes have occurred in the epithelium of the gastric mucosa due to the chronic effect of energy drinks.3. Thus, based on the obtained results, the developed methods can be evaluated as the most effective for assessing the functional and morphological state of the stomach.
References
| [1] | Belkovets A.V. hello O pyt non-invasive diagnosis of atrophic gastritis in experimental clinical practice. // Bulletin So Ramn, Volume 33, No. 4, 2013. P.71-76. |
| [2] | Belkovets A.V. hello Non-invasive diagnostic phenotype of gastritis v clinical practice: analysis pervoy tysyachi issledovanniy. // Experimental and clinical gastroenterology // vypusk 115 No. 3 2015. P.26-30. |
| [3] | Berdiyarova Sh.Sh., Yusupova N.A., Murtazaeva NK, Ibragimova NS "Clinical and laboratory features of chronic hematogenic osteomyelitis". // Central Asian Research Journal For Interdisciplinary Studies (CARJIS) Issue 1 | 2022. (35-43 st). |
| [4] | Djuraev M.D., Khudayberdieva M.Sh. The role of serological tumor-associated marker SA-72-4 in the diagnosis of early recurrence of stomach cancer. //Sibirsky oncological journal. 2009. Prilozhenie No. 2. P. 63. |
| [5] | Zaitseva A.A., Bogdanova T.M. "Oncological aspects of organs of the gastrointestinal tract" FGBOU VO "Saratovskiy gosudarstvennyy meditsinskiy universitet imeni V. I. Razumovskogo Minzdrava Rossii, [Electronic resource] – URL: bogtanmih @ mail. ru. |
| [6] | Reshetnikov O. V., Kurilovich S. A., Ragino Yu. I., Molchanova A. R., Sorokina N. N., Krotov S. A., Krotova V. A. Ispolzovanie immunofermentnogo analiza dlya vyyavleniya urovnya pepsinogenov v blood // Gastroenterology eksperimentalnaya i klinicheskaya №5/2013, C. 26-30. |
| [7] | Reshetnikov O.V. hello Physiological and clinical significance of pepsinogens in the stomach. // Clinical medicine. No. 3, 2014. C. 26-30. |
| [8] | M. Abdullaeva, N. Ibragimova, F. Yachslikova. // Journal vestnik vracha 1 (03), 22-24, 2014. |
| [9] | Nabieva F. S., Ibragimova N. S., Umarova S. S. Instrumental and laboratory methods of research for early diagnosis of echinococcosis //Vestnik nauki i obrazovaniya. - 2020. - No. 24-4 (78). - P. 47-49. |
| [10] | Nabieva F. S., Dushanova G. A., Bobokulov O. O. Znachenie immunofermentnogo analiza v diagnostike infektsionnykh zabolevaniy //Vestnik nauki i obrazovaniya. – 2021. – no. 4-1 (107). - P. 54-56. |
| [11] | Shalygin L.D., R.A. Eganyan. Energetic drinks are a real danger for healthy children, adolescents, young people and the elderly population. Part 1. Sostav energeticheskikh napitkov i vliyanie na organism ix otdelnykh komponentov. // Prophylactic medicine, 1, 2016 10.17116. P. _ 56-63. |
| [12] | Berdiyarova Shokhida Shukurullaevna, Yusupova Nargiza Abdikodirovna, Murtazaeva Nasiba Komilzhonovna, Halimova Salomat Asrorovna "Modern aspects of laboratory diagnosis of chronic osteomyelitis in children". // International scientific research journal No. 10 (2022) 19-23 P. |
| [13] | Mubarak R. Effect of Red Bull energy drink on rats' submandibular salivary glands (light and electron microscopic study). // American Journal of Science, 2012, 8(1): P.366-372. |
| [14] | Raeesa A. Mohamed, Aly M. Ahmed, Tahani Ahmed Al-Matrafi, Ali H. AlRoalle, Musaad A. Alfayez, Deema M. Al-Okaiel, Ahmed F. El Fouhil, Muhammad Atteya, Energy drinks induce adverse histopathological changes in gastric and duodenal mucosae of rats // International Journal of Advanced and Applied Sciences, 5(2) 2018, Pages: 81-89. |
| [15] | Samloff MI // Gastroenterol. 1975. V. 69. P. 1196– 1200. |
| [16] | Samloff MI // Gastroenterol. 1982. V. 83. P. 204–209. |
| [17] | Sipponen P. // J. Clin. Gastroenterol. 2001. V. 32. P. 196–202. |
| [18] | Satoru T., Akira I., Hiroshi Y., Yuhkoh K. Serum Pepsinogen Levels in Normal and Experimental Peptic Ulcer Rats Measured by Radioimmunoassay. // Chem. Pharm. Bull. 35 (4) 1515-1522 (1987) / P.1015-1023. |
| [19] | Nargiza Yusupova, Oripov Firdavs, Eshkobilova Surayyo. Influence of energy drinks on individual systems of the human body // International Journal of Early Childhood Special Education (INT-JECSE) DOI:10.9756/INTJECSE/V14I5.899 ISSN: 1308-5581 Vol 14, Issue 05 2022/ P. 7176- 7184. |
| [20] | Nargiza Yusupova, Oripov Firdavs. Energy drinks. the composition of energy drinks and the effect on the body of their individual components /tjm - Thematics journal of Microbiology ISSN 2277-2952 Vol-6-Issue-1-2022/ https://doi.org/10.5281/zenodo.6464588/ P. 24-35/. |
| [21] | IN Sabirovna, IB Fikrievich, KG Berdirasulovich // Web of Scientist: International Scientific Research Journal 3 (9), 286-289, 2022. |
| [22] | OA Gelashvily. Variant of periodization of biologically similar stages of human and rat's ontogeny // Saratovsky na y chno - meditsinsky Journal No. 4(22) 2008/ P.125-126. |

 Abstract
 Reference
 Full-Text PDF
 Full-text HTML