-
Paper Information
- Next Paper
- Previous Paper
- Paper Submission
-
Journal Information
- About This Journal
- Editorial Board
- Current Issue
- Archive
- Author Guidelines
- Contact Us
American Journal of Medicine and Medical Sciences
p-ISSN: 2165-901X e-ISSN: 2165-9036
2023; 13(7): 995-1000
doi:10.5923/j.ajmms.20231307.31
Received: Jul. 12, 2023; Accepted: Jul. 23, 2023; Published: Jul. 26, 2023

Correlations of the Thickness of the Intima-Media Complex of the Carotid Arteries with the Level of Homocysteine, Interleukin-1ß and Glucose as Prognostic Markers of the Development of Chronic Cerebral Ischemia in Type 2 Diabetes Mellitus
Nadjmitdinov O. B.1, Usmanova D. D.2
1Andijan State Medical Institute, Andijan, Uzbekistan
2Tashkent Pediatric Medical Institute, Tashkent, Uzbekistan
Copyright © 2023 The Author(s). Published by Scientific & Academic Publishing.
This work is licensed under the Creative Commons Attribution International License (CC BY).
http://creativecommons.org/licenses/by/4.0/

In this article presents correlations of the thickness of the intima-media complex of the carotid arteries with the level of homocysteine, interleukin-1ß and glucose as prognostic markers of the development of chronic cerebral ischemia in type 2 diabetes mellitus. The study included 229 patients with stage I - II CHCI. The diagnosis of CHCI and its stage was established in accordance with existing criteria (E.V. Schmidt, 1985; International Classification of Diseases of the 11th revision, 2022). The patients were divided into 2 groups. Group 1 consisted of 116 CHCI patients with type 2 diabetes mellitus (DM). The 2nd group included 113 patients with CHCI without DM who were on inpatient treatment in the departments of neurology and endocrinology of the clinic of the Andizhan State Medical Institute 2021-2023. The aim of the study was to determine and correlate the thickness of the intima-media complex of the carotid arteries with indicators of homocysteine, interleukin-1ß and blood glucose in patients with chronic cerebral ischemia with type 2 diabetes mellitus.
Keywords: Diabetes mellitus, Cerebral ischemia, Diagnosis, Hyperglycemia, Cholesterol, Homocysteine, Interleukin-1ß
Cite this paper: Nadjmitdinov O. B., Usmanova D. D., Correlations of the Thickness of the Intima-Media Complex of the Carotid Arteries with the Level of Homocysteine, Interleukin-1ß and Glucose as Prognostic Markers of the Development of Chronic Cerebral Ischemia in Type 2 Diabetes Mellitus, American Journal of Medicine and Medical Sciences, Vol. 13 No. 7, 2023, pp. 995-1000. doi: 10.5923/j.ajmms.20231307.31.
Article Outline
1. Introduction
- Diabetes mellitus (DM) is a metabolic disease characterized by hyperglycemia, and its chronic complications can lead to death and disability of patients [1,14]. There are about 415 million patients with DM worldwide, and their number is increasing annually [2,11,19]. Currently, about 193 million patients are undiagnosed. Chronic diabetes, which is not treated, causes many complications, and the incidence rate continues to rise even after the blood glucose level is under control [3,7,9]. Prolonged development of DM causes pathological changes in the vascular structure, and then leads to microvascular and macrovascular complications [4,6,13,15,16]. Numerous studies [1,5,18] have shown that DM is an independent risk factor for chronic cerebral ischemia (CHCI), and in sequence for stroke. The development of CHCI is closely associated with severe metabolic dysfunction, as well as damage to the microvascular bed [5,6,17]. The mortality of patients with DM in combination with CHCI is very high. The pathological basis of the disease is atherosclerosis, and the pathological change is thrombosis [7,20]. Therefore, timely detection and control of macro and microangiopathy is of great importance for the prevention and treatment of CHCI.The thickness of the carotid artery intima-media complex (CIMC) is an early manifestation of atherosclerosis, and changes in its magnitude reflect the severity of the course of atherosclerosis. It is practical, easy to operate and contributes to the assessment of the risk of cerebrovascular diseases [8,12]. The level of homocysteine plays an important role in the development and progression of both DM and CHCI. Its high level causes atherosclerosis and cardiovascular diseases, due to damage to the vascular endothelium, causing thrombosis and promoting proliferation of vascular smooth muscle cells [9]. DM is a chronic mild inflammation and is characterized by excessive secretion of interleukin-1ß (IL-1ß) and other proinflammatory cytokines, which enhances inflammatory signals and then leads to complications such as vasculopathy [9,10,11].According to numerous studies, it is known that systolic blood pressure (SBP), diastolic blood pressure (DBP), high-density lipoprotein cholesterol (HDL-C) and low-density lipoprotein cholesterol (LDL-C) are the main risk factors for the development of CHCI [12,14]. However, several studies have been conducted to determine and identify diagnostic values of homocysteine, IL-1ß and fasting blood glucose levels in patients with DM, as well as to determine whether IL-1ß is a risk factor for the development of CHCI.
2. Material and Methods of Research
- The study included 229 patients with stage I - II CHCI. The diagnosis of CHCI and its stage was established in accordance with existing criteria (E.V. Schmidt, 1985; International Classification of Diseases of the 11th revision, 2022). The patients were divided into 2 groups. Group 1 consisted of 116 CHCI patients with type 2 diabetes mellitus (DM). The 2nd group included 113 patients with CHCI without DM who were on inpatient treatment in the departments of neurology and endocrinology of the clinic of the Andizhan State Medical Institute 2021-2023.Group 1 consisted of 52 men and 64 women aged 45-75 years with an average age of 58.2±6.1 years. Group 2 consisted of 51 men and 62 women aged 46-76 years with an average age of 61.8±7.8 years. A control group was also created, which included 20 practically healthy individuals of identical age 59.5±7.9 years, of which 9 men and 11 women who underwent a medical examination during the same period (GC group).The criteria for inclusion in the study were: patients in the CHCI+DM group met the diagnostic criteria for DM of the American Diabetes Association (ADA) in 2017 [15], and their diabetes was type II diabetes mellitus. Patients in the CHCI group without DM met the diagnostic criteria of the American Heart Association (AHA)/American Stroke Association (ASA) in 2018 [16]. The age range of patients in the two groups was >40 years, but <76 years.The exclusion criteria were as follows: severe hepatic and renal dysfunction, heart failure, thyroid dysfunction, diabetic nephropathy, autoimmune diseases, severe infections, malignant tumors, dementia, stroke, mental illness, patients taking immunosuppressants or anti-inflammatory drugs during the previous month. Inclusion and exclusion criteria were applied to both groups.Among the methods of functional diagnostics, all patients underwent ultrasound examination of the carotid arteries using a GE Voluson P8 (General Electronics) color Doppler machine. The patient lay down for a 15-minute rest, and then his neck was completely exposed. After rest, the common carotid artery, internal carotid artery and carotid artery bifurcation were sequentially examined at a frequency of 7.5 MHz. The vertical distance between the intima of the lumen and the media adventitia, which was measured at a distance of 1 cm before and after bifurcation of the carotid artery, was the value of the intima-media complex (CIM). The value was measured 3 times to get the average value.Laboratory tests. In the morning, on an empty stomach, venous blood (5 ml) was taken from patients, placed in vacuum tubes for blood sampling and centrifuged at 1450 × g for 10 minutes at 4°C with a radius of 10 cm for separation and storage. Serum homocysteine levels (enzymatic cycling method) and glucose levels (glucose oxidase method) were determined on a semi-automatic bioCHCIical analyzer Mindray B8 88A (Mindray Inc). The reference ranges of homocysteine for women were 4.44 - 13.56 and men 5.46 - 16.20 mmol/l, glucose 3.3 - 6.1 mmol/l, respectively. The level of IL-1ß in serum was determined using enzyme immunoassay (ELISA) [17], with steps performed in accordance with the instructions for the ELISA kit for human IL-1ß [RT2100C (Raito Inc)]. Standard wells, wells with samples for testing and wells with empty control (without samples and reagents labeled with enzymes) were prepared. Standard substances (50 µl) were accurately added to the standard wells of the enzyme-labeled tablet, which was coated, while diluent for samples (40 µl) was added to the wells for the tested samples, and then the tested samples (10 µl). (the final dilution of the sample is 5 times). After that, the tablet was covered, incubated at 37°C for 30 minutes, and then wiped dry after removing the liquid from the wells. The tablet was repeatedly washed 5 times. In each well, except for the control wells, enzyme-labeled reagents (50 µl) were added, coated, and then incubated at 37°C for 30 minutes. Next, substrate A was added to each well, then substrate B (50 ml each) and after careful mixing of the substrates, they were stained at 37°C for 10 minutes in the dark. Finally, a stop solution (50 ml) was added to each well to stop the reaction. The optical density (OD) values of each well were sequentially measured at 450 nm using a multifunctional device for reading Raito RT2100C microplates (Microplate reader) to calculate the level of IL-1ß.Statistical data processing. For statistical analysis, SPSS 22.0 was used. The counting data was expressed by the number of cases/percentage [n (%)], and the comparison of data between groups was analyzed using the chi-square criterion. The measurement data was expressed as an average value ± standard deviation (mean value ± standard deviation), and the comparison of data between groups was analyzed using the t-test of independent samples. A one-sided ANOVA was used to compare averages between several groups. The Student's criterion was used for pairwise comparison between groups. Pearson's criterion was used to analyze the correlation of homocysteine, IL-1ß and glucose levels with the value of CIM. Receiver performance curves (ROC) were constructed to calculate the area under the curve (AUC), determine the threshold values of homocysteine, IL-1ß and glucose for the diagnosis of CHCI with DM, as well as to calculate their sensitivity and specificity. Multivariate logistic regression was used to analyze the risk factors of CHCI with DM. P<0.05 indicates a statistically significant difference.
3. Results and Discussion
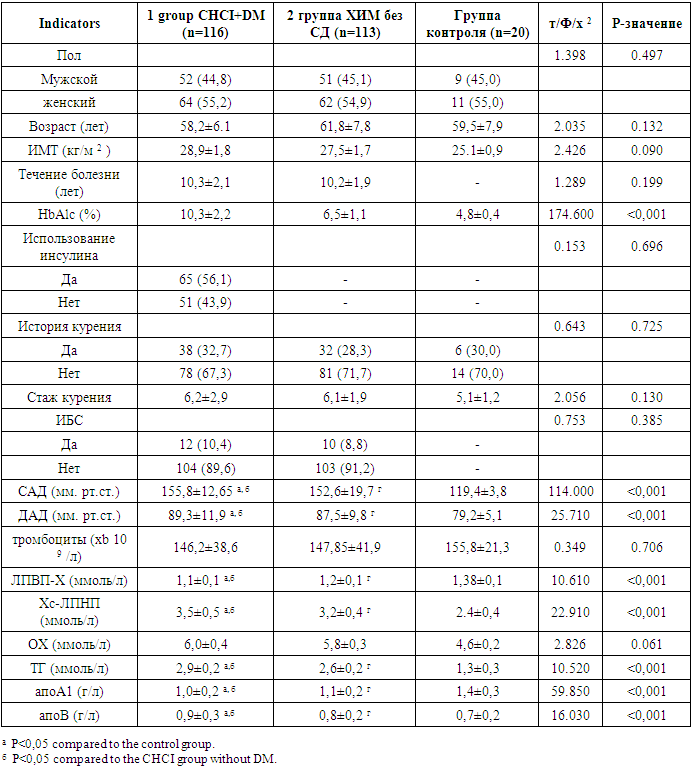
- The conducted studies showed that there were significant differences between the groups of CHCI with type 2 diabetes, CHCI without diabetes and HA in relation to glycated hemoglobin (HbAlc), systolic blood pressure (SAD), diastolic blood pressure DBP, high-density lipoprotein cholesterol, low-density lipoprotein cholesterol, triglycerides (TG), apolipoprotein A1 (ApoA1) and apolipoprotein B (apoB) (P<0.05). It should be noted that there were no significant differences in gender, age, body mass index (BMI), smoking experience, coronary heart disease (CHD), platelet count and total cholesterol (OH). Significant differences were revealed between the groups of CHCI with type 2 diabetes and CHCI without diabetes in terms of SBP, DBP, HDL-C, LDL-C, TG, ApoA1 and ApoV (p<0.05), not in the course of the disease, HbA1c, the use of insulin and coronary heart disease (P>0.05) (Table 1).
|
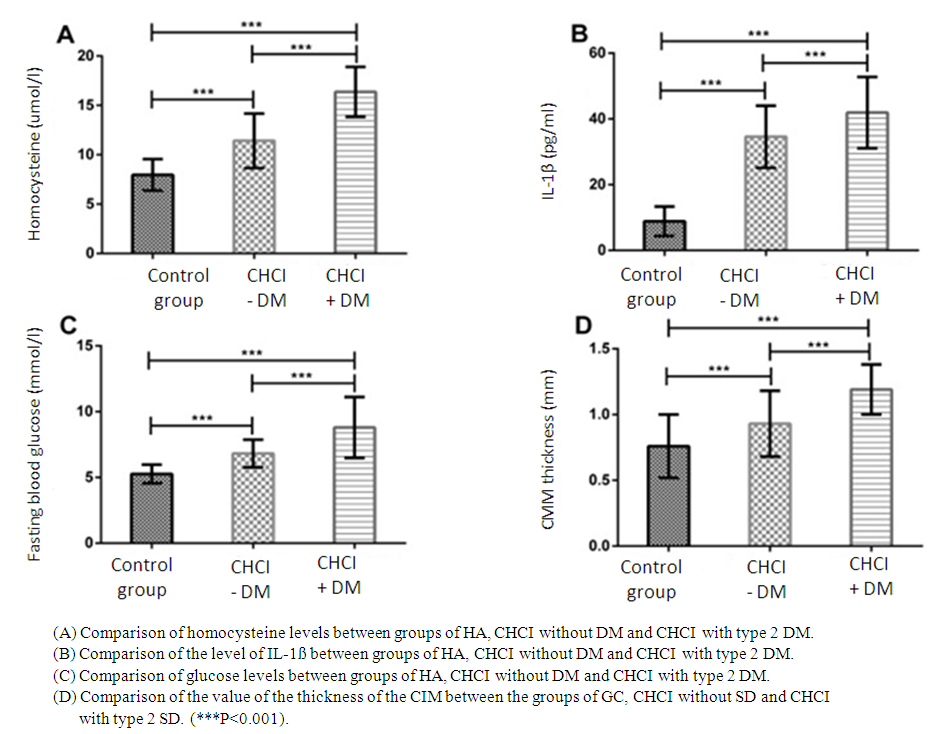
 | Figure 1. Comparison of the levels of homocysteine IL-1ß and glucose and the values of the CIM thickness |
 | Figure 2. Correlation of the levels of homocysteine, IL-1ß and glucose with the value of CIM thickness in the CHCI group with type 2 diabetes |
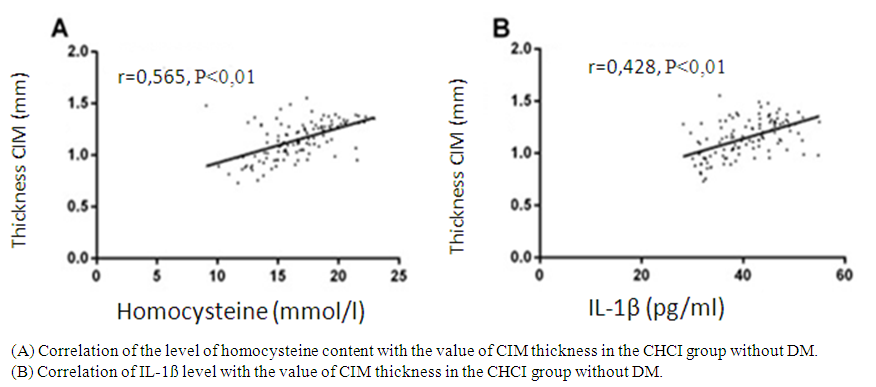
 | Figure 3. Correlation of homocysteine and IL-1ß levels with the value of CIM thickness in the CHCI group without DM |
4. Conclusions
- In this study, the levels of homocysteine, IL-1ß and glucose, as well as the value of the thickness of CIM in the groups of CHCI with type 2 DM and CHCI without DM were significantly higher than in the group of HA, and the levels and value in the group of CHCI with type 2 DM were significantly higher compared to the group of CHCI without SD. This indicates that CHCI patients with type 2 diabetes have severe atherosclerosis, and homocysteine, IL-1ß and glucose are involved in the development and progression of CHCI with type 2 diabetes. In addition, the levels of homocysteine, IL-1ß and glucose positively correlated with the value of the thickness of the CIM, which shows that these three levels can affect the CIM, so it is expected that homocysteine, IL-1ß and glucose will be indicators for assessing the severity of CIM with type 2 diabetes. In a study by Liu H. et al., 2018, the value of CIM thickness in patients with isCHCIic stroke on the background of type 2 diabetes is significantly higher than in the group of patients with type 2 diabetes without stroke. In patients with DM, the probability of stroke increases by 1.8 times with each increase in the thickness of the CIM by 0.1 mm. The level of glycated hemoglobin and age are independently associated with the development of cerebral circulatory disorders.
 Abstract
 Reference
 Full-Text PDF
 Full-text HTML