-
Paper Information
- Next Paper
- Previous Paper
- Paper Submission
-
Journal Information
- About This Journal
- Editorial Board
- Current Issue
- Archive
- Author Guidelines
- Contact Us
American Journal of Medicine and Medical Sciences
p-ISSN: 2165-901X e-ISSN: 2165-9036
2022; 12(12): 1297-1302
doi:10.5923/j.ajmms.20221212.25
Received: Dec. 3, 2022; Accepted: Dec. 16, 2022; Published: Dec. 23, 2022

Metabolic Profile of Women with Premature Ovarian Insufficiency, Depending on the Level of Follicle-Stimulating Hormone
 Abstract
 Reference
 Full-Text PDF
 Full-text HTML
Fakhrutdinova Sevara Srazhitdinovna
Republican Specialized Scientific and Practical Medical Center for Endocrinology named after Academician Y.Kh. Turakulova, Tashkent, the Republic of Uzbekistan
Correspondence to: Fakhrutdinova Sevara Srazhitdinovna, Republican Specialized Scientific and Practical Medical Center for Endocrinology named after Academician Y.Kh. Turakulova, Tashkent, the Republic of Uzbekistan.
| Email: |  |
Copyright © 2022 The Author(s). Published by Scientific & Academic Publishing.
This work is licensed under the Creative Commons Attribution International License (CC BY).
http://creativecommons.org/licenses/by/4.0/

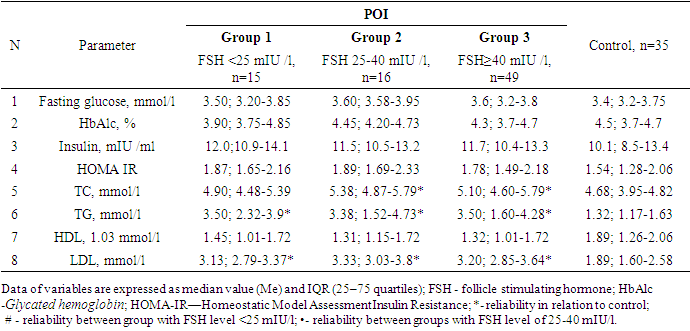
Premature ovarian insufficiency is considered one of the important health problems of women due to adverse effects on the body, which contribute to a significant increase in the risk of various diseases. Purpose of the Study: The aim of the study is to assess the lipid profile, glucose metabolism and insulin resistance in women with POI with different levels of FSH. Materials and Methods: The main group included 80 women (average age 28.0±7.2 years) with an idiopathic form of POI. The control group included 35 women (average age 30.6±8.3 years) with regular menstruation and no confirmed endocrine disorders. Results: All women with POI were divided into groups according to ESHRE recommendations, 16 women were included in the group with FSH level >25 to 40 mIU/ml, 49 patients were in the group with FSH ≥40 mIU/ml. Fasting plasma glucose, HbAlc, and insulin levels did not differ from those of the control group as a whole and depending on FSH level. The lipid profile in groups with different levels of FSH differed significantly only from the data of the control group. A comparative analysis of the borderline levels of the lipid profile in POI and control groups showed that total cholesterol ≥5.2 mmol/l (χ2=18,9; р <0,0001), TG ≥1,7 mmol/l (χ2=19,5; р <0,0001) and LDL ≥3.5 mmol/l (χ2=9,8; р=0,02) were statistically significantly more common in POI group than in the control group, and in terms of HDL frequency <1.03 mmol/l (χ2=3,5; р=0,32) the groups did not differ significantly from each other.
Keywords: Premature ovarian insufficiency (POI), Hormonal profile, Metabolic profile
Cite this paper: Fakhrutdinova Sevara Srazhitdinovna, Metabolic Profile of Women with Premature Ovarian Insufficiency, Depending on the Level of Follicle-Stimulating Hormone, American Journal of Medicine and Medical Sciences, Vol. 12 No. 12, 2022, pp. 1297-1302. doi: 10.5923/j.ajmms.20221212.25.
Article Outline
1. Introduction
- According to the recommendations of the European Society of Human Reproduction and Embryology (ESHRE), premature ovarian insufficiency (POI) is a clinical syndrome defined as loss of ovarian function in women under 40 years of age, characterized by the presence of oligo-/amenorrhea lasting at least four months with an increase in gonadotropin levels and low content of estradiol. [1].The cause of POI is still a matter of debate among scholars. It is assumed that genetic disorders, hormonal and metabolic changes, infections and autoimmune diseases, as well as iatrogenic causes (surgery, radiation therapy and chemotherapy) can contribute to the disease. [2].It is estimated that the prevalence of POI ranges from 0.01% in women under 20 years of age to 1% of women under 40 years of age and varies depending on the ethnicity and age of women. [2,3,4]. The disease is more common in women of Caucasian race (1-1.4%), African -American and Latina women. [5]. Residents of China (0.5%) and Japan are less susceptible to this pathology (0,1%) [6].Incidence of POI in women with primary amenorrhea is 10–28%, while in women with secondary amenorrhea- it is 4–18% and up to 5% of endocrine infertility. [5,7].Premature ovarian insufficiency is considered one of the important health problems of women due to adverse effects on the body, which contribute to a significant increase in the risk of cardiovascular disease (CVD), osteoporosis and neurological disorders. [8,9].
2. Purpose of the Study
- The purpose of the study is to evaluate the lipid profile, glucose metabolism and insulin resistance in women with POI with different FSH levels.
3. Materials and Methods
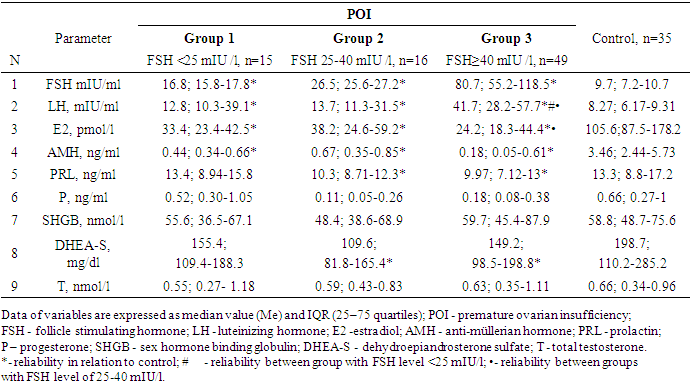
- 80 women (average age 28.0±7.2 years) with an idiopathic form of POI were included in the main group. 35 women (average age 30.6±8.3 years) with regular menstruation and no confirmed endocrine disorders were included in the control group. All women in the study signed an informed consent to an anonymous analysis of their medical data.According to ESHRE recommendations, the diagnostic criteria for POI are: oligo / amenorrhea for at least 4 months and increased FSH level >25 IU / l in two cases with an interval of >4 weeks [1].Blood sampling was performed in the follicular phase (3rd–5th day of the menstrual cycle) in controls and against the background of amenorrhea in women with suspected POI.The study of the lipid spectrum of blood was carried out by the photometric method using reagent kits from "Human" company (Germany). The levels of hormones in the blood serum were determined (FSH, LH, estradiol (E2), prolactin, AMH, SHBG, DHEAS, testosterone, TSH, free T4, TPOAb) by the electrochemiluminescent method on the immunochemical analyzer Elecsys and cobas e. s using standard kits Cobas Roche ("Roche Diagnostics GmbH", Germany).Determination of glucose was carried out by the glucose oxidant method using kits from "Human" company (Germany). Glycosylated hemoglobin (HbA1c) was determined by the turbidimetric method with reagents kit from Human (Germany). Insulin level was determined by electrochemiluminescent method on the immunochemical analyzer Elecsys and cobas e. using standard kits Cobas Roche (Germany).Insulin resistance index HOMA IR was calculated by the formula: HOMA-IR = fasting insulin * fasting glucose / 22.5. Insulin resistance was established when HOMA-IR >2.5.The normal reference ranges used in our laboratory were as follows: FSH: 3.5–12.5 mIU/ml; LH: 2.4–12.6 mIU/ml; E2: 68–1269 pmol/l; PRL: 4.79–23.3 ng/ml; AMH: 0.09-9.49 ng/ml; SHBG: 32.4–128.0 nmol/l; DHEAS: 60.9–407.0 mcg/dl; T: 0.29–1.67 nmol/l; TSH: 0.27–4.0 mIU/ml; fT4: 0.93–2.0 ng/dl; TPOAb <34.0 IU / ml.
4. Statistical Analysis
- SPSS 23.0 was used for statistical analysis. The single-sample Kolmogorov-Smirnov test was used for normality of distribution. Continuous variables that were not normally distributed were presented as median (quartile interval) and compared by nonparametric test. ROC analysis was conducted using interactive programs easyROC, ver. 1.3 (http://www.biosoft.hacettepe.edu.tr/easyROC). To determine a diagnostically significant FSH cut-off point, ROC analysis was used with making ROC curve and the indication of the area under the curve (AUC). The differences were considered statistically significant when р<0.05.
5. Results and Discussion
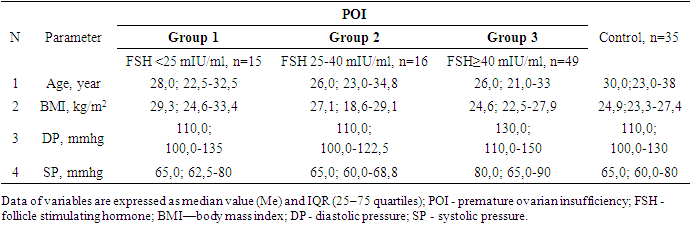
- All women with POI were divided into groups based on ESHRE recommendations, FSH group >25 to 40 mIU/ml included 16 women, FSH group ≥40 mIU/ml included 49 patients.Since the maximum reference range of FSH in our laboratory was 12.5 mIU/ ml, the study included women under 40 years of age with menstrual irregularities (secondary amenorrhea lasting 6 months or more), with FSH levels of <25 mIU / ml, high LH levels and low E2 obtained twice with an interval of 4 weeks, AMH concentration was also taken into account. This group of women (n = 15) (average age 28.7±8.0 years) did not take medications (for 6 months before the examination), which could affect hormonal and biochemical indicators.Thus, 3 groups of patients were identified: group 1 - FSH <25 mIU/ml (n=15), group 2- FSH 25-40 mIU/ml (n=16) and group 3-FSH ≥40 mIU/ml (n=49). It should be noted that the majority (61.3%) of women with POI had FSH level ≥40 mIU/ml.It is known that both age and BMI can have an impact on metabolic rates, but our study found no differences in age and BMI between the three groups. The age of the examined patients and persons from the control group ranged from 18 to 45 years old. (Table 1.).
|
|
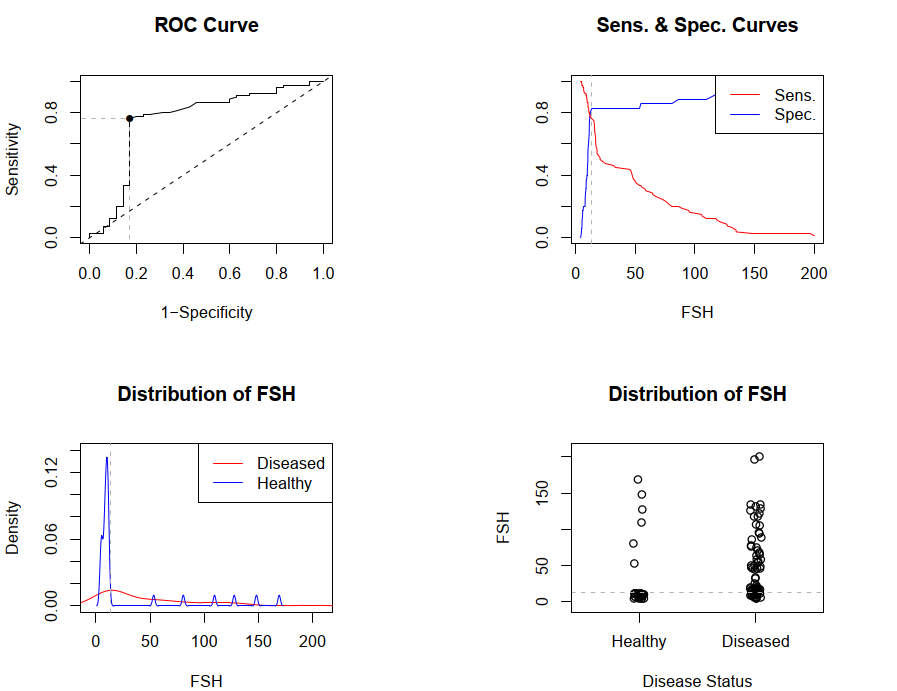 | Figure 1. ROC curves and cut-off point of FSH. FSH - follicle stimulating hormone |
|
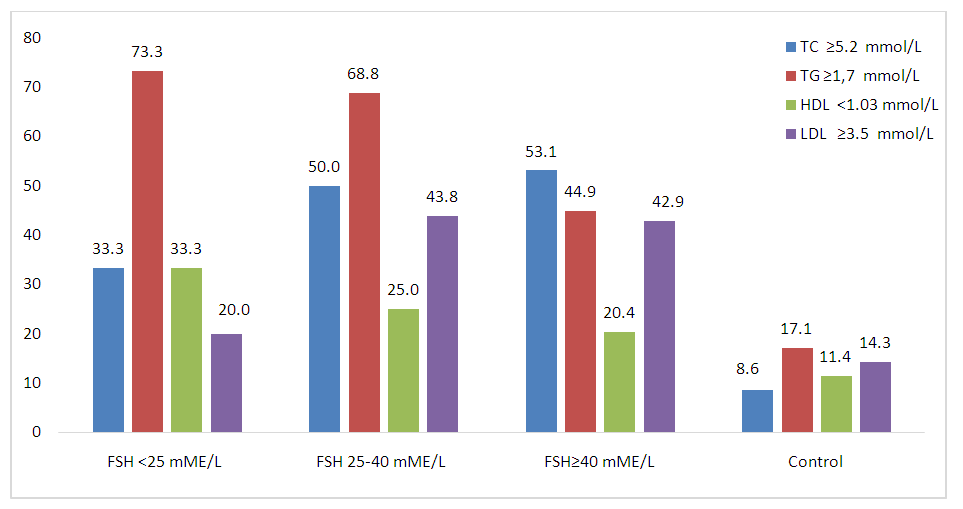 | Figure 2. Frequency of occurrence of lipid spectrum indicators that differ from the reference values. FSH - follicle stimulating hormone; TC—total cholesterol; TG—triglycerides;HDL—high-density lipoprotein cholesterol; LDL—low-density lipoprotein cholesterol |
6. Conclusions
- 1. Diagnostically significant cut-off point for FSH was determined with the help of ROC analysis. FSH cut-off point of 13.4 mIU/ml is the starting point for identifying POI risk group.2. Fasting glucose, HbAlc and insulin levels did not differ from indicators of the control group as a whole and depending on FSH level. The lipid profile in groups with different levels of FSH differed significantly only from the data of the control group. Lipid spectrum indicators (TC, TG and LDL) in women with POI did not differ depending on FSH level. 3. Comparative analysis of the borderline levels of the lipid profile in POI and control groups showed that total cholesterol ≥5.2 mmol/l (χ2=18.9; p<0.0001), TG ≥1.7 mmol/l (χ2= 19.5; p<0.0001) and LDL ≥3.5 mmol/l (χ2=9.8; p=0.02) were statistically significantly more common in POI than in the control group, and by frequency of HDL <1.03 mmol/l (χ2=3.5; p=0.32) the groups did not differ significantly from each other.Conflict of interest: The author has no conflict of interest to declare.