-
Paper Information
- Next Paper
- Paper Submission
-
Journal Information
- About This Journal
- Editorial Board
- Current Issue
- Archive
- Author Guidelines
- Contact Us
American Journal of Medicine and Medical Sciences
p-ISSN: 2165-901X e-ISSN: 2165-9036
2022; 12(12): 1273-1276
doi:10.5923/j.ajmms.20221212.22
Received: Oct. 22, 2022; Accepted: Nov. 16, 2022; Published: Dec. 23, 2022

Content of the Main Components of Protein, Carbohydrate and Lipid Metabolism in Different Blood Groups
 Abstract
 Reference
 Full-Text PDF
 Full-text HTML
Azizova N. M.1, Yuldashev N. M.1, Saidov A. B.2, Akbarxodjayeva H. N.1
1Tashkent Pediatric Medical Institute, Uzbekistan
2Republic Blood Transfusion Center
Correspondence to: Azizova N. M., Tashkent Pediatric Medical Institute, Uzbekistan.
| Email: |  |
Copyright © 2022 The Author(s). Published by Scientific & Academic Publishing.
This work is licensed under the Creative Commons Attribution International License (CC BY).
http://creativecommons.org/licenses/by/4.0/

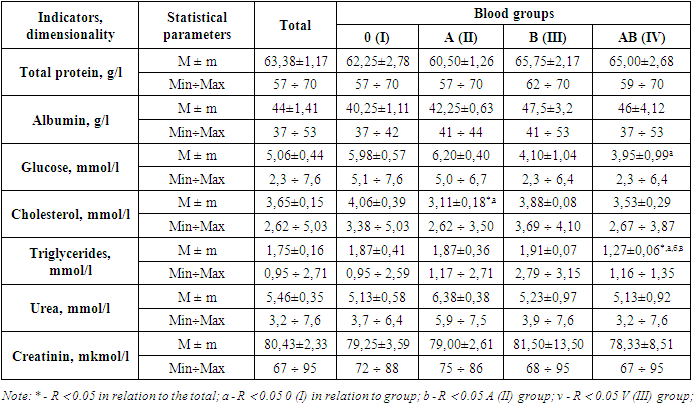
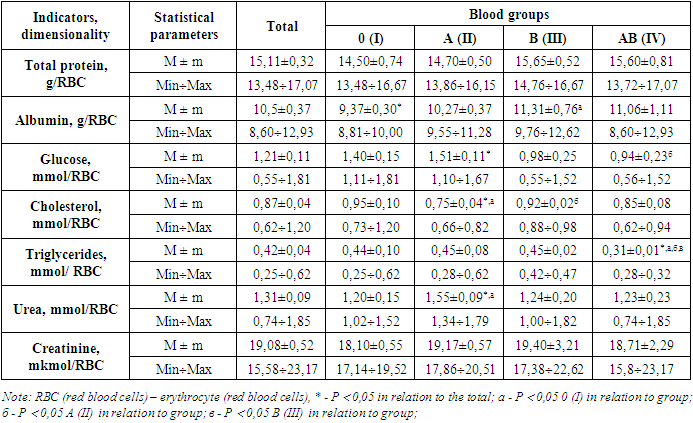
The purpose of this work is to evaluate the differences in some biochemical parameters in blood plasma of blood groups I (0), II (A), III (B) and IV (AB). Biochemical indicators were determined on a Humastar100 (Germany) biochemical analyzer. The obtained results showed that there are certain statistically reliable differences between the amounts of biochemical indicators such as albumin, glucose, cholesterol, triglyceride and urea in blood plasmas of different blood groups.
Keywords: AB0 system, Blood plasma, Total protein, Albumin, Glucose, Triglyceride, Cholesterol, Urea, Creatinine
Cite this paper: Azizova N. M., Yuldashev N. M., Saidov A. B., Akbarxodjayeva H. N., Content of the Main Components of Protein, Carbohydrate and Lipid Metabolism in Different Blood Groups, American Journal of Medicine and Medical Sciences, Vol. 12 No. 12, 2022, pp. 1273-1276. doi: 10.5923/j.ajmms.20221212.22.
Article Outline
1. Relevance of the Topic
- Currently, the basis of future medicine - personal medicine - is being formed on the basis of such sciences as genomics and proteomics. It is known fact that the specificity of each human organism and each genome leads to wide variability of the physiological reaction to a type of factor that can affect the human organism. And this condition underlies the clinical polymorphism of various diseases. The quality of the diagnosis and the adequacy of the treatment depend on the informativeness of the results obtained through diagnostic studies [1]. At the same time, it is necessary to pay attention for the limits of normal and pathology, which are highly conditional in many cases. So, for this reason, it is very important to study the cellular composition of blood, various indicators of metabolism, which are widely used in clinical laboratory diagnostics and allow to come to the correct clinical solution. This allows person to make the right clinical decisions. The membranes of erythrocyte cells contain antigen structures, and their composition is made up of glycoproteins. They determine blood group belonging to one or another group and play an important role in the life of a person as a biological species. [2]. They are not only markers of blood groups, but also perform various biological functions. These are receptor (exogenous ligands for chemokines, parasites and microbes), transport (aquaporins, glucose, nucleosides, urea, etc.), structural (glycoprotein A, glycoprotein C), regulatory (enzymes), complement activation (CD35, CD55, CD59, etc.) [3,4]. Scientific literature contains an information that there are certain differences in the cellular structure of different blood groups. This allows us to hypothesize that there are differences in the biochemical indicators of erythrocytes belonging to different blood groups. According to this, we studied a number of biochemical indicators of blood erythrocytes according with the point of AB0 system.The purpose of research. Evaluation of differences between biochemical indicators of erythrocytes of different blood groups.
2. Material and Methods
- The blood used as research material was obtained from 156 Uzbek male donors of the Republican Blood Transfusion Center (Tashkent). The consent of these donors was obtained to conduct this research on their blood. Identification of the investigated blood group was carried out using monoclonal antibodies erythrotestcyclones anti-A, anti-B, anti-D Super OOO "Hematolog" and standard erythrocyte set 0 (I), A (II), B (III). Blood plasma belonging to different blood groups was separated from erythrocytes using a Hettich Micro 200 (Germany) centrifuge (1000 g in 15 minutes). The amount of total protein, glucose, cholesterol, triglycerides, urea and creatinine in the isolated plasma specimens was evaluated on a HUMANSTAR 100 biochemical analyzer (Germany). The amount of total protein, glucose, cholesterol, triglycerides, urea and creatinine in the isolated plasmas were determined on a HUMANSTAR 100 biochemical analyzer (Germany). Biochemical indicators were calculated for 1 liter of blood plasma and 1 erythrocyte. The reason for calculating in relation to 1 erythrocyte is that, there is also a difference in the number of erythrocytes in 1 liter of plasma. As a comparative group, the total indicators created by combining the numerical data obtained from different blood groups were used. The obtained numerical results were statistically processed based on Student's t-criterion.
3. Analysis of the Obtained Results
- We received 156 Uzbek male donors for the study, as mentioned above. The reason why men of Uzbek ethnicity were singled out was not to identify ethnic characteristics, because for this it is necessary to conduct research in a large group. Selecting only representatives of one nationality for research allows to avoid errors that may arise as a result of characteristics specific to the nationality.The research results showed that the blood groups in the studied group were distributed according to the AB0 system as follows: 0 (I) blood group - 31.1%, A (II) blood group - 32.7%, B (III) blood group - 26.4% and AB (IV) blood group – 9.9% (Fig. 1).
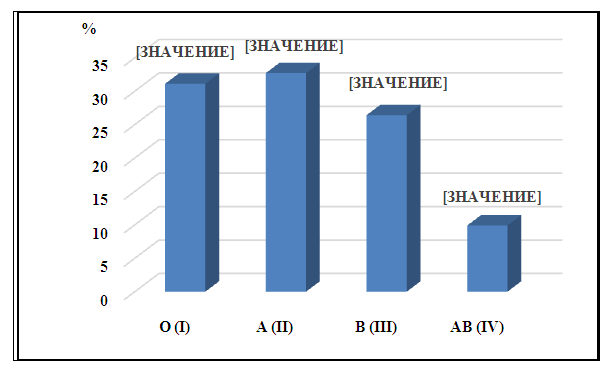 | Figure 1. Distribution of the blood of Uzbek male donors according to the AB0 system |
|
|
4. Summary
- Thus, the studies conducted showed that there are certain statistically reliable differences between the amounts of a number of biochemical indicators such as albumin, glucose, cholesterol, triglyceride and urea in the blood plasma belonging to different groups according to the AB0 system. showed These results allow in the future to determine the normal limits of biochemical parameters, taking into account the blood group approach, as well as to individualize the normal values of biochemical parameters.