-
Paper Information
- Paper Submission
-
Journal Information
- About This Journal
- Editorial Board
- Current Issue
- Archive
- Author Guidelines
- Contact Us
American Journal of Medicine and Medical Sciences
p-ISSN: 2165-901X e-ISSN: 2165-9036
2020; 10(10): 826-832
doi:10.5923/j.ajmms.20201010.20
Received: Sep. 22, 2020; Accepted: Oct. 12, 2020; Published: Oct. 28, 2020

Status of Morphometric Parameters of the Fundus in Optic Neuritis Due to Devic’s Neuromyelitis Optica
 Abstract
 Reference
 Full-Text PDF
 Full-text HTML
Munirahon Sadikjanovna Kasimova, Gavkhar Khusanovna Khamraeva
Department of Ophthalmology, Tаshkent Institute of Postgrаduаte Medicаl Educаtion, Tаshkent, Uzbekistan
Correspondence to: Gavkhar Khusanovna Khamraeva, Department of Ophthalmology, Tаshkent Institute of Postgrаduаte Medicаl Educаtion, Tаshkent, Uzbekistan.
| Email: |  |
Copyright © 2020 The Author(s). Published by Scientific & Academic Publishing.
This work is licensed under the Creative Commons Attribution International License (CC BY).
http://creativecommons.org/licenses/by/4.0/

Background. Optic neuritis (ON) is the first symptom of Devic’s neuromyelitis optica in more than half of cases. Purpose. Assessment of the state of the retina and optic nerve in optic neuritis due to Devic’s neuromyelitis optica. Material and methods. We observed 23 patients (36 eyes), the control group consisted of 20 (40 eyes) healthy individuals. The research methods were standard ophthalmic and special methods (MRI and MRI tractography of the brain). Results. In optic neuritis against the background of neuromyelitis optica, optical coherence tomography (OCT) revealed a smaller area of the optic nerve head and neuroretinal girdle, a decrease in macular volume and macular thickness. An increase in indicators of focal and global loss of retinal ganglion cells in patients with optic neuritis was found. A decrease in the volume of the retinal ganglion cell complex + the inner plexiform layer was also revealed. Conclusion. In the initial stages of neuromyelitis optica, OCT is needed to detect these changes at an early stage of the disease, to prescribe appropriate treatment as early as possible in order to reduce the rate of axonal degeneration and the development of optic nerve head atrophy.
Keywords: Optic Neuritis, Devic's Neuromyelitis Optica, Diagnostics, Optical Coherence Tomography of the Retina
Cite this paper: Munirahon Sadikjanovna Kasimova, Gavkhar Khusanovna Khamraeva, Status of Morphometric Parameters of the Fundus in Optic Neuritis Due to Devic’s Neuromyelitis Optica, American Journal of Medicine and Medical Sciences, Vol. 10 No. 10, 2020, pp. 826-832. doi: 10.5923/j.ajmms.20201010.20.
Article Outline
1. Introduction
- According to the Fragoso Y. optic neuritis is the first symptom of Devic’s neuromyelitis optica in more than half of the cases. It should be noted that 5-7 years after optic neuritis, myelitis develops in 45-75% of cases [8]. Degeneration of axons and neurons is an important feature in optic neuritis due to neuromyelitis optica. The problem of early detection of lesions of the visual analyzer in demyelinating diseases of the nervous system is most difficult due to the presence of morphological changes in the optic nerve in the frequent absence of ophthalmoscopic changes in the fundus [4,7,9]. Identification of objective signs preceding the clinical manifestations of the disease is decisive in the diagnosis. OCT is a non-invasive retinal imaging technique that examines the thickness of the retinal nerve fiber layers (RNFL). It consists of the axons of the ganglion cells that form the optic nerve, chiasm, and optic tract. At the same time, the macula contains neurons of the retinal ganglion cells (GCS), in contrast to the peripapillary zone. Since retinal axons are not covered by the myelin sheath, RNFL and GCS are ideal structures for studying neurodegeneration [1,2,5,10,12]. Therefore, in order to solve the tasks set before us, we investigated the thickness of RNFL and GCS in the compared groups. Visual disturbances in neuromyelitis optica are caused by damage to the optic tract at different levels. In the foci located in the optic nerve and chiasm, the same changes are observed as in the foci located in the brain and spinal cord [3,6,11].Therefore, it remains relevant to search and study promising new diagnostic methods based on a detailed study of the structures of the optic nerve, brain and spinal cord for early detection of neurodegenerative diseases, for effective dynamic monitoring and control of exacerbations of optic neuritis against the background of optic myelitis.
2. Purpose of Research
- To study the parameters of OCT in cases of changes in the organ of vision at Devic's neuromyelitis optica.
3. Material and Methods
- We observed 23 patients (36 eyes), the control group consisted of 20 (40 eyes) healthy individuals. Among the patients, there were 6 men and 17 women. According to the recommendations of WHO experts, the criteria for inclusion of patients in this study were a) the established diagnosis of optic neuritis, b) sick and healthy persons who gave written informed consent to participate in the study, and c) acute or recurrent course of the disease. The diagnosis of optic neuritis was established on the basis of anamnesis and examination results: decreased visual acuity; the presence of discomfort or pain when moving the eyeballs; impaired color vision; changes in the field of vision; decreased afferent pupillary reflex; the presence of edema or other changes in the optic disc during ophthalmoscopy; changes in OCT; change in the latency and amplitude of P100 on the VEP.The exclusion criteria from this study were: patients with concomitant diseases of the organ of vision, which could affect the interpretation of the results (conjunctivitis, uveitis, glaucoma, dystrophic, and other ischemic, vascular and malignant diseases of the eyes); Sarcoidosis, Behcet's disease, lymphoma; severe concomitant somatic pathology (clinically significant pathology of the cardiovascular, endocrine, respiratory system, gastrointestinal tract), which complicates the performance of studies or the interpretation of their results.For scientific research, the approval of the Ethical Commission for Medical Research of the Ethical and Pharmaceutical Committee of the Republic of Uzbekistan was received in accordance with the Helsinki Declaration of the World Medical Association. For inclusion in the research work, voluntary informed consent of the patients was obtained.To make the diagnosis of optic neuritis, the following criteria were taken into account: visual acuity, decreased daytime vision in relation to evening vision, the nature of vision loss, oculomotor disturbances, pain when moving the eyeball, the presence of changes in the optic nerve head in the form of hyperemia or pallor in the fundus, Utgoff's symptom; MRI data of the brain and spinal cord; the results of the study of visual evoked potentials, the results of immunobiochemical studies; neurological examination data. The diagnosis of Devic's neuromyelitis optica was made to the patients based on the criteria according to D.H. Miller et al., (2008) revised by an international working group. All patients were observed by a neurologist. Large and small diagnostic criteria for neuromyelitis optica were taken into account. Large criteria include optic neuritis, transverse myelitis with more than 3 vertebral segments, and absence of other autoimmune diseases. Small criteria - nonspecific changes on MRI; foci in the hypothalamus, in the medulla oblongata, or brainstem; serum positive test for antibodies to aquaporin-4. The research methods were standard ophthalmic (visometry, tonometry, perimetry, ophthalmoscopy, optical coherence tomography) and special methods (MRI of the brain and spinal cord, MRI tractography). Spectral optical coherence tomography was performed on a Cirrus HD-4000 apparatus (Carl Zeiss Meditec HD). The optic disc area was examined using the Optic Disc Cube 200x200 protocol, followed by a peripapillary analysis of the RNFL using the RNFL Thickness Analysis software, where the RNFL thickness was measured along a circumference of 3.46 mm in diameter. In the protocol for the study of the optic disc parameters, the area and volume of the neuroretinal zone, the ratio of the excavation area to the optic disc area and the average thickness of the RNFL and the thickness in 4 quadrants were taken into account. The following parameters were studied in the GCS study protocol: the average GCS thickness, the level of focal and total GCS complex loss (FLV and GLV, respectively). MRI - the study was carried out on a tomograph "MAGNETOM ESSENZA" SIEMENS with a magnetic field induction of 1.5 TL. The data obtained were subjected to statistical processing using the STATISTICA 6.0 program. Quantitative indicators were processed by descriptive statistics methods and presented as the arithmetic mean and its standard error (M ± SEM). For indicators characterizing qualitative characteristics, the absolute number and relative value in percentage terms (%) were indicated. To test the hypothesis of normal distribution of quantitative indicators, the Kolmogorov-Smirnov test was used. In case of deviation from the normal distribution, the nonparametric Mann-Whitney U-test was used for unrelated samples to compare the data, and if the data corresponded to the normal distribution, the Student's t-test was used.
4. Results and Discussion
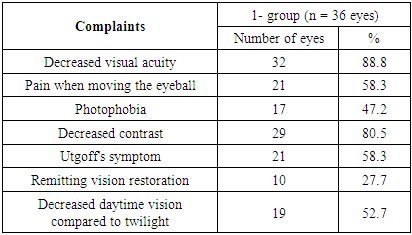
- At the initial examination, patients with optic neuritis due to neuromyelitis optica complained of decreased visual acuity (88.8%), pain when moving the eyeball (58.3%).When studying the features of visual impairment, it was revealed that one of the distinguishing features of demyelinating optic neuritis is Utgoff's symptom (fluctuations in visual acuity after physical exertion or an increase in body temperature), its frequency in the patient group was revealed in 58.3% of cases. In the genesis of the formation of this syndrome, special attention is paid to membrane mechanisms, changes in ionic homeostasis under the influence of heat. The remitting nature of vision restoration was also noted (27.7% of cases), which is based on the increased sensitivity of demyelinated axons to various external influences.
|
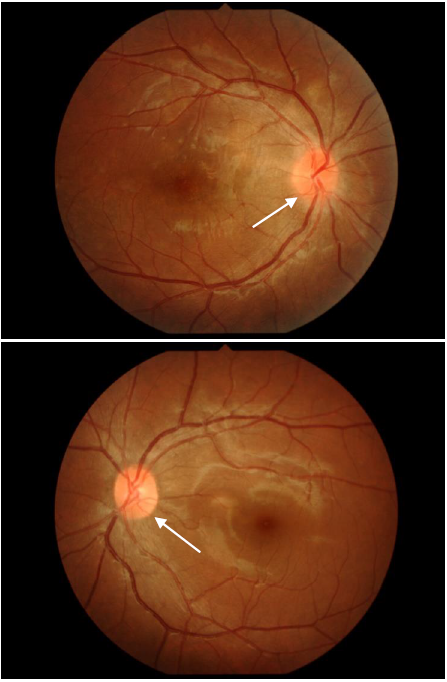 | Figure 1. Ophthalmoscopic picture of the fundus of the patient A.R. |
|
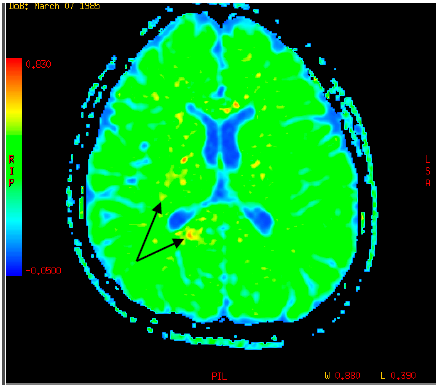
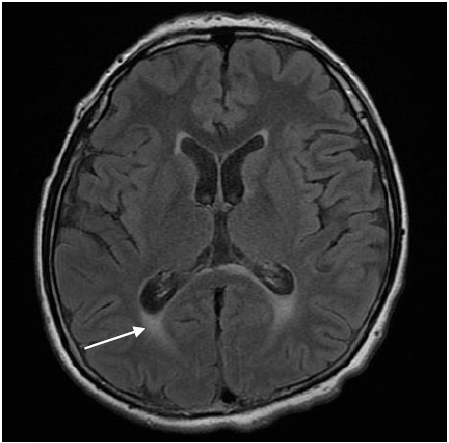 | Figure 2. MRI of the brain of patient A.R. Single white foci in the periventricular areas was revealed |
 | Figure 3. MR-tractography of patient A.R. There is a decrease in the index of fractional anisotropy in the areas of pathological intensity of the brain |
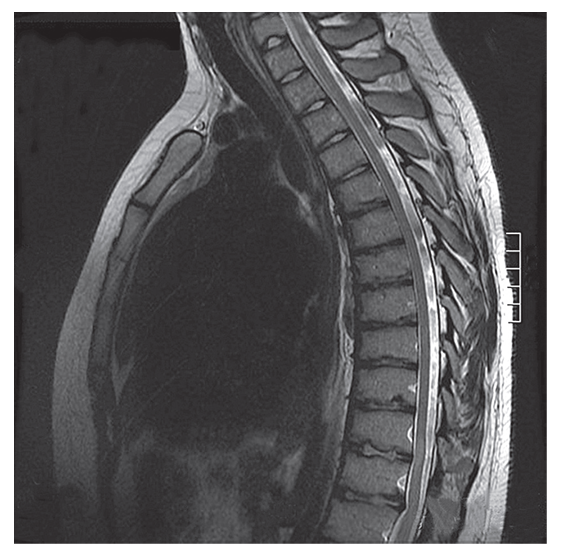 | Figure 4. On MRI of the spinal cord, foci are visualized at the level of the vertebral segments ThIV – ThV, ThXI – ThXII |
|
|
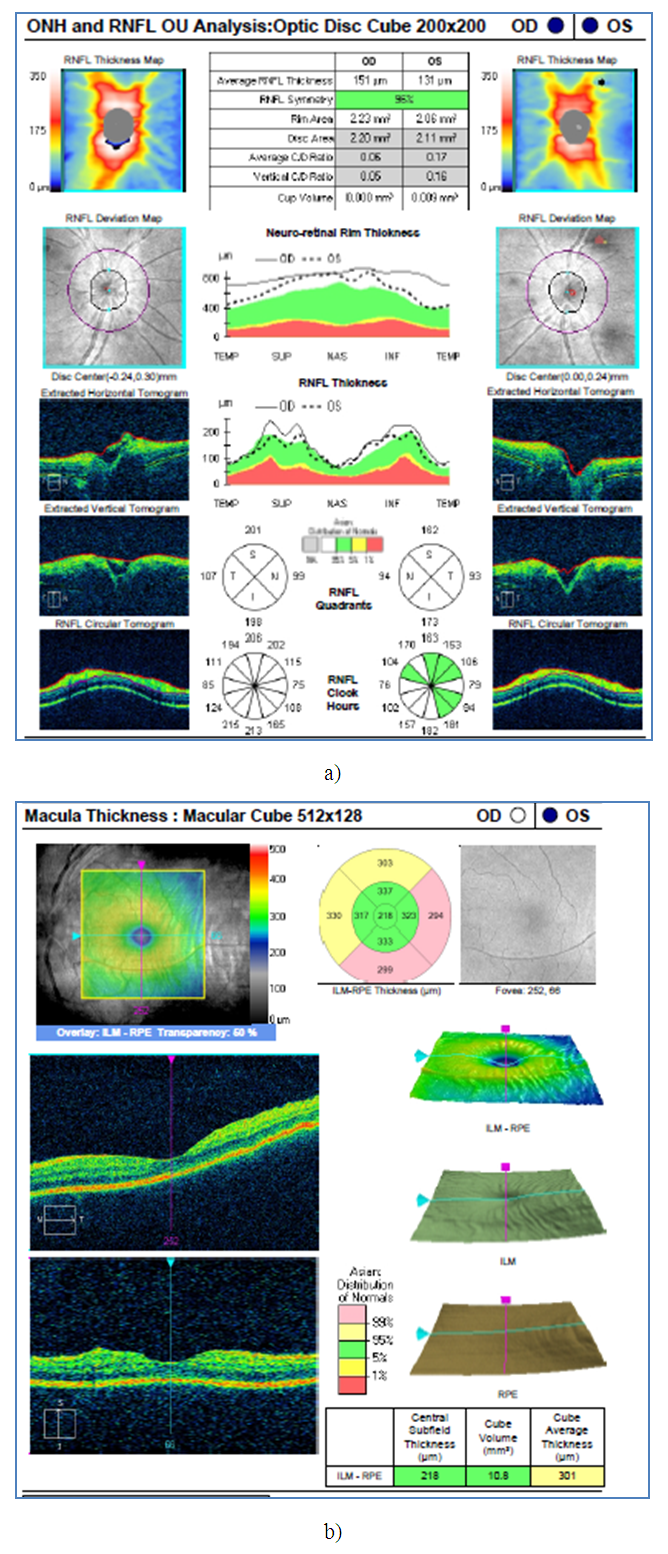 | Figure 5. Optical coherence tomography of patient A. a) Revealed edema of the optic nerve head and peripapillary region on both sides; b) revealed thickening of the macular area |
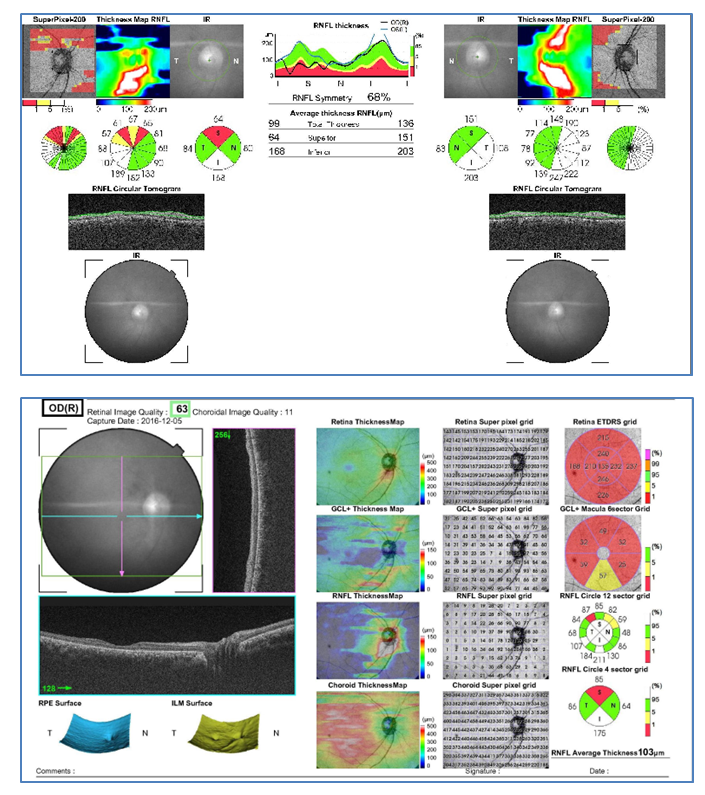 | Figure 6. Optical coherence tomography of patient P. a) revealed thickening of the optic nerve head and peripapillary region on both sides; b) revealed thickening of the macular area |
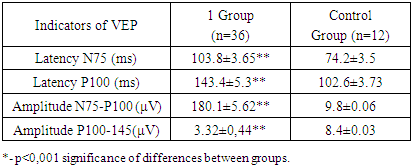
5. Conclusions
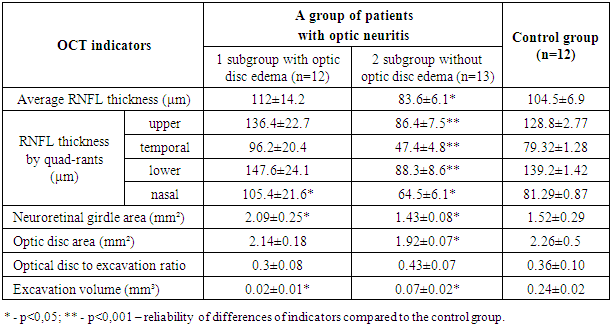
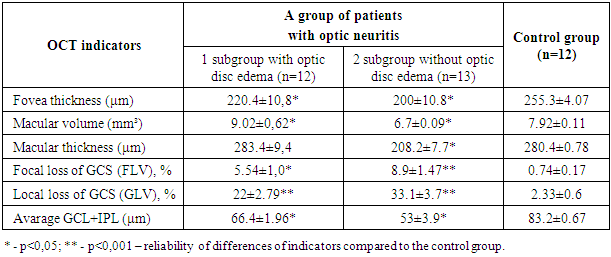
- The main clinical and functional criteria of optic neuritis against the background of neuromyelitis optica were revealed: decreased daytime vision compared with twilight (in 52.7% of cases), decreased contrast (80.5%), Utgoff's symptom (58.3%), remitting vision restoration (27.7%), a paradoxical reaction of the pupils to light (79.7%).The analysis of VEP revealed significant differences in the nature of latency and amplitude in patients with optic neuritis on the background of neuromyelitis optica. Latency indicators N75 and P100 increased by an average of 40-45% compared to the norm. Changes in latency are considered as indicators of dysfunction of the visual pathway when pathologies of the eye and retina are excluded. Pathological lengthening of latency during monocular stimulation indicates unilateral dysfunction of the visual pathway. Bilateral changes in latencies suggest bilateral dysfunction of the visual pathway. The amplitude of N75-P100 decreased by 66% μV, which in turn reflects the death of nerve fibers and the transition of the disease from the acute stage to the chronic one.MRI examination of the cervicothoracic spine in patients with optic neuritis revealed areas of pathological intensity in the vertebral body. Therefore, MRI of the spinal cord is an important diagnostic method for detecting neuromyelitis optica.As a result of the study, it was found that OCT has a high diagnostic value in detecting optic neuritis caused by neuromyelitis optica. OCT revealed objective diagnostic criteria for optic neuritis - changes in RNFL thickness, macular volume, GCS thickness and internal plexiform layer.In patients with optic neuritis against the background of neuromyelitis optica, there was an increase in the thickness of RNFL, mainly in the temporal and nasal segment with edema of the optic disc and thinning of the thickness of RNFL in all quadrants with the course of the disease without edema of the optic disc. It was found that a decrease in RNFL is present in patients with high visual acuity, which indicates the presence of a subclinical demyelinating and neurodegenerative process and in the absence of visual disturbances.A smaller area of the optic nerve head and the neuroretinal girdle, a decrease in macular volume and macular thickness in patients with optic neuritis without edema of the optic nerve head were revealed. An increase in the indices of focal and global losses of retinal ganglion cells was revealed in patients with optic neuritis with edema of the optic nerve head, as well as without edema.Our results show the essential importance of the GCS study protocol for characterizing the state of retinal neurons in optic neuritis against the background of neuromyelitis optica. A decrease in the volume of the GCS + IPL complex was found both in optic neuritis with and without edema of the optic nerve head. Therefore, this indicator can be considered as a marker of early diagnosis of optic neuritis in the presence of neuromyelitis optica. Thus, the detection of a decrease in the thickness of the GCS may indicate the demyelinating nature of optic neuritis with the further development of optic nerve atrophy already during the manifestation of the disease. There is a reason to believe that in neuromyelitis optica, GCS changes are detected somewhat earlier than RNFL changes.In the initial stages of the disease, timely OCT is needed to detect these changes, to prescribe appropriate treatment as early as possible in order to reduce the rate of axonal degeneration and the development of optic nerve head atrophy.