-
Paper Information
- Next Paper
- Previous Paper
- Paper Submission
-
Journal Information
- About This Journal
- Editorial Board
- Current Issue
- Archive
- Author Guidelines
- Contact Us
American Journal of Medicine and Medical Sciences
p-ISSN: 2165-901X e-ISSN: 2165-9036
2020; 10(6): 388-392
doi:10.5923/j.ajmms.20201006.08

Possibilities of Magnetic Resonant Spectroscopy in the Diagnostics of Epilepsy in Patients with Cerebral Palsy
 Abstract
 Reference
 Full-Text PDF
 Full-text HTML
Artykova M. A., Nabieva N. A.
Bukhara State Medical Institute Named after Abu Ali ibn Sina Ministry of Health of Uzbekistan
Copyright © 2020 The Author(s). Published by Scientific & Academic Publishing.
This work is licensed under the Creative Commons Attribution International License (CC BY).
http://creativecommons.org/licenses/by/4.0/

Epilepsy is one of the most complex medical and social problems [2]. The high prevalence of the disease in the children's population of Uzbekistan (10 cases per 1000 population) determines the need to develop effective measures for early diagnosis, the search for new approaches to the correction of clinical manifestations and the prevention of complications of epilepsy [1]. MRI and CT are, in essence, representatives of structural neuroimaging, that is, they identify exclusively organic disorders, leaving any functional shifts beyond the boundaries of recognition. Meanwhile, it is functional disorders that are the area of special interest in epileptology [7]. The immense sensitivity of MRI allowed us to create a special type of MP studies capable of identifying significant changes in the functional state of the brain - primarily in aspects of regional cerebral blood flow and metabolic activity. This type of tomography is called functional MRI. Nuclear Magnetic Resonance Spectroscopy.
Keywords: Magnetic resonance spectroscopy, Epilepsy, Cerebral palsy
Cite this paper: Artykova M. A., Nabieva N. A., Possibilities of Magnetic Resonant Spectroscopy in the Diagnostics of Epilepsy in Patients with Cerebral Palsy, American Journal of Medicine and Medical Sciences, Vol. 10 No. 6, 2020, pp. 388-392. doi: 10.5923/j.ajmms.20201006.08.
1. Introduction
- NMR spectroscopy is a spectroscopic method for studying chemical objects using the phenomenon of nuclear magnetic resonance. The most important for chemistry and practical applications are proton magnetic resonance spectroscopy (NMR spectroscopy), as well as NMR spectroscopy on carbon-13 nuclei (13C NMR spectroscopy), fluorine-19 (19F NMR spectroscopy), phosphorus-31 (31P NMR -spectroscopy). Like infrared spectroscopy, NMR reveals information about the molecular structure of chemicals. However, it provides more complete information than IP, making it possible to study dynamic processes in a sample — to determine the rate constants of chemical reactions and the magnitude of the energy barriers of intramolecular rotation [17].Magnetic resonance spectroscopy (MR spectroscopy) makes it possible to non-invasively obtain information on metabolic changes in the brain. Proton lH - MR spectroscopy is based on a "chemical shift" - a change in the resonant frequency of protons that make up various chemical compounds. For the first time in science, spectroscopy was introduced by the scientist N. Ramsey in 1951 to indicate the difference between the frequencies of individual spectral peaks of various metabolites. The following metabolites and their chemical shift values, the peaks of which are determined in vivo in the proton MR spectrum, are mainly studied:• NAA - N-acetyl aspartate (2.0 ppm);• Cho - choline (3.2 ppm);• Cr - creatine (3.03 and 3.94 ppm);• mI - myoinositol (3.56 ppm);• Glx - glutamate and glutamine (2.1 -2.5 ppm);• Lac - lactate (1.32 ppm);• Lip - lipid complex (0.8-1.2 ppm).Mostly single-voxel and multivoxel (Chemical shift imaging) MR spectroscopy is used - a one-time determination of spectra from several parts of the brain. In single-voxel 1H-MR spectroscopy, only one region (voxel) of the brain is selected for analysis. Studying the composition of frequencies in the signal recorded from this voxel, we determine the distribution of peaks of various metabolites on the chemical shift scale (ppm). The ratio between the peaks of metabolites in the spectrum, a decrease or increase in the height of individual peaks of the spectrum, allows non-invasive assessment of biochemical processes occurring in tissues.MRS is used as an additional mode to routine MR imaging. By comparing the relative concentrations of metabolites in the studied areas of the brain, one can assess the viability and energy metabolism of nerve tissue, proliferation and destruction of cell membranes, and necrotic transformation of the brain. The main focus is on proton MPC (1H-MPC), since hydrogen is most common in the human body.In the results, an MR spectrogram is a graphical representation of the peaks of various brain metabolites.MR spectrogram includes quantitative and qualitative indicators. Qualitative ones include the presence or absence of major metabolites. quantitative include the value of the integral peak area, the ratio of the amplitudes of the main metabolites.Based on the foregoing, the aim of the study was to assess the information content of MRI spectroscopy in children with cerebral palsy with symptomatic epilepsy (SE).The studies were conducted in 42 children, of which 26 children with cerebral palsy complicated by epilepsy (the main group) in which no structural changes were detected in MRI and CT studies. Also, for the control group, we studied the analysis of MR spectroscopy in 16 practically healthy children who did not have paroxysmal seizures, which were studied in the brain during other examinations. The age of children ranged from 1 to 14 years.The debut of epileptic seizures was noted from the moment of birth to 14 years, the average age of the debut was 4.2 ± 0.96 years. The duration of the disease averaged 3.2 ± 0.47 years. Patients underwent examination and treatment at the Department of Pediatric Neurology of the Bukhara Children's Regional Multidisciplinary Center from 2016 to 2018.MRI and MRS studies were performed on a 1.5T Signa Excite HD (GE) scanner. To accurately localize the region of interest (OI) for recording 1H spectra in vivo, MR images were obtained in three orthogonal projections.For quantitative and qualitative analysis of the peaks of the main metabolites, such as N-acetyl aspartate (NAA), creatinine (Cr), choline (Cho), lactate (Lac) was carried out in various areas of interest:- white matter of the frontal lobes,- the white matter of the temporal lobes,- inner capsule,- semi-oval center- shell- hippocampusStatistical analysis for comparison groups was performed using the Statistica 6.0 software package (StatSoft, Inc., USA).
2. The Results of the Study
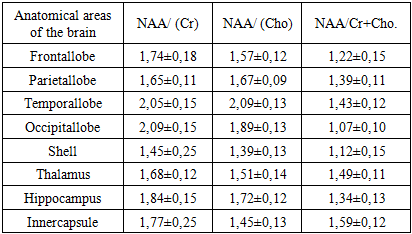
- In our study, the peak ratio of the following metabolites was studied: N-acetyl aspartate (NAA), choline (Cho), creatine (Cr). When analyzing the obtained data, it was found that in the white matter of the frontal lobes, the ratio of NAA / choline metabolites (Cho) averaged 1.57 ± 0.12, in the temporal lobes this ratio was slightly increased and averaged 2.09 ± 0. 13, the smallest values of 1.39 ± 0.13 and 1.51 ± 0.14 were recorded in the thalamus, shell and inner capsule. In the hippocampus, the average values of this ratio were 1.72 ± 0.12 (Table 1). The ratio of the metabolites of NAA / creatine (Cr) were more increased compared to the ratio of NAA / choline (Cho). Especially high average values were recorded in the white matter of the temporal and occipital lobes (2.05 ± 0.15 and 2.09 ± 0.13, respectively). In the remaining parts of the cerebral hemispheres, this ratio was practically in the same ranges.
|
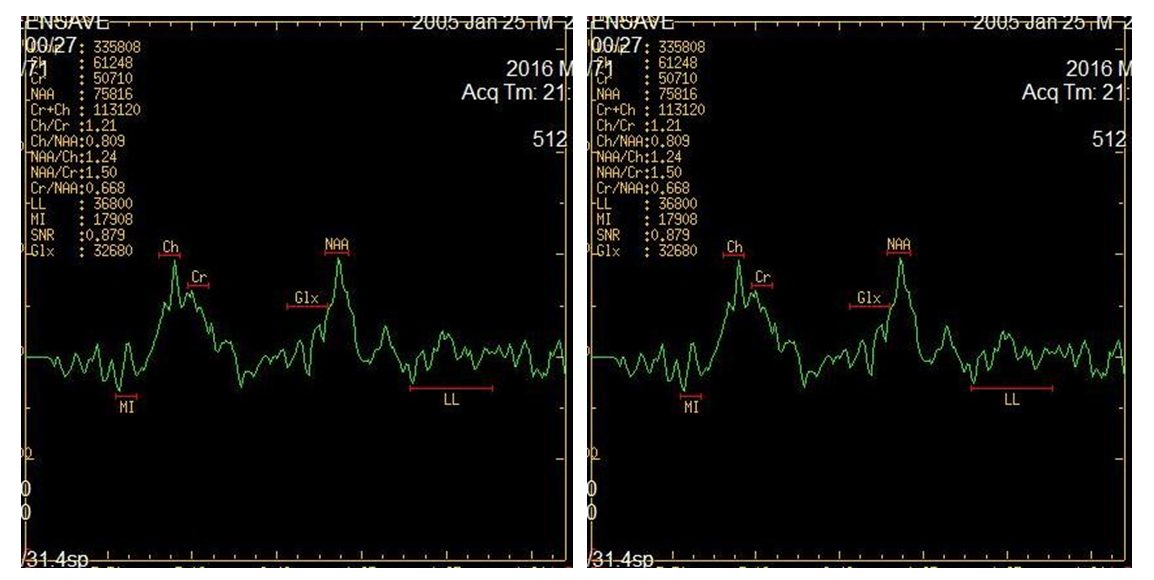 | Figure 1. Child S., 7 years old. H1-MRS - on a single-voxel spectrogram, the ratio of NAA (N-acetyl aspartate) and Cr (creatine) and Cho (choline) in the left temporal region is normal. Child A., 5 years old. H1-MRS - on a single-voxel spectrogram, the ratio of NAA (N-acetyl aspartate) and Cr (creatine) and Cho (choline) in the projection of the internal capsule within the standard ratios |
|
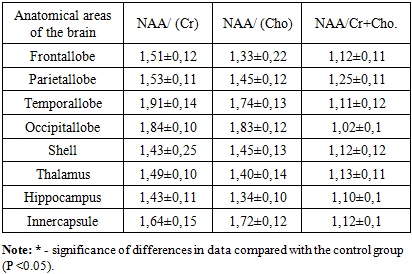
 | Figure 2. Patient A., 6 years old, with symptomatic focal epilepsy without structural changes in routine MRI. MRI spectroscopy: on a single-voxel spectrogram, a decrease in the level of NAA (N-acetyl aspartate) and an increase in the level of Cr (creatine) and Cho (choline) in the hippocampus on the right are determined |
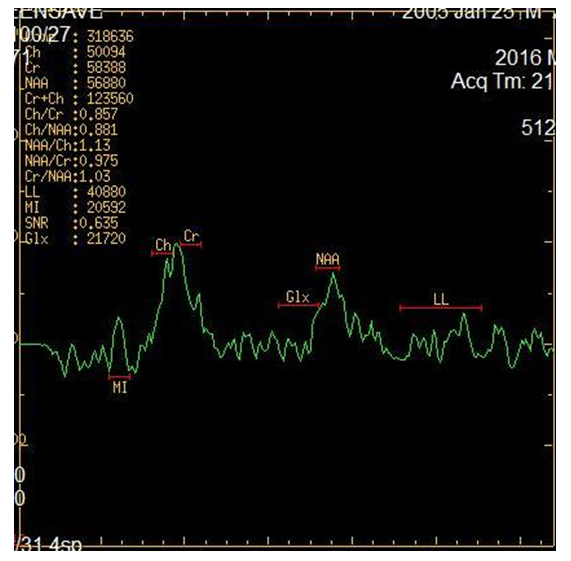
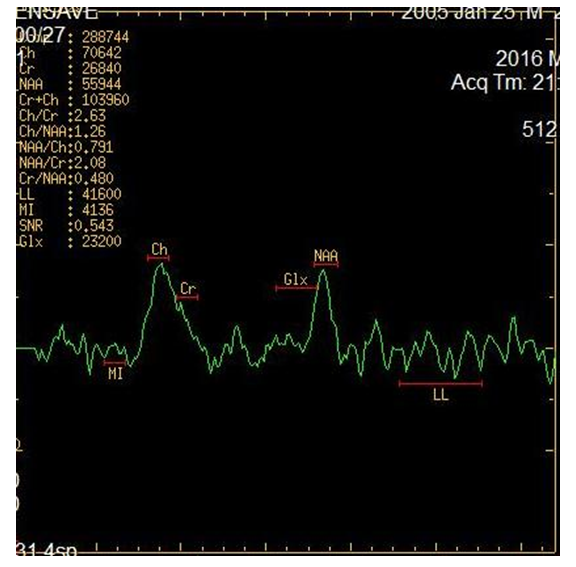 | Figure 3. Patient S., 9 years old, cerebral palsy with SE without structural changes according to the standard MRI protocol. H1-MRS - on a single-voxel spectrogram, a decrease in the level of NAA (N-acetyl aspartate) and an increase in the level of Cr (creatine) and Cho (choline) in the temporal regions on both sides are determined |
3. Conclusions
- As a result of the study, it was found that based on the obtained qualitative and quantitative indicators on MR spectroscopy, the anatomical localization of metabolic processes is determined, which characterizes the state of the white matter of the brain. The use of 1H-MR spectroscopy is an addition to the standard MRI study, which characterizes the biochemical control of the main metabolites of the brain and the effectiveness of therapeutic measures, which is especially important in pediatric neuroradiology.