-
Paper Information
- Paper Submission
-
Journal Information
- About This Journal
- Editorial Board
- Current Issue
- Archive
- Author Guidelines
- Contact Us
American Journal of Medicine and Medical Sciences
p-ISSN: 2165-901X e-ISSN: 2165-9036
2019; 9(3): 81-84
doi:10.5923/j.ajmms.20190903.03

Does Any Correlation Exist between Subjectively/Visually Scored Colour Intensity and Spectrophotometric Absorbance (Optical Density, OD) of Methanol Extract of Coconut Water Phytochemicals?
 Abstract
 Reference
 Full-Text PDF
 Full-text HTML
Ajobiewe H. F. 1, 2, Ajobiewe J. O. 1, 2, 3, Egbe J. O. 2, Mbagwu T. T. 4
1National Open University of Nigeria, Jabi, Nigeria
2Biological Sciences Department, Bingham University Karu, Nasarawa State of Nigeria
3Microbiology Department National Hospital Abuja, Plot 132, Garki Central District Abuja F.C.T., Nigeria
4Department of Biological Sciences Bingham, University Karu, Nasarawa State of Nigeria
Correspondence to: Ajobiewe H. F. , National Open University of Nigeria, Jabi, Nigeria.
| Email: |  |
Copyright © 2019 The Author(s). Published by Scientific & Academic Publishing.
This work is licensed under the Creative Commons Attribution International License (CC BY).
http://creativecommons.org/licenses/by/4.0/

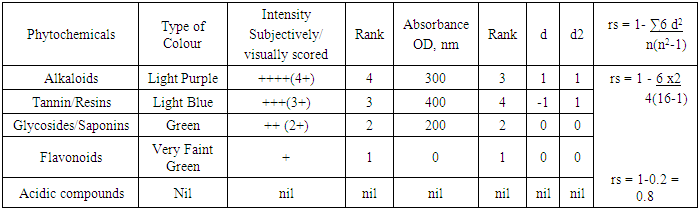
This study is aimed at probing the likelihood of correlation between subjectively scored colour intensity and spectrophotometric absorbance, OD, of methanol Phytochemical extracts of Coconut Water. In resource poor settings, quick evaluation of certain scientific facts of interest sometimes could be a mirage due to the non-availability of the equipment of choice for such important investigation. The method adopted in this study involved the methanol extraction of Coconut Phytochemicals as developed by Trease and Evans in 1983. The Spearman’s Ranked Correlation Coefficient statistics technique was used to test the level of correlation between the visually scored colour intensity of the phytochemicals of interest and their spectrophotometric ally measured absorbance values at 200nm to 600 nm. The targeted Phytochemicals were Alkaloids, Glycosides, Saponins, Tannins, Resins, Acidic compounds and Flavonoids. The Result revealed that Alkaloids that were subjectively scored 4+ with light Purple colour intensity had absorbance, OD, of 300nm. Tannins and Resins, scored 3+ each, with Light Blue colour intensity, had absorbance, OD, of 400nm. Glycosides and Saponin each separately scored 2+, with Green colour intensity had absorbance, OD, of 200 nm. While no colours were detected in Flavonoids and Acidic compounds and as such their absorbances could not be evaluated. Positive and high Spearman’s ranked correlation value of 0.8 was obtained on testing the correlation between the absorbance values and the visual scores. In conclusion, it is suggested that in resource poor settings, careful visual appraisal of colour intensity of phytochemicals could accurately compare their standard spectrophotometric absorbance measurement.
Keywords: Spectrophotometer, Absorbance, Subjective, Visual, Optical Density, Phytochemicals
Cite this paper: Ajobiewe H. F. , Ajobiewe J. O. , Egbe J. O. , Mbagwu T. T. , Does Any Correlation Exist between Subjectively/Visually Scored Colour Intensity and Spectrophotometric Absorbance (Optical Density, OD) of Methanol Extract of Coconut Water Phytochemicals?, American Journal of Medicine and Medical Sciences, Vol. 9 No. 3, 2019, pp. 81-84. doi: 10.5923/j.ajmms.20190903.03.
1. Study Background
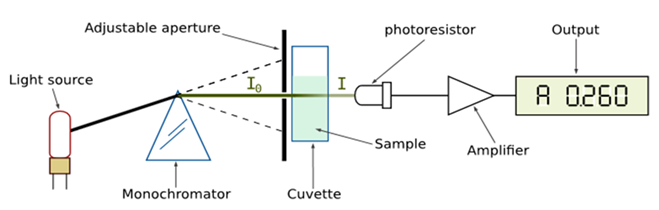
- Natural phytochemicals derived from medicinal plants have gained significant recognition in the potential management of several human clinical conditions including cancer [1]. “Phyto” is the Greek word for plant. There are many phytochemicals and they help the human body in a variety of ways. Phytochemicals may protect human from a host of diseases. They are non-nutritive plant chemicals that have protective or disease preventive properties, plant produce these chemicals to protect itself but recent research demonstrates that many phytochemicals can protect human against diseases. There are many phytochemicals in fruits and herbs and each works differently [1]. The Coconut, Cocos nucifera, has been described as “the tree of life” or the tree of heaven and nature’s greatest gift to man. Each item of the Coconut tree can be used to produce items of value for the community [1]. The present investigation’s interest focuses on one of these which are the phytochemicals extractable from the coconut water using methanol. The phytochemicals are divided into two: primary metabolites such as sugar and fats which are found in all plants and secondary metabolites which are found in smaller range of plants, serving a more specific function. It is these secondary metabolites and pigments that can have therapeutic actions in human and which can be redefined to produce drugs. Examples include, inulin, from the roots of dahlias, quinine from cinchoma, morphine and codeine from the poppy and digoxin from foxglove [2]. Many of these phytochemicals have beneficial effects on long term health when consumed by humans and can effectively be used to treat human diseases [3]. Chemical compounds in plant mediate their effects on the human body through processes identical to those of chemical compounds in conventional drugs. Thus, herbal medicines do not differ greatly from conventional drugs [3]. Most cultures have a traditional way of using plants medicinnally. Modern medicine now tends to use the active ingredients of plants rather than the whole plant. The phytochemicals may be synthesized, compounded or otherwise transformed to make pharmaceuticals. Examples of such derivations include, Capsaicine from Chili, Aspirin which is chemically related to Salicylic acid found in White Willow e.t.c. [3]. The concentration of these phytochemicals can be measured subjectively or visually, through gravimetric analysis without using any special expensive equipment that could be unaffordable in resource poor settings/facilities. However, in resource adequate facilities, phytochemicals in their native states can be quantified, characterized, and measured using the chemical instrument called Spectrophotometer. It is a specific and powerful device used in biological and chemical sciences , which measures the absorption of a monochromatic light beam by a sample and added reagent .i.e. it operates by just shining a beam of light filtered to a specific wavelength (or very narrow range of wavelength), through a sample and onto a light meter. An absorbance Spectrophotometer is an instrument that measures the fraction of incident light transmitted through a solution. In other words, it is used to measure the amount of light that passes through a sample material and, by comparison to the initial intensity of light reaching the sample, they indirectly measure the amount of light absorbed by that sample. Spectrophotometers are designed to transmit light of narrow wavelength ranges. Because different compounds absorb light at different wavelengths, a spectrophotometer can be used to distinguish compounds by analyzing the pattern of wavelengths absorbed by a given compound.Briefs on Some Technical DetailsWhen studying a compound in solution by spectrophotometry, you put it in sample holder called a cuvette and place it in the spectrophotometer. Light of particular wavelength passes through the solution inside the cuvette and the amount of light transmitted (passed through the solution –Transmittance) or absorbed (Absorbance) by the solution is measured by a light meter. While a Spectrophotometer can display measurements as either transmittance or absorbance. The spectrophotometer actually measures transmittance: %T = (IT/I0)*100. This is the intensity of light transmitted through the solution (IT divided by the intensity of light entering the solution, the incident light (I0). The problem with this measurement is that as the solution becomes more concentrated the percentage transmittance, %T decreases [4]. When making transmission measurements, the spectrophotometer quantitatively compares the fraction of light that passes through a reference solution and a test solution, then electronically compares the intensities of the two signals and computes the percentage of transmission of the sample compared to the reference standard. For reflectance measurements, the spectrophotometer quantitatively compares the fraction of light that reflects from the reference and test samples. Light from the source lamp is passed through a monochromator, which diffracts the light into a "rainbow" of wavelengths through a rotating prism and outputs narrow bandwidths of this diffracted spectrum through a mechanical slit on the output side of the monochromator. These bandwidths are transmitted through the test sample. Then the photon flux density (watts per metre squared usually) of the transmitted or reflected light is measured with a photodiode, charge coupled device or other light sensor. The transmittance or reflectance value for each wavelength of the test sample is then compared with the transmission or reflectance values from the reference sample. Most instruments will apply a logarithmic function to the linear transmittance ratio to calculate the 'absorbency' of the sample, a value which is proportional to the 'concentration' of the chemical being measured.In short, the sequence of events in a modern spectrophotometer is as follows:1. The light source is shone into a monochromator, diffracted into a rainbow, and split into two beams. It is then scanned through the sample and the reference solutions.2. Fractions of the incident wavelengths are transmitted through, or reflected from, the sample and the reference.3. The resultant light strikes the photo detector device, which compares the relative intensity of the two beams.4. Electronic circuits convert the relative currents into linear transmission percentages and/or absorbance/ concentration values.In an array spectrophotometer, the sequence is as follows [11]:1. The light source is shone into the sample and focused into a slit.2. The transmitted light is refracted into a rainbow with the reflection grating.3. The resulting light strikes the photo detector device which compares the intensity of the beam.4. Electronic circuits convert the relative currents into linear transmission percentages and/or absorbance/ concentration values.Many older spectrophotometers must be calibrated by a procedure known as "zeroing", to balance the null current output of the two beams at the detector. The transmission of a reference substance is set as a baseline (datum) value, so the transmission of all other substances is recorded relative to the initial "zeroed" substance. The spectrophotometer then converts the transmission ratio into 'absorbency', the concentration of specific components of the test sample [12] relative to the initial substance. [5]
 METTLER TOLEDO UV5Nano Micro-Volume Spectrophotometer Samples are usually prepared in cuvettes; depending on the region of interest, they may be constructed of glass, plastic (visible spectrum region of interest), or quartz (Far UV spectrum region of interest). Some applications require small volume measurements which can be performed with micro-volume platforms.
2. Statement of Problem
- Our statement of problem which also forms the core of our research question is, Does any correlation exist between visually /subjectively scored colour intensity using gravimetric assay and the advanced Spectrophotometric absorbance /transmittance/reflectance (Optical Density, OD) assay of methanol extract of coconut water phytochemicals?: HypothesisH0: No Significant correlation exist between subjectively /visually scored Phytochemical colour intensity of methanol coconut water extract and its Spectrophotometric absorbance, OD.Ha: Significant correlation exist between subjectively /visually scored Phytochemical colour intensity of methanol coconut water extract and its Spectrophotometric absorbance, OD.
3. Result
- Alkaloids had score of 4+ with light Purple colour intensity and an absorbance, OD, of 300nm. Tannins and Resins, scored 3+ each, with Light Blue colour intensity, and absorbance, OD, of 400nm. Glycosides and Saponin each separately scored 2+, with Green colour intensity had absorbance, OD, of 200 nm.
4. Discussion
- The Spearman’s positive rank correlation coefficient was high, 0.8, the level of correlation, therefore, between the visual/subjective scores and the absorbance values, or the optical density, OD was very high. We therefore have no enough evidence to reject the alternative hypothesis Ha, hence it was retained. In other words, significant correlation exists between the subjectively scored colour intensity of the methanol extract of coconut water Phytochemicals and their corresponding Spectrophotometric absorbance values. The targeted Phytochemicals were Alkaloids, Glycosides, Saponins, Tannins, Resins, Acidic compounds and Flavonoids. The Result revealed that Alkaloids that were subjectively scored 4+ with light Purple colour intensity had absorbance, OD, of 300nm. Tannins and Resins, scored 3+ each, with Light Blue colour intensity, had absorbance, OD, of 400nm. Glycosides and Saponin each separately scored 2+, with Green colour intensity had absorbance, OD, of 200 nm. While the colour detected in Flavonoids was very faint green scored 1+, this was however undetectable by the Spectrophotometer, hence the absorbance recorded was nil. All the visual and spectrophotometric scores agreed with the earlier work conducted by Adeloye (2007) [4]. Acidic compounds had no colour detected at all and as such their absorbances could not be evaluated.
5. Conclusions
- In conclusion, it is suggested that in resource poor or limited settings, careful visual appraisal of colour intensity of phytochemicals could accurately compare their standard spectrophotometric absorbance measurement based on the observations made above.