G. S. Rakhimbaeva, J. B. Mirzoev
Tashkent Medical Academy, Uzbekistan
Copyright © 2019 The Author(s). Published by Scientific & Academic Publishing.
This work is licensed under the Creative Commons Attribution International License (CC BY).
http://creativecommons.org/licenses/by/4.0/

Abstract
The problem of secondary brain ischemia at nontraumatic intracranial hemorrhages is the most actual one among practical neurologists. The most available noninvasive methods are multislice computer tomography and transcranial Dopplerography. The results of the use of these methods for early diagnostics of the secondary brain ischemia have been given. Noninvasive methods allow to prevent the severity of the disease course and to improve the prognosis of secondary brain ischemia.
Keywords:
Intracranial hemorrhage, Secondary ischemia, Neurovisualization
Cite this paper: G. S. Rakhimbaeva, J. B. Mirzoev, Noninvasive Methods of Neurovisualization in the Diagnostics of Secondary Ischemia at Nontraumatic Intracranial Hemorrhages, American Journal of Medicine and Medical Sciences, Vol. 9 No. 1, 2019, pp. 28-34. doi: 10.5923/j.ajmms.20190901.05.
1. Introduction
In spite of big achievements in the diagnostics and treatment of nontraumatic intracranial hemorrhages (NICH) the issues of secondary ischemia (SI) remain actual due to the development of cerebral arteries spasm which is clinically manifested by the deterioration of patient’s condition, augmenting of neurologic deficiency. The SI is mostly developed at the NICH of medium and big sizes and at subarachnoid hemorrhage (SAH). Intracerebral hematomas, as a rule, are not followed by angiospasm and further development of SI. But when NICH of small size is complicated by the breach to the ventricular system or to subarachnoid cavity, the possibility for SI development is sharply increased [7, 12].The secondary ischemia due to the cerebral angiospasm (CAS) is a main cause of the death and invalidity in the patients with NICH and SAH [4]. In spite of the SAH mortality rate reduction to 50% for the last 20 years, a revealed CAS is the most frequent complication in almost 70% of patients with SAH [9]. The CAS has its temporal features: its onset occurs 3-5 days after the appearance of SAH first symptoms, its peak occurs on the 14th day and then its resolution goes on gradually during 2-4 weeks. So called «Golden standard» in the diagnostics of SI developed due to the CAS is a cerebral angiography (CAG). But actually a performing of CAG is not always made because of the following reasons: the severity of patient’s condition, patient’s intolerance to iodine contained contrast drugs and the absence of angiographic machine in the hospital. Noninvasive methods of neurovisualization such as native MSCT and transcranial Dopplerography (TCDG) have big practical value in the diagnostics and treatment of secondary ischemia and cerebral angiospasm.
2. Aim
To study the role of noninvasive methods of neurovisualization - MSCT and transcranial Dopplerography in the diagnostics of secondary ischemia and cerebral angiospasm at nontraumatic intracranial hemorrhages.
3. Materials and Methods
60 patients with hemorrhagic stroke at the age of 36-85 years (mean age 52.4±8.6) have been examined. There were 34(56.6%) men and 26(43.4%) women in the acute period of stroke. All the patients were divided into 2 groups. The 1st group was made up from 24(40%) patients who had the signs of secondary ischemia development 3-5 days after the admission. The 2nd group was made up from 36(60%) patients without secondary ischemia signs. All patients were performed MSCT investigation of the brain at admission. The presence or absence of brain secondary ischemia was verified by repeated MSCT investigations 3-5 days after the admission. The cerebral angiospasm was determined by TCDG. The neurological state estimation was performed using the scales of Glasgow, NIHSS, Rankin at the admission and in the dynamics on the 3rd and on the 7th days of hospital staying. For the objectification of cerebral angiospasm and the development of brain secondary ischemia areas the patients with SI were divided into 2 subgroups: the 1st one – 8 (33.4%) patients with a dislocation of the median structures and the 2nd one – 16 (66.6%) patients without the dislocation of the brain median structures.
4. Results
The features of CAS were estimated by 2 groups of indices – clinical indices estimated by the scales of Glasgow, NIHSS, Rankin and instrumental ones – by MSCT and TCDG data. Deterioration of patients’ condition began from the 3rd day of admission (constriction of consciousness level, augmenting of nidal neurological deficiency and occurrence of meningeal symptomatology) and was estimated as the development of secondary ischemia (Fig.1, 2, 3).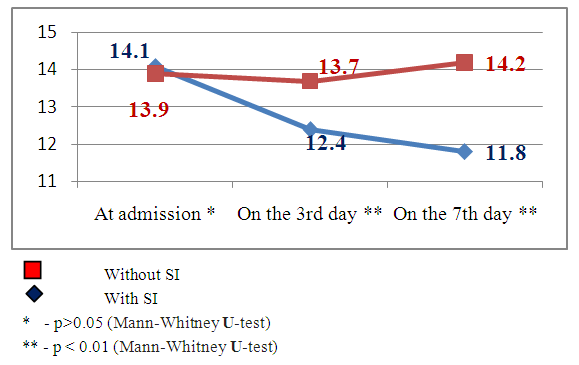 | Figure 1. Dynamics of consciousness level indices by the Glasgow scale in the patients with and without secondary ischemia (SI) against the background of hemorrhagic stroke |
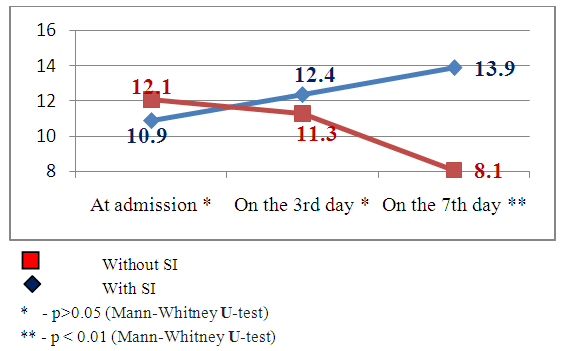 | Figure 2. Dynamics of neurological deficiency indices by the NIHSS scale in the patients with and without secondary ischemia (SI) against the background of hemorrhagic stroke |
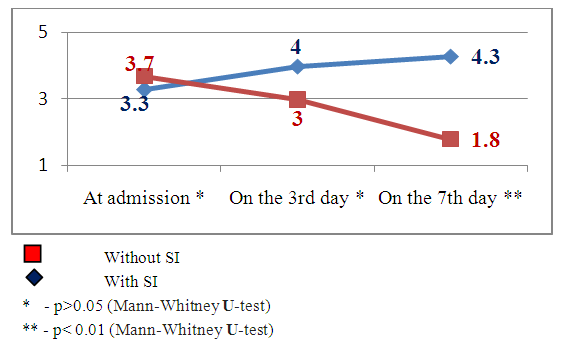 | Figure 3. The dynamics of neurological deficiency indices by the Rankin scale in the patients with and without secondary ischemia (SI) against the background of hemorrhagic stroke |
Clinical indicesThe estimation of consciousness level by the Glasgow’s scale at the admission, 3 and 7 days after admission showed that in patients with SI we observed constriction of consciousness level from «medium» torpor (mean point 14.1±1.25) to spoor (mean point 11.8±1.7), dispersion analysis by Friedman showed statistically significant changes of the indices (χ2=17.1 р<0.01). The analysis of consciousness level of the patients with hemorrhagic stroke but without secondary ischemia showed that against the background of the conducted therapy it was pointed a clearing up of the consciousness from a «deep»torpor(mean point 13.9±1.4) to «medium» torpor (mean point 14.2±0.9). Dispersion analysis by Friedman made up χ2=16.2 р<0.01. Consciousness level indices 7 days after hospital staying had statistically significant difference between patients with SI and without SI: mean point in the patients with SI made up 11.8±1.7, in the patients without SI – 4.2 ±0.9 (U-test=148.9 р<0.01).The estimation of neurological deficiency level and its dynamics was carried out on the base of NIHSS scale. In the dynamics of neurological state in the patients with SI we pointed the tendency to the augmenting of nidal deficiency. So, mean point by the NIHSS scale at admission made up 10.9±2.9, on the 7th day – 13.9±3.1 (Friedman’s dispersion analysis χ2=8.3 р>0.05). A stable tendency to the regress of neurological deficiency was pointed in the patients without SI. Mean point at admission made up 12.1±3.2, on the 7thday– 8.1±3.2, Friedman’s dispersion analysis showed a significant change of indices (χ2=13.6 р<0.01). The indices of neurological deficiency evidence on the 7th day of hospital staying had statistically significant difference between the patients with SI and the patients without SI: 13.9±3.1 and 8.1±3.2 respectively (U-test=162.8 р<0.01).The estimation of invalidity level and dependence from the outside assistance with its dynamics was carried out by the Rankin’s scale. We also pointed the augmenting of invalidity level in the patients with SI: mean point by the Rankin’s scale at the admission was 3.3±1.4, on the 7th day it made up 4.3±0.9 (Friedman’s dispersion analysis χ2=7.1 р>0.05). In the patients without SI we observed a stable tendency to the improvement. So, mean point at the admission made up 3.7±1.3, on the 7th day– 1.8±1.1 (Friedman’s dispersion analysis χ2=16.1 р<0.01). The indices of neurological deficiency evidence on the 7th day of hospital staying had statistically significant difference between the patients with SI and the patients without SI: 4.3±0.9 and 1.8±1.1 respectively (U-test = 147.7 р<0.01). Instrumental indicesIn the cases of brain secondary ischemia development such as consciousness level narrowing, augmenting of nidal neurological deficiency, occurrence of meningeal signs the patients were performed MSCT of the brain in the dynamics and the area of secondary ischemia was pointed around intracerebral hematoma (Fig.4, 5). 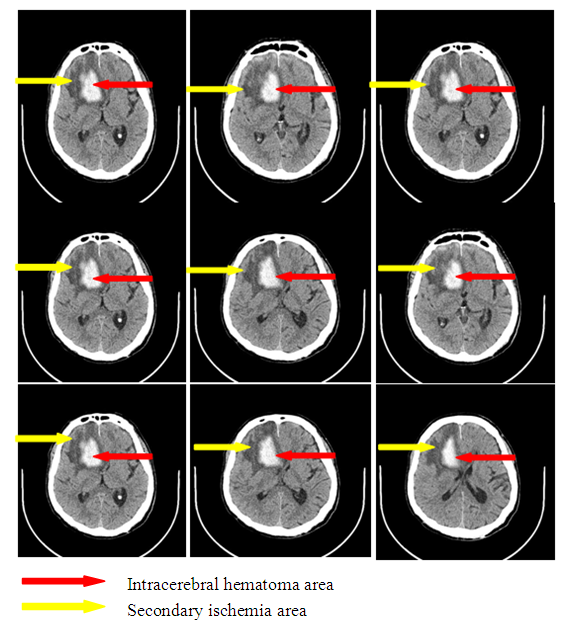 | Figure 4. Intracerebral hematoma in frontoparietal area of the right-brain with secondary ischemia |
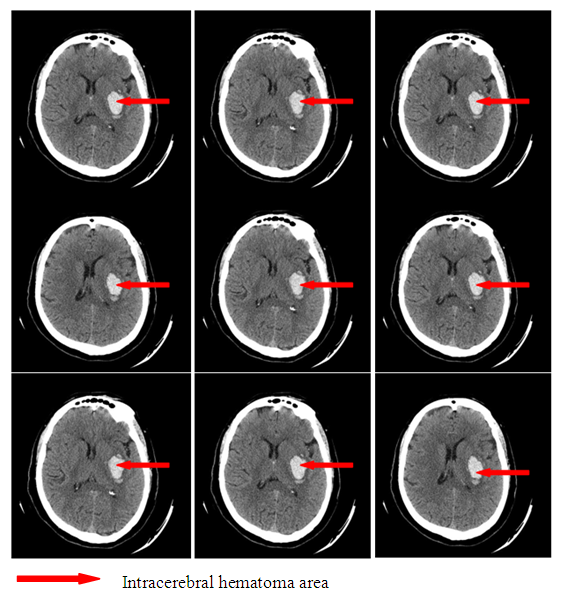 | Figure 5. Intracerebral hematoma in the parietal area of the left-brain without secondary ischemia |
In the patients with SAH at the development of clinical manifestation of SI on the background of CAS the formation of secondary ischemia zone was pointed by the control MSCT of the brain (Fig.6, 7).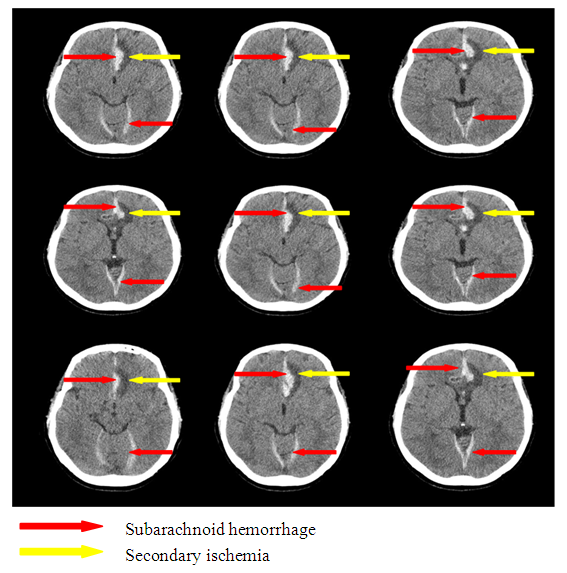 | Figure 6. Subarachnoid hemorrhage with secondary ischemia |
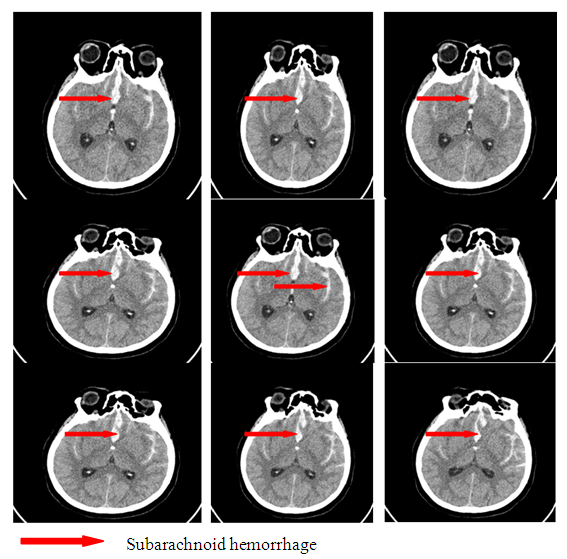 | Figure 7. Subarachnoid hemorrhage without secondary ischemia |
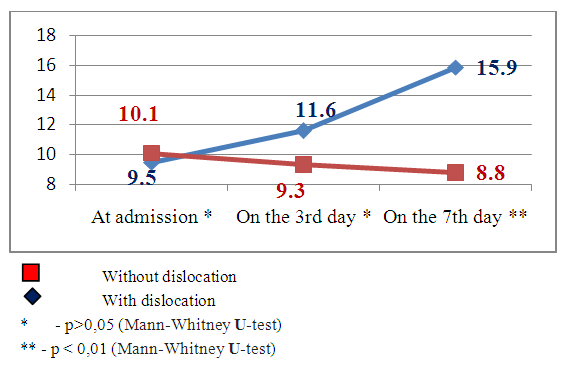
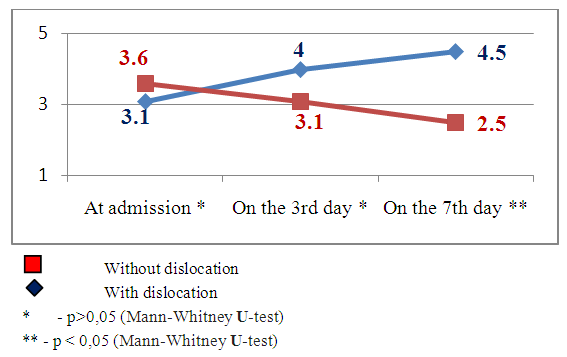
The development of secondary ischemia due to the angiospasm of the cerebral arteries which led to the negative dynamics of consciousness level and neurological deficiency evidence level requires their verification. The patients with SI were divided into the following groups subject to the SI evidence level and according to the presence or absence of brain median structures dislocation: the 1st subgroup – 8 (33.4%) patients with median structures dislocation, the 2nd subgroup –16 (66.6%) patients without median structures dislocation (Fig. 11 and Fig. 12).The most informative and noninvasive method of neurovisualization is a computer tomography method with the help of which 3-5 days after the beginning of hemorrhagic stroke clinics we noted the development of hypodence zone along the periphery around the hemorrhage nidus. The level of secondary ischemia nidus evidence correlates with the size of stroke hematoma nidus. The volume of ischemia nidus can exceed the volume of intracerebral hematoma in several times and can lead to the median structures dislocation causing different types of impaction (Fig.8-10).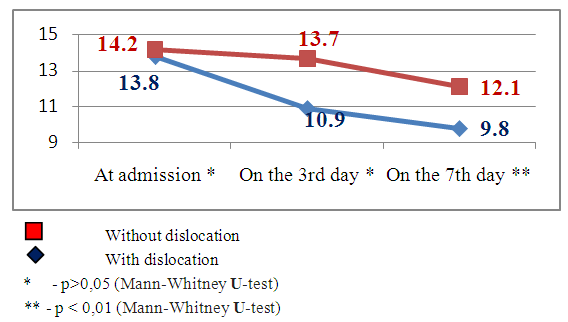 | Figure 8. Dynamics of consciousness level indices by the Glasgow scale in the patients with and without brain median structures dislocation by MSCT data |
 | Figure 9. Dynamics of neurological deficiency indices by the NIHSS scale in the patients with and without brain median structures dislocation subject to SI by MSCT data |
 | Figure 10. The dynamics of neurological deficiency indices by the Rankin scale in the patients with and without brain median structures dislocation subject to SI by MSCT data |
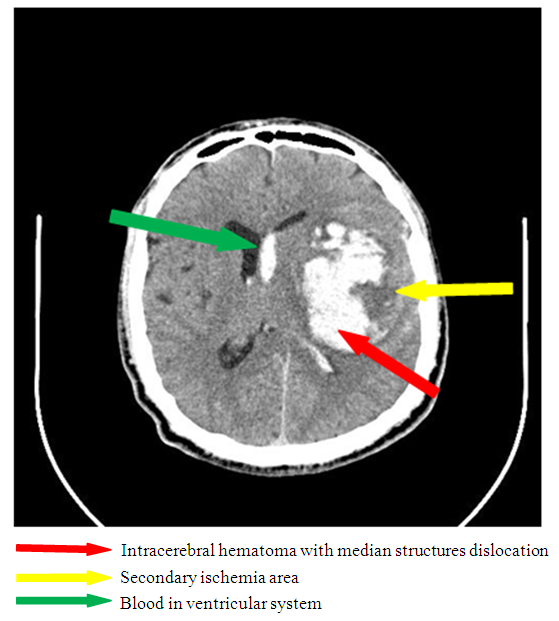 | Figure 11. Secondary ischemia complicated by median structures dislocation (there is a hyperdence zone 7x6 cm in the parietotemporal area of the left-brain leading to the dislocation of median structures to the left on 5mm |
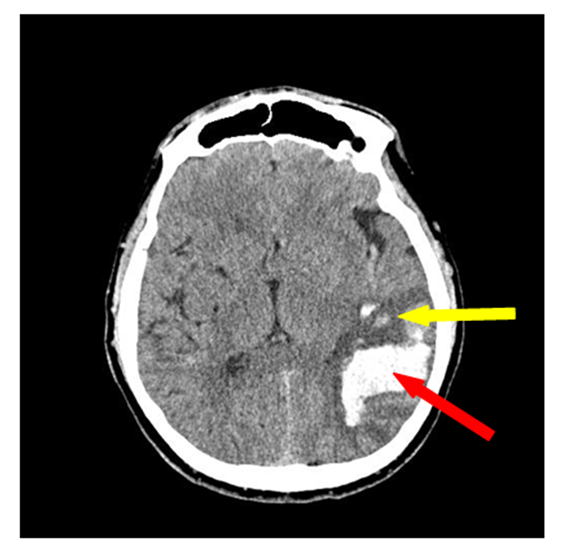 | Figure 12. Secondary ischemia without median structures dislocation (there is a hyperdence zone 4х3 cm in the parietotemporal area of the right-brain with the zone of secondary ischemia without brain median structures dislocation) |
Emerging nidus of the brain tissue secondary ischemia diagnosed by MSCT data 3-5 days after the stroke’s onset and leading to the dislocation of brain median structures has prognostically worse indices than in the patients with SI, but without brain median structures dislocation. This theory has been also improved by our research results. The estimation of consciousness level dynamics showed bigger narrowing of the consciousness on the 7th day in the patients with dislocation of brain median structures (mean point by the Glasgow scale 9.8±1.4) than in the patients without dislocation syndrome (mean point by the Glasgow scale 12.1±1.2), U-test=138.2 р<0.01. The dynamics of neurological deficiency evidence level by the NIHSS scale also showed the presence of more evident neurological deficiency in the patients with SI complicated by the median structures dislocation – mean point by the NIHSS scale made up 15.9±1.5 and in the patients without dislocation - 8.8±1.9 (U-test =178.6 р<0.01). The estimation of invalidity level by the Rankin’s scale also proved the above pointed tendency – mean point by the Rankin’s scale in the patients with SI complicated by the dislocation of brain median structures made up 4.5±0.6 versus 2.5±0.8 points in the patients with SI but without dislocation syndrome (U-test=115.5, р<0.05).The other noninvasive method of diagnostics of the cerebral angiospasm and its estimation is TCDG. Dopplerographic estimation of CAS is based on the direct dependence of blood velocity line (BVL) from volumetric blood flow and inverse dependence from the diameter of vessel’s lumen. K.F. Lindegaard et al. offered to calculate hemispheric index of the blood flow (Lindegaard’s index) for differential diagnostics of CAS from possible hyperemia of brain. Lindegaard’s index is a ratio of blood flow average rate in the medium cerebral artery to the average rate of the blood flow in extracranial segment of internal carotid (in the norm – up to 3.0) [8]. The increase of average blood velocity line (BVL) along medium cerebral artery up to 120 cm per sec and more and Lindegaard’s index – up to 3 and more are regarded as the diagnostic criteria of CAS by TCDG [1-3]. At BVL 120–200 cm/s the cerebral angiospasm is regarded as moderate, more 200 sm per sec – an evident one [2, 14].Our obtained Dopplerographic indices of cerebral hemodynamics testify the presence of moderate and evident levels of CAS in the patients with nontraumatic intracranial hemorrhages. In 8 patients with SI by TCDG data we revealed the CAS signs of evident level: the average volume of BVL along medium cerebral artery made up 165.3±34.8cm per sec on the 3rd day; on the 7th day there was a tendency to the increase of this index – 215.9±43.9cm per sec (W- Wilcoxon’s criterion = 6.1, р<0.05). Average Lindegaard’s index on the 3rd day was 3.1 ± 0.7, on the 7th day it made up 3.6 ± 0.9 (W- Wilcoxon’s criterion = 1.6, р>0.05). In 16 patients with moderate evidence level of CAS the estimated indices of BVL and Lindegaard’s index had a tendency to the increase but not so much. The average index of BVL along the medium cerebral artery made up 137.4±34.8 cm per sec on the 3rd day; on the 7th day it made up 168.1±33.2 cm per sec (W- Wilcoxon’s criterion =5.3, р<0.05). The average Lindegaard’s index on the 3rd day was 2.8 ± 0.7, on the 7th day – 3.1 ± 0.8 (W- Wilcoxon’s criterion = 1.6 р>0.05). The indices of consciousness narrowing level and the evidence of neurological deficiency in the patients with evident signs of CAS were worse than in the patients with moderate CAS (Fig.13, 14).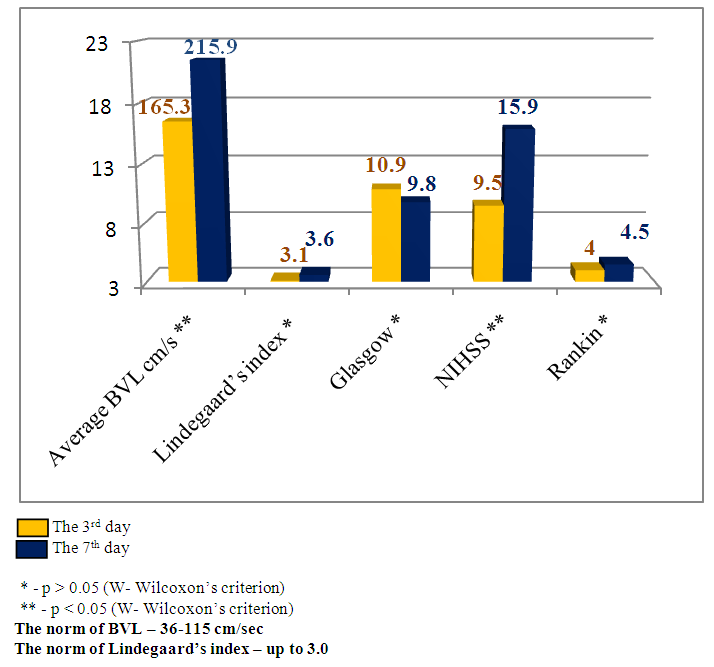 | Figure 13. Clinical-Dopplerographic dynamics of indices in the patients with evident level of CAS |
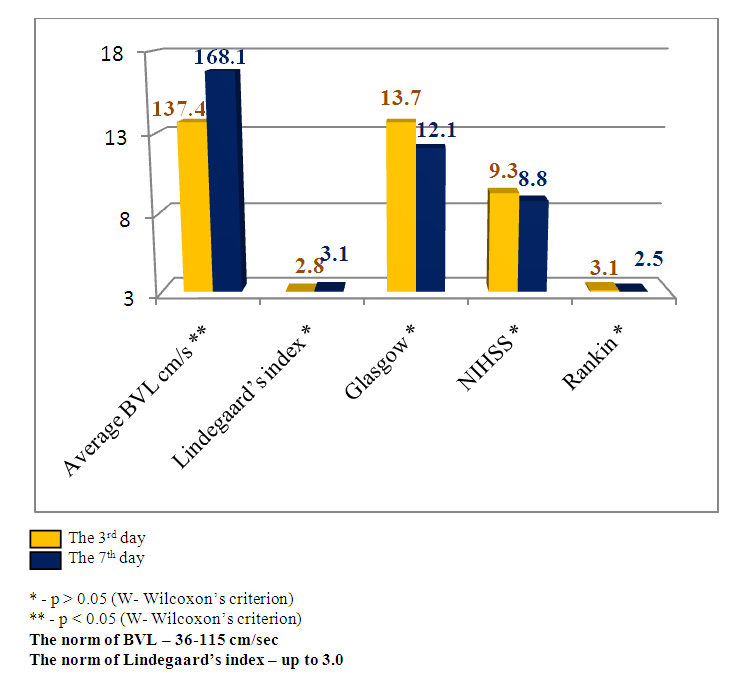 | Figure 14. Clinical - Dopplerographic dynamics of indices in the patients with moderate level of CAS |
5. Discussion
The obtained data proves the hypothesis about secondary ischemia development at nontraumatic ischemic hematomas of the brain. In our patients cohort it achieved 40% in the patients with nontraumatic intracranial hemorrhages (NICH) and it coincides with western authors’ data. 5 years mortality due to NICH by meta-analysis data made up 71% [11]. According to the results of the other research only 22% of patients survived from NICH were completely recovered from neurological deficiency and returned to the full value life [6]. It is necessary to mention that ischemic neurological deficiency is developed in 30% of patients with CAS – so called symptomatic cerebral angiospasm [4]. Symptomatic cerebral angiospasm, by different authors’ data, varies from 17% to 48% [5, 10, 13]. The development of CAS in the acute period of a hemorrhagic stroke sharply complicates its course, aggravates its prognosis and makes a contribution to the mortality development which can reach 71% [11] for 5 years period by meta-analysis data. The further development of diagnostic and treatment standards at NICH will allow to reduce the mortality rate and patients’ invalidity at hemorrhagic stroke.
6. Conclusions
The narrowing of consciousness level, intensification of nidal neurological symptomatology and meningeal signs developing during 3-5 days after the stroke’s onset should be regarded as a manifestation of secondary ischemia due to the development of cerebral angiospasm. Available and noninvasive methods of neurovizualization for the diagnostics of brain secondary ischemia and cerebral angiospasm are multislice computer tomography and transcranial Dopplerography which allow to estimate the evidence level and the sizes of brain perifocal ischemia at intracerebral hematoma with a high level of reliability (р<0.05). The level of consciousness impairment evidence and neurological deficiency correlates with the volume of a developed secondary ischemia and CAS evidence level. The obtained data must be taken into account during the treatment and management of the patients with nontraumatic intracranial hemorrhages complicated by cerebral angiospasm.
Abbreviations
NICH -nontraumatic intracranial hemorrhagesSI -secondaryischemia SAH -subarachnoid hemorrhage CAS -cerebral angiospasmCAG -cerebralangiography TCDG -transcranial DopplerographyMSCT -multislice computer tomography
References
| [1] | Belkin A.A., Alasheev A.M., Inyushkin S.N. Transcranial dopplerography in the intensive therapy. Ekaterinburg: Publishing house of Clinical Institute of brain; 2004. |
| [2] | Konovalov A.N. Clinical guideline on crainiocerebral injury. М.: Antidor; 1998; V. 1–3. |
| [3] | Kuksova N.S., Khamidova L.T., Trofimova E.Yu. The estimation of brain functional state at nontraumatic subarachnoid hemorrhage. Part I. Vascular spasm, brain ischemia and electrical activity. Neurosurgery. 2011; 3: 34–42. |
| [4] | Bederson JB, Connolly EJ, Batjer HH, Dacey RG, Dion JE, Diringer MN, et al. Guidelines for the management of aneurysmal subarachnoid hemorrhage: A statement for healthcare professionals from a special writing group of the Stroke Council, American Heart Association. Stroke. 2009; 40: 994–1025. |
| [5] | Charpentier C, Audibert G, Guillemin F, Civit T, Ducrocq X, Bracard S, et al. Multivariate analysis of predictors of cerebral vasospasm occurrence after aneurysmal subarachnoid hemorrhage. Stroke. 1999; 30: 1402–8. |
| [6] | Hemphill JC III, Farrant M, Neill TA Jr. Prospective validation of the ICH score for 12-month functional outcome. Neurology 2009; 73: 1088–1094. |
| [7] | Kelly PJ, Furie KL, Shafqat S, Rallis N, Chang Y, Stein J. Functional recovery following rehabilitation after hemorrhagic and ischemic stroke. Arch Phys Med Rehabil 2003; 84: 968–972. |
| [8] | Lindegaard K.F., Nornes H., Bakke S.J. et al. Cerebral vasospasm diagnosis by mean of angiography and blood velocity measurements. ActaNeurochir. 1989; 100 (1–2): 12–24. |
| [9] | Lovelock CE, Rinkel GJ, Rothwell PM. Time trends in outcome of subarachnoid hemorrhage: Population-based study and systematic review. Neurology. 2010; 74: 1494–501. |
| [10] | Murayama Y, Malisch T, Guglielmi G, Mawad ME, Vinuela F, Duckwiler GR, et al. Incidence of cerebral vasospasm after endovascular treatment of acutely ruptured aneurysms: Report on 69 cases. J Neurosurg. 1997; 87: 830–5. |
| [11] | Poon MT, Fonville AF, Al-Shahi SR. Long-term prognosis after intracerebral haemorrhage: systematic review and meta-analysis. J NeurolNeurosurg Psychiatry 2014; 85: 660–667. |
| [12] | Van Asch CJ, Luitse MJ, Rinkel GJ, et al. Incidence, case fatality, and functional outcome of intracerebral hemorrhage over time, according to age, sex, and ethnic origin: a systematic review and meta-analysis. Lancet Neurol 2010; 9: 167–176. |
| [13] | Yalamanchili K, Rosenwasser RH, Thomas JE, Liebman K, McMorrow C, Gannon P. Frequency of cerebral vasospasm in patients treated with endovascular occlusion of intracranial aneurysms. AJNR Am J Neuroradiol. 1998; 19: 553–8. |
| [14] | Zubkov A.Y., Pilkington A.S., Bernanke D.H., Parent A.D., Zhang J. Posttraumatic cerebral vasospasm: clinical and morphological presentations. J. Neurotrauma. 1999; 16: 763–70. |

 Abstract
 Reference
 Full-Text PDF
 Full-text HTML