-
Paper Information
- Next Paper
- Previous Paper
- Paper Submission
-
Journal Information
- About This Journal
- Editorial Board
- Current Issue
- Archive
- Author Guidelines
- Contact Us
American Journal of Medicine and Medical Sciences
p-ISSN: 2165-901X e-ISSN: 2165-9036
2018; 8(2): 360-367
doi:10.5923/j.ajmms.20180812.02

Relationship between Age and Weight Features in Discriminating Hypertensive Patient Population Gender
 Abstract
 Reference
 Full-Text PDF
 Full-text HTML
Dago Dougba Noel1, Lallié Hermann-Désiré1, Moroh Aboya Jean-Luc1, Niamien Coffi Jean Magloire2, Ouattara Howélé2, Dagnogo Olefongo3, Téhoua Lazare2, Touré Abdoulaye1, Kouadio Kouassi Joel4, Kimou Adjiman Florent4, Djaman Allico Joseph3
1Département de Biochimie-Génétique UFR Sciences Biologiques Université Peleforo Gon Coulibaly BP 1328 Korhogo, Cote d’Ivoire
2Département de Biologie Animale UFR Sciences Biologiques Université Peleforo Gon Coulibaly BP 1328 Korhogo, Cote d’Ivoire
3Institut Pasteur de Côte d'Ivoire, 01 BP 490 Abidjan 01, Côte d'Ivoire
4Services/Département de Cardiologies et de Médecine Générale, Centre Hospitalier Régional (CHR) Korhogo, Côte d’Ivoire
Correspondence to: Dago Dougba Noel, Département de Biochimie-Génétique UFR Sciences Biologiques Université Peleforo Gon Coulibaly BP 1328 Korhogo, Cote d’Ivoire.
| Email: |  |
Copyright © 2018 The Author(s). Published by Scientific & Academic Publishing.
This work is licensed under the Creative Commons Attribution International License (CC BY).
http://creativecommons.org/licenses/by/4.0/

Background: hypertension is a complex disorder involving multiple organ systems represents the most prevalent cardiovascular risk factor in the population. Several studies revealed that more than 50% of the populations over age 65, are likely to have hypertension. Although both men and women develop hypertension, distinct gender differences in the incidence of hypertension are well established where males have a higher incidence of hypertension compared to females of the same age until the sixth decade of life. Also, several studies shown obesity as an increasing factor with regard hypertension incidence. Methods: here, we proposed an associative survey by combining age and weight parameters, with the purpose to characterize hypertensive patient gender. For this purpose, we collected data apropos 386 hypertensive patients from the Regional Hospital (RH) of Korhogo in northern of Cote d’Ivoire (2015-2016). Next, data were analyzed by performing several descriptive and analytical statistical tests. Results: our results suggested low susceptibility of young women (age < 40 year) developing hypertension with respect to young men. Chi squared test supposed the combination between age and weight parameters as a reasonable scheme in discriminating male hypertensive patients. ROC analysis reinforced age and weight features combination as a good practice for discriminating hypertensive male patients as opposed to female patients. The same survey (ROC), also, highlighted age and weight features as exhibiting high sensitivity in discerning (i) women (old female hypertensive patients) and (ii) men (male patients with normal weight) hypertensive patients respectively and suggested age impact on hypertension incidence. Conclusion: in conclusion the present study revealed a conflicting aptitude between age and weight parameters in discriminating hypertensive patient genders. Weight features displayed high sensitivity in predicting men hypertensive patients, while age parameter exhibited an acceptable aptitude via-à-vis of female hypertensive patients calling. Finally, this study identifies key factors that contribute to observed gender disparities in hypertensive population in northern locality of Cote d’Ivoire.
Keywords: Age, Weight, Hypertensive Patients, Gender, ROC Survey
Cite this paper: Dago Dougba Noel, Lallié Hermann-Désiré, Moroh Aboya Jean-Luc, Niamien Coffi Jean Magloire, Ouattara Howélé, Dagnogo Olefongo, Téhoua Lazare, Touré Abdoulaye, Kouadio Kouassi Joel, Kimou Adjiman Florent, Djaman Allico Joseph, Relationship between Age and Weight Features in Discriminating Hypertensive Patient Population Gender, American Journal of Medicine and Medical Sciences, Vol. 8 No. 2, 2018, pp. 360-367. doi: 10.5923/j.ajmms.20180812.02.
Article Outline
1. Introduction
- Cardiovascular Diseases involve any medical conditions related to the heart and blood vessels and remain the biggest cause of deaths worldwide according to World Health Organization (WHO) report [1]. Hypertension represents a major and correctable cardiovascular risk factor. The right diagnosis of hypertension and accurate assessment of cardiovascular risk are essential to give appropriate treatment to hypertensive patients [2, 3] Public urban and rural opinion in its great majority, in many underdeveloped countries (i.e. Cote d’Ivoire) ignores the bases of public health education vis-à-vis of hypertension troubles prevention [3]. Regardless of years of public health education in developed countries, hypertension awareness remains still problematic, with only a weak proportion with regard of adults and the elderly aware of their hypertension status [4, 5]. Several studies evoked gender difference between men and women in hypertension troubles incidence [4, 6, 7]. While hypertension prevalence is highest in older populations, almost 20 percent of young adults are hypertensive [8]. Henceforth, we believe that hypertensive patient age parameter can be useful to efficiently predict and interpret hypertension gender status in a hypertensive population. Few studies, however, have examined the influence of both age and weight features in discerning gender status differences in hypertension or hypertension awareness among hypertensive population. Further, several surveys showed linear relationship between age and hypertension incidence and as well suggested men having a higher propensity in manifesting hypertension troubles as opposed to women, in primary prevention services [9, 10]. The most recent recommendations for the management of hypertension were published recently. While there are age-dependent recommendations for blood pressure (BP) goals, the guidelines remain the same irrespective of gender, despite the abundance of evidence supporting sex and gender differences in hypertension [2, 11]. Although both men and women develop hypertension, distinct gender differences in the incidence and severity of hypertension are well established where males have a higher incidence of hypertension compared to females of the same age until the sixth decade of life [12, 13]. Also, obesity predisposes to hypertension and alters the course of hypertensive cardiovascular disease in ways that are only now coming to be appreciated. The strong association of obesity with hypertension and diabetes further complicates the picture in patients with such conditions and complicates the design of effective therapeutic interventions. However difficult to realize, weight loss must be the first line of therapy [14]. Obesity increases the risk of the development of hypertension. This relationship has been the subject of several surveys [15, 16]. Taking together, these studies evoked and suggested overweight feature as favoring and/or as a source of hypertension as well as other metabolism diseases incidence. Here, we combined both age and weight features because of their well-established involvement explaining hypertension troubles incidence, with the purpose to predict and characterize a hypertensive patient population gender and sex. Several descriptive as well as analytical statistical and Receiver Operating Characteristic (ROC) performance tests [17, 18] were realized for this purpose.
2. Material and Method
2.1. Study Sample and Data Structuration
- This study used data from the cardiology department of the Regional Hospital (RH) of Korhogo. Data were collected from that unity (cardiology department and/or services of Korhogo RH) during years 2015-2016. So, patients selected as hypertensive after clinical diagnosis were taken into account in this study. Next, we checked carefully for age (years) and weight (kg) parameters for each carefully chosen hypertensive patients. We prospectively studied 386 subjects (188 men/198 women), 50.51 ± 2.48 yrs of age, 63.31 ± 2.28 kg of weight. Data have been organized in class interval basing on Sturge formula: 1 + (3.3 log n); where “n” represents analyzed sample size. Class interval amplitude has been calculated as following:
 ; where xmax and xmin indicate maximum and minimum value of considered statistical parameters and/or variables (hypertensive patient’s age and/or weight features). Next, calculated class number and interval amplitude have been rearranged to make straightforward subjacent statistical analysis. In total eleven (11) and nine (9) class with an interval amplitude; a = 10 each, were calculated and considered for weight and age statistical variables respectively.
 2.2. Statistical Survey
- The software Microsoft Office Excel 2007 was used for above mentioned collected data pre-treatment, as well as for some descriptive statistical analysis. So, radar-plot graphic allowed to assess male and female patients aptitude vis-à-vis of age (years) and weight (kg) features. Spasio-temporal graphic by combining age and weight features permitted to characterize hypertensive patient population distribution, with the purpose to highlight that population gender differences. Analytical statistical surveys mainly were performed by R (version 3.5.1) software [19]. Then, Chi square test and Fisher exact test and as well Receiver Operating Characteristic (ROC) statistic performance test were executed in R programing environment by using appropriated scripts and/or functions. It is noteworthy to notify that ROC performance test, here, based exclusively on the detection of True Positive Fraction (TPF) or sensitivity and False Negative Fraction (FNF) or 1-sensitivity parameters. ROC performance test parameter were calculated as following:(i) Sensitivity (TPF) = True Positive (TP)/ [True Positive (TP) + False Negative (FN)];(ii) 1- Sensitivity (FNF) = False Negative (FN)/ [True Positive (TP) + False Negative (FN)].Threshold cut-off setting for ROC survey were recognized and/or considered basing on well-established evidence concerning age and weight parameters inference in discriminating hypertensive patient’s gender. Here, we were just able through this survey to characterize TPF and FNF, since all considered patients were acknowledged as hypertensive.
3. Results
3.1. Hypertensive Patient Population Distribution by Combining Age and Weight Features
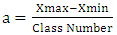
- Figure 1 shown an apparent difference with regard female and male hypertensive patient population dispersion by merging age and weight parameters. Indeed, Fisher test for assessing that population data dispersion exhibited a relative no-significant difference between male and female patients (p=0.39). Further, performed Pearson correlation test (R2= 0.68, p <0.05) confirmed that relative no significant difference (moderate agreement) between male and female hypertensive patients by merging both age and weight features. Considering as a whole the combination of age and weight features, appears as an inadequate scheme and/or methodology for discriminating presently analyzed hypertensive population gender. Also, figure 1 displayed a high hypertensive population density (regardless patient gender) for weight parameter interval 50-89kg, as well as revealed 45-54 and 55-64 age intervals as a crucial period for manifesting hypertension trouble, suspecting age dynamism on the hypertension incidence for both women and men genders (Figure 1).
 | Figure 1. Male (A) and female (B) hypertensive patient’s population dispersion by combining weight and age parameters in assessing processed patient’s gender features |
3.2. Statistical Estimation of the Influence of Patients Age Parameter on Hypertension Incidence
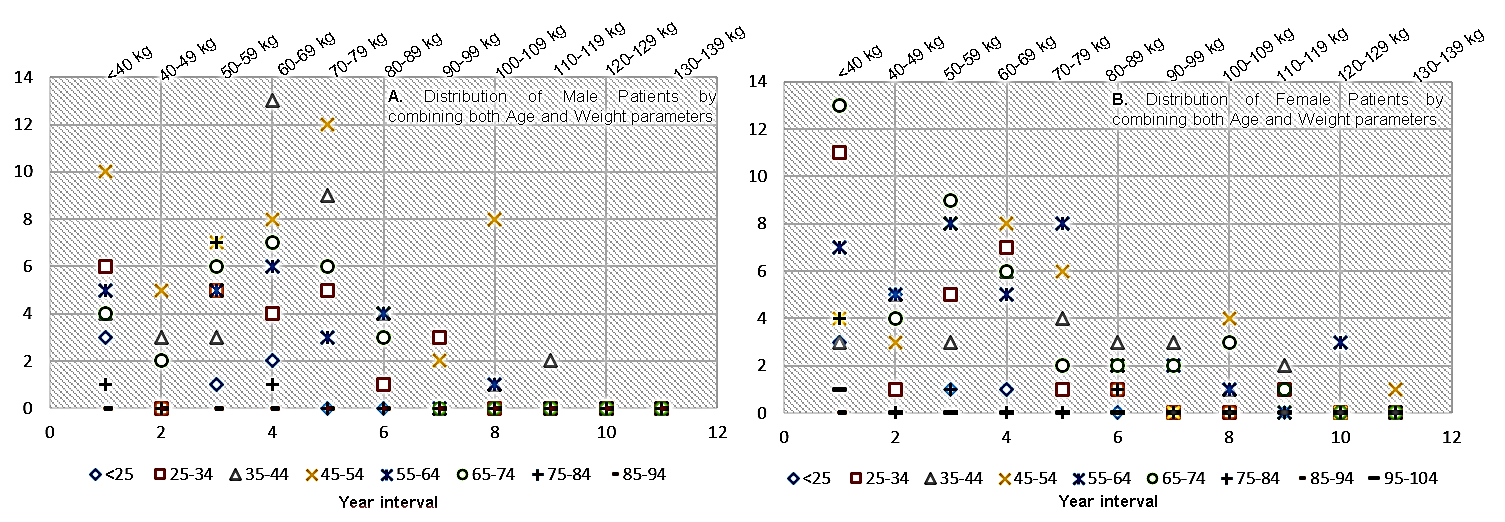
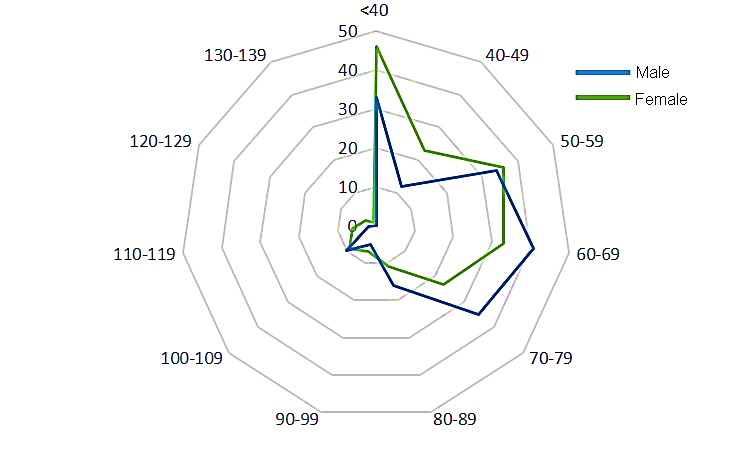
- A weak overlapping with regard male and female hypertensive patient population dispersion has been observed by processing age parameter with the purpose to assess hypertension incidence (Figure 2). High similitude have been observed between female and male hypertensive patients for age feature < 30 years. Then, for patient with age < 30 year, our analysis exhibited no significant difference between processed patient gender features. Indeed, for this age interval parameter, descriptive statistical analysis (Table 1) revealed an apparent difference in term of patient proportion between men (22.66) and women (23.66) gender (p=0.4). Heterogenic behavior with regard hypertensive population gender being evident for patient’s age higher than 40 years (Figure 2). In the other word, findings suspected a proportion difference with regard hypertensive patient gender features by processing age parameter > 40 (Figure 2 and Table 1). For that parameter and/or interval (patient age >40 years), our performed Fisher exact test relatively supported that gender difference (p=0.1). Indeed, high proportion with regard age parameter referred to men and women hypertensive patients were recorded for 44-54 and 65-74 year intervals respectively. Taking together, these results suspected younger women’s as less influenced by hypertension disorders risk with respect to younger men. Further, the proportion of the hypertensive women patients substantially increased more than those of men patients for age parameter >50 year (Figure 2 and Table 1). Considering as a whole, hypertension troubles appear to become problematic and recurrent for old women as opposed to old men (p≤0.1).
|
 | Figure 2. Radar plot assessing patient gender dispersion analysis by age (years) features on the incidence of hypertension trouble |
3.3. Hypertensive Patient Weight Parameters in Assessing Hypertension Troubles Incidence
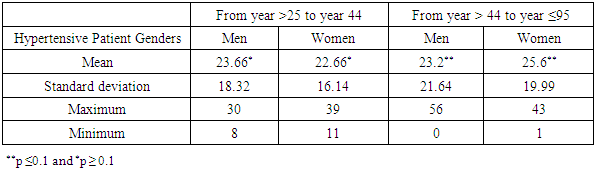
- Although women and men patients displayed an apparent comparable dispersion behavior for little weight value, the present radar plot survey (Figure 3) recorded a relative considerable number of hypertensive women patients with low weight (weight interval: to < 40 kg from 59 kg) as opposed to men patients (p=0.2). Weight increasing triggered a heterogeneous dynamism with regard the dispersion of hypertensive patient population gender features (Figure 3). Interestingly, findings seemed to indicate an apparent concordance between men patients weight parameter and hypertension incidence as opposed to women patients (p=0.39). In the other word, weight increasing appear to relatively influence hypertension trouble incidence in men patients with respect to in women patients (Figure 3, Table 2). Further, findings suggested high proportion with regard women and men hypertensive patients in term of gender parameter density dispersion for weight intervals 40-59 and 60-80 respectively (Figure 3). This result is in agreement with previous mentioned observations (Figure 1).
|
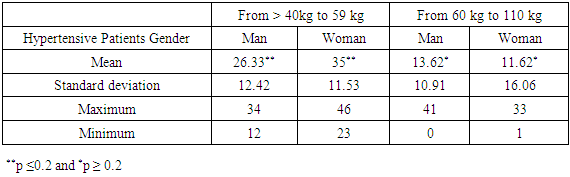
 | Figure 3. Radar plot assessing hypertensive patient gender qualitative data distribution by measuring weight (kg) parameter |
3.4. Chi Square Statistical Analysis Weighting Age and Weight Parameters Integration in Discriminating Hypertensive Patient Gender
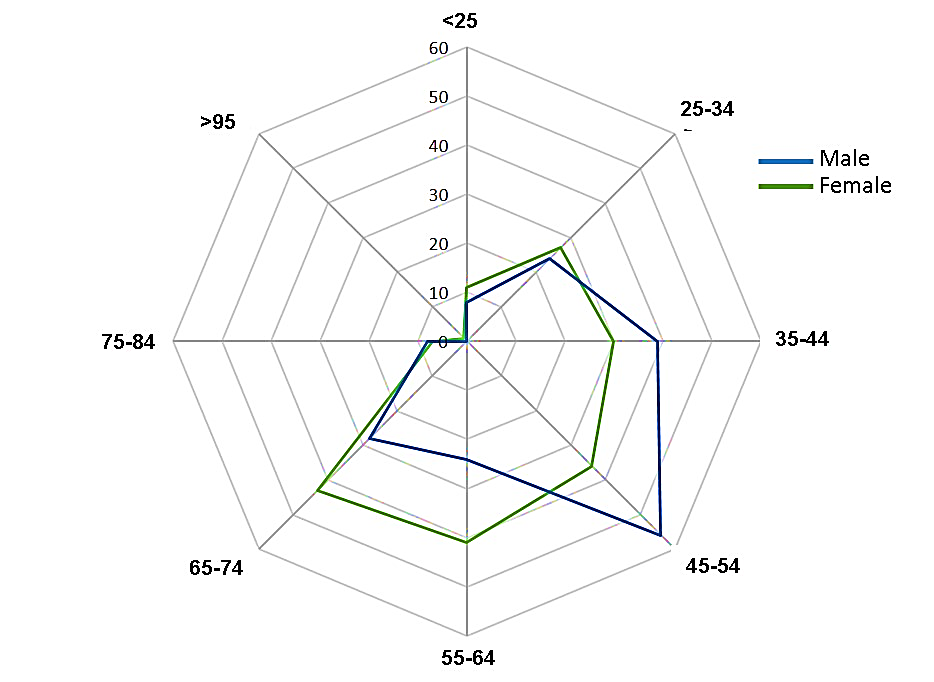
- We performed a Chi square test to assess the impact of both age and weight features on hypertension incidence with the purpose to discriminate patient gender differences. Considering female hypertensive patients, we calculated Χ2 = 82.29 at a freedom degree =70. Theoretical Chi square (Χ2) value for that mentioned freedom degree value (70); Χ2 = 90.53 at 95% confidence interval (p<0.05). This test suggested non-significant interdependence between age and weight features in predicting and/or discerning women patient gender vis-à-vis of the incidence of hypertension pathology (Χ2 calculated=82.29 < Χ2 theoretical=90.53). Further, spatio-temporal distribution graph (Figure 4A) by exhibiting heterogenic behavior with regard that hypertensive women patient population, supported this evidence. The same analysis (Figure 4A) curiously evoked good aptitude of age parameter in discriminating female hypertensive patients as opposite to weight parameter. Calculated Chi square (Χ2) coefficient with the purpose to evaluate interdependence relationship between age and weight parameters with regard male hypertensive patient’s gender is as following: Χ2 = 107.47 (freedom degree = 70). This results suggested a significant interdependence at 95% confidence interval (p≤0.05) between age and weight features in predicting men hypertensive patients’ gender (Χ2 calculated=107.47 > Χ2 theoretical = 90.53). In addition, figure 4B relatively supported that Chi square test results. Indeed, Figure 4B exhibited a relative homogeneity with regard patient’s data dispersion in comparison to data distribution reported in Figure 4A. Although statistical test proposed age and weight combination as explaining hypertension incidence in processed male patients, weight parameter dynamism for this category of patient exhibit a considerable contribution to that prediction (Figure 4B). Taking together, our findings suggested an overlapping (concordance) in predicting hypertension troubles incidence between male and female patient genders by processing age feature as well as a difference in that predicting procedure in calling hypertensive patient genders when we combined both age and weight features.
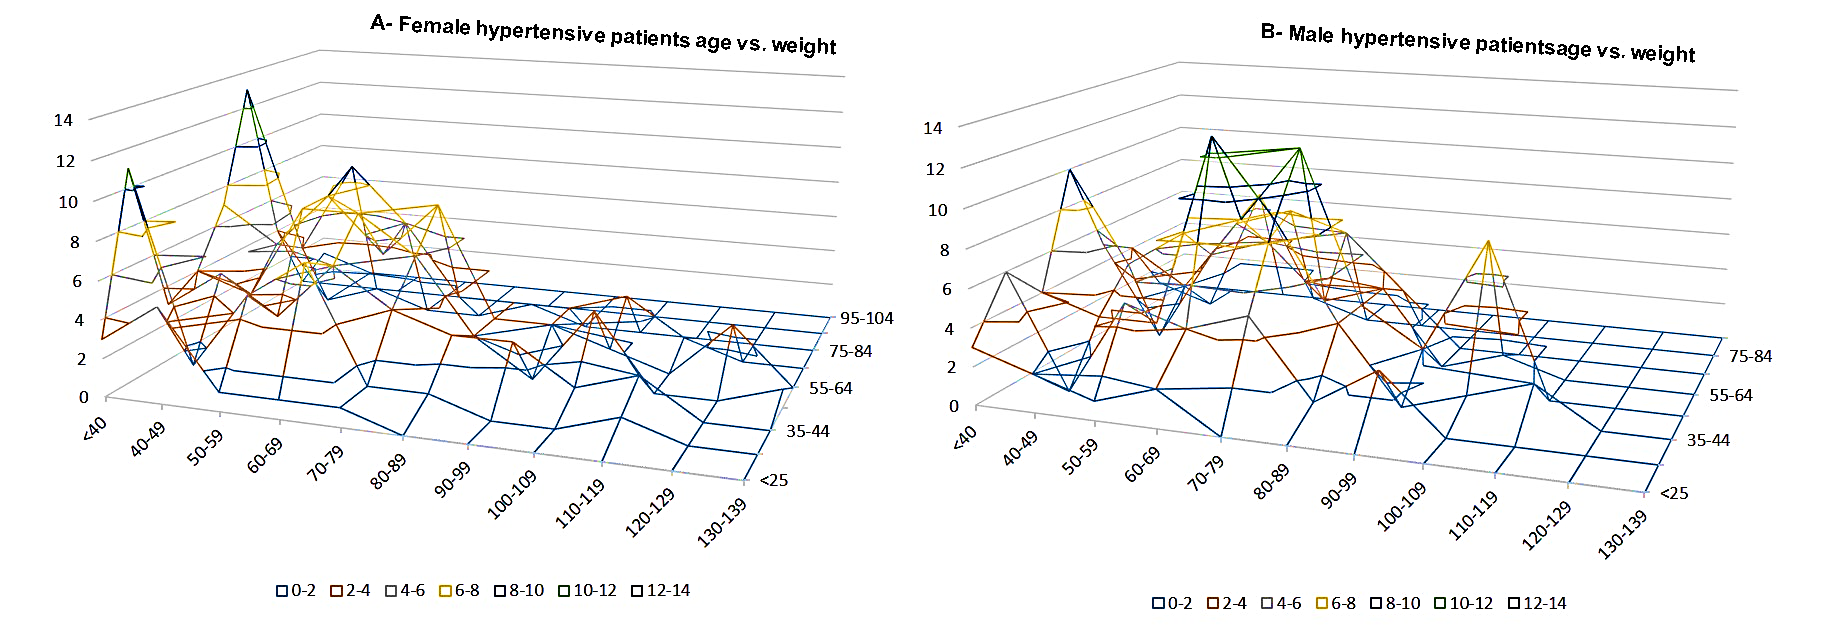 | Figure 4. Spatio-temporal dispersion clustering graph of female (A) and male (B) hypertensive patients from Regional Hospital (RH) of Korhogo (2016-207) by combining age and weight features in assessing hypertension incidence |
3.5. ROC Survey Evaluating the Combination between Age and Weight in Predicting Hypertension Incidence on Patient Gender
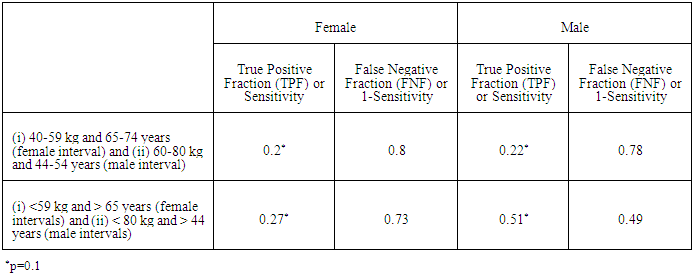
- Our previous findings discriminated 40-59 kg (weight) and 65-74 year (age) intervals as including the highest number of female hypertensive patients (Figures 2 and 3). In the same tendency 60-80 kg (weight) and 44-54 year (age) weight and intervals have been recorded as including the highest number of male hypertensive patients. Here we focused on a ROC analysis (performance statistical test) assuming above mentioned intervals as threshold (cutoff) parameter values with the purpose to assess hypertension diagnostic procedure sensitivity (True Positive Fraction - TPF) and False Negative Fraction (FNF= 1- sensitivity) performances. ROC survey revealed a low TPF and/or sensitive performance with regard the combination between age and weight features in discerning patient gender (Table 3). However, ROC survey suspected the combination of these components as exhibiting a relative good sensitivity performance in discerning hypertension troubles incidence in men as opposite to women patients (Table 3). An extension with regard previous processed intervals allowed to increase the true positive fraction (TPF) parameter in discriminating both female (from 0.2 to 0.27) and male (from 0.22 to 0.51) hypertensive patients especially for male patients (p=0.13). Considering as a whole, our findings proposed age and weight combination as favoring the prediction of hypertension incidence in male patient population as opposed to female patients. These findings were in agreement with our previous results that suggested age as a good predicting factor with regard hypertension incidence in female patient of the presently processed hypertensive population.
3.6. Performance Assessment of Age and Weight Features Discerning Hypertensive Patient Genders
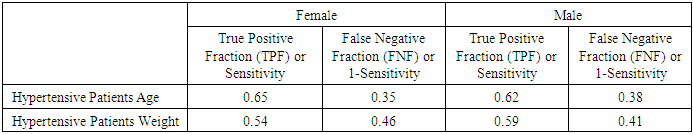
- Here we performed a performance test with the purpose to highlight the link between hypertensive population age and weight features with patient genders. ROC analysis by processing (i) women (age ≥50 year) and men (age ≥ 44 year) age parameters and (ii) women (weight ≤59 kg) and men (weight > 60 kg) weight features. Sensitivity parameter discerning hypertensive female gender (TPF=0.65) is comparable with those discerning male patients (TPR=0.62) when age features as has been processed (Table 4). This findings confirmed age features as a good predictive factor discerning older hypertensive female patients (threshold age interval minimum value: 50) as well as younger hypertensive male patients (threshold age interval minimum value: 44). In the other words, our findings suggested high susceptibility of older women (age ≥50 year) manifesting hypertension disorder with respect than older men (age ≥50 year). The same analysis advised a low susceptibility with regard young female patients (age < 44 year) in manifesting hypertension trouble when compared to young male patients (age < 44 year). Sensitivity parameter by processing weight parameter in discerning patient’s gender, relatively fit for male hypertensive gender with respect to female hypertensive gender (male weight TPF =0.58 vs. male weight TPF =0.54) hypertensive patients (Table 4). Consequently this result proposed hypertensive patient population weight feature as an acceptable parameter in discriminating and in selecting male hypertensive patient in the present analyzed hypertensive population. Considering as a whole, the present findings highlighted patient age and weight parameters as satisfactory factors in calling female and male patient gender respectively.
|
4. Discussion and Conclusions
- In the present study we were interested to assess gender difference in a hypertensive population in northern of Cote d’Ivoire, by merging patient’s age and weight features since, arterial hypertension one of the major coronary risk factors for increasing morbidity and mortality from cardiovascular diseases [20] has been recorder among the recurrent pathologies in that geographic area [21]. According to some hypothesis, sustained hypertension can happen only when the relationship between arterial pressure and natriuresis is abnormal. If a normal relationship between pressure and renal sodium excretion pertains, increased pressure will result in increased sodium excretion and lowering of pressure [22, 15]. Hypertension is a major and frequent risk factor for many cardiovascular or related diseases such as ischemic heart disease, stroke, heart failure, lower extremity arterial disease, end-stage renal disease. Previous studies have stated sex differences in the pathophysiology of hypertension and responses to blood pressure lowering medications. Also, several clinical surveys suggested men as exhibiting typically higher blood pressure than women, the differences being greater for systolic than diastolic blood pressure [22]. These differences become apparent during adolescence and remain significant at least until 55-60 years of age. Our findings supposed age features as an adequate factor discerning hypertensive patient population gender. Our results in agreement with those of [23] and others [24], advised gender disparities in hypertension among young adults patient (age < 44 years). [23] findings showed the gender disparities in hypertension status were already evident among men and women in their twenties: women were far less to be hypertensive compared to men. Observed gender differences in hypertension, which exist in human and animal populations, are due to both biological and behavioral factors [7]. The biological factors include sex hormones, chromosomal differences, and other biological sex differences that are protective against hypertension in women [5, 7]. These biological factors become evident during adolescence and persist through adulthood until women reach menopause, at which point gender differences in hypertension become correspondingly smaller or nonexistent. Considering as a whole, this investigation shown a low susceptibility of younger women vis-à-vis of hypertension incidence as opposed to younger men (Figure 2). Indeed, ROC analysis highlighted a high sensitivity performance in discriminating women hypertensive patient for age > 50 years. Also, for age > 50 year, women and men exhibited a comparable sensitivity performance with regard hypertension incidence. Interestingly, our results revealed non-significant difference (high agreement; R2= 0.68, p <0.05) between female and male hypertensive patients (Figure 1), categorizing presently analyzed hypertensive population as old (age average > 50 years; see material and method chapter). The present results are in accordance with the findings of our previous work that discriminated hypertension as recurrent disease in northern of Cote d’Ivoire and suggested age increasing as impacting hypertension incidence among processed sick population [21]. However, despite significant gender differences in blood pressure regulation, a study suggested ambulatory blood pressure monitoring thresholds for diagnosis of hypertension do not differentiate between men and women [2]. Next, performed Chi square test recommended a significant interdependence between age and weight features for discerning men hypertensive patients as opposed to women (p<0.05). Further, our findings by merging age and weight parameters supported a relative homogeneous spasio-temporal data dispersion in men hypertensive population in comparison with those of women (Figure 4). Also, weight feature exhibited a high sensitivity in calling male hypertensive patients as opposite to female hypertensive patients. Radar plot survey, furthermore, confirmed weight features as impacting considerably hypertension incidence in men population with respect to women (Figure 3). Indeed, ROC test by combining age and weight parameters as well as by processing weight feature alone, recorded weak sensitivity (TPF) in calling female hypertensive patients (TPF =0.27, p=0.1). This result suggested weight feature as inadequate factor characterizing women gender in the presently processed hypertensive population. Several studies revealed in contrast to the impact risk factor on hypertension, obesity and exercise had only a minor impact in determining hypertension awareness [4]. In addition, the same analysis proposed that the greater anti-inflammatory immune profile in females during hypertension may act as a compensatory mechanism to limit increases in blood pressure compared to males who exhibit a more pro-inflammatory immune profile. Arterial pathology is a major contributor to cardiovascular disease, morbidity and mortality. Women are at higher risk of cardiovascular disease after menopause. Arterial stiffness determined by pulse wave velocity, increases with age both in men and women, whereas arterial compliance in premenopausal women is greater than in men of similar age [20]. Recently, convincing evidence supports the idea that the different impact of cardiovascular disease and the differences in vascular biology in men and women may be, at least in part, linked to the cardiovascular and metabolic effects of sex steroid hormones. Indeed, androgens and estrogens influence a multitude of vascular biological processes and their cardiovascular effects are multifaceted. While in women the effects of androgens mainly depend upon estrogens’ levels, the effects of androgens in men generally relate to their aromatization into estrogens [20, 5]. Estrogens exert potential beneficial effects on the cardiovascular system in both sexes. However, the results of the present investigation may be limited by processed sample small size (386 hypertensive patients). Then, we are planning to continue our collaboration with the cardiology department and/or service of the RH of Korhogo, with the purpose to enlarge our data set. So, the conclusions were that the combination between age and weight features in characterizing patient gender in hypertension incidence have led to conflicting interpretation. Indeed, that combination appeared to clearly discriminate male hypertensive patients as opposed to female, while the results in the present study revealed age feature as exhibiting higher sensitivity in female hypertensive patients calling, in comparison to male subjects. Also, this study identifies simple key factors that contribute to observed gender disparities in hypertensive population in northern locality of Cote d’Ivoire. To sum up, the findings of the present study provided simple averting tool (age and weight features) in preventing hypertension incidence for both female and male gender.
ACKNOWLEDGEMENTS
- We thank our student staff: Dagnogo Dramane, Kengani Niambou Ama Ange Merveille, Yao Bio Kouamé Marcel, Kablan Gnoan Aka Justin, and Tié Bi Vro Toussain (Genetics and Applied Biotechnology; Department of Genetic and Biochemistry at UPGC University in Korhogo) for their collaboration in collecting presently analyzed data. Thanks also to the Central Administration of the Regional Hospital (RH) of Korhogo for their assistance as well as for providing the processed hypertensive population data set.
References
| [1] | Iqbal D, Ahmad N. (2016). Cardiovascular Diseases and its Treatment. SM J Pharmac Ther. 2 (1): 1009. |
| [2] | Hermida RC, Ayala DE, Mojon A, Fontao MJ, Chayan L, Fernandez JR (2013). Differences between men and women in ambulatory blood pressure thresholds for diagnosis of hypertension based on cardiovascular outcomes. Chronobiol Int. 30:221-232. |
| [3] | Dago ND, Diarrassouba N, Lallié HD, Silué S, Tuo Y, Fofana IJ, N’goran EK, Kimou FA, Coulibaly A. (2017). Performance Assessment of the Recurrence of Cardiovascular Pathologies Symptoms in a Hypertensive Population. Journal of Health Science 7 (1): 9-19. |
| [4] | Bethany E, Anna Z. (2015). Gender Differences in Hypertension and Hypertension Awareness among Young Adults Biodemography Soc Biol. 61 (1): 1-17. |
| [5] | Vitale C, Fini M, Speziale G, Chierchia S (2010). Gender differences in the cardiovascular effects of sex hormones. Fundam Clin Pharmacol. 24 (6): 675-685. |
| [6] | Cutler JA, Sorlie PD, Wolz M, Thom T, Fields LE, Roccella EJ (2008). Trends in hypertension prevalence, awareness, treatment, and control rates in United States adults between 1988-1994 and 1999-2004. Hypertension. 52 (5): 818-827. |
| [7] | Sandberg K, Ji H (2012). Sex differences in primary hypertension. Biol Sex Differ. 3 (1):7. |
| [8] | Nguyen QC, Tabor JW, Entzel PP, Lau Y, Suchindran C, Hussey JM, Halpern CT, Harris K, Whitsel EA (2011). Discordance in national estimates of hypertension among young adults. Epidemiology. 22(4):532–541. |
| [9] | Rosengren A, Wallentin L, Simoons M, Gitt AK, Behar S, Battler A, Hasdai D (2006). Age, clinical presentation and outcome of acute coronary syndromes in the Euroheart acute coronary syndrome survey. Euro Heart J. 27:789-795. |
| [10] | Strokes GS (2009). Management of hypertension in the elderly patient. Clinical Intervention in Aging. 4: 379-389. |
| [11] | James PA, Oparil S, Carter BL, Cushman WC, Dennison-Himmelfrab C, Handler J, Lackland DT, LeFevre ML, MacKenzie TD, Ogedegbe O, Smith SCJr, Svetkey LP, Taler SJ, Townsend RR, Wright JTJr, Narva AS, Ortiz E. (2014). Evidence-based guideline for the management of high blood pressure in adults: Report from the panel members appointed to the eighth Joint National Committee (JNC 8). JAMA. 311:507-520. |
| [12] | Yoon SS, Gu Q, Nwankwo T, Wright JD, Hong Y, Burt V (2015). Trends in blood pressure among adults with hypertension: United States, 2003 to 2012. Hypertension. 65:54-61. |
| [13] | Mozaffarian D, Benjamin EJ, Go AS, et al (2016). Heart disease and stroke statistics-2016 update: A report from the American Heart Association. Circulation. 133:e38-e360. |
| [14] | Richard NR (2009). Obesity-Related Hypertension. The Ochsner Journal 9:133-136. |
| [15] | Frohlich ED (2002). Clinical management of the obese hypertensive patient. Cardiol Rev. 10 (3): 127-138. |
| [16] | Hall JE, Crook ED, Jones DW, Wofford MR, Dubbert PM (2002). Mechanisms of obesity-associated cardiovascular and renal disease. Am J Med Sci. 324 (3):127-137. |
| [17] | Hajian Tilaki KO, Hanley JA, Nassiri V (2011). An extension of parametric ROC analysis for calculating diagnostic accuracy when the underlying distributions are mixture of Gausian. J App Stat. 38:2009-22. |
| [18] | Dago DN, Lallié Hermann-Désiré MN, N’Goran KE, Mori A, Diarrassouba N, Massimo D, Giovanni M (2016). ROC Curve Assessing Microarray Oligonucleotides Size Calling Differentially Expressed Genes by High-Throughput Sequencing Approach. International Journal of Applied Biology and Pharmaceutical Technology 7(3): 130-141. |
| [19] | R Core Team (2017). R: A Language and Environment for Statistical Computing. https://www.R-project.org/. |
| [20] | Kawecka JK, Czamecka D, Olszanecka A, Rajzer M, Jankowski P (2002). The effect of hormone replacement therapy on arterial blood pressure and vascular compliance in postmenopausal women with arterial hypertension. J Hum Hypertens. 16(7): 509-16. |
| [21] | Dago DN, Diarrassouba N, Touré A, Lallié HD, N’Goran KE, Ouattara H, Kouadio J and Coulibaly A. (2017). Whole Screening Analysis Discerning Recurrently Diagnosed Diseases in a Northern Locality of Côte d’Ivoire, International Journal of Development Research. 7, (11), 16598-16604. |
| [22] | Laragh JH (1989). Presentation of the Harvey Award to Arthur C. Guyton. Am J Hypertens. 2 (7):573-574. |
| [23] | Ellen E. Gillis and Jennifer C. Sullivan (2016). Sex Differences in Hypertension: Recent Advances. Hypertension. 68(6): 1322-1327. |
| [24] | Callahan ST, Cooper WO (2005). Uninsurance and health care access among young adults in the United States. Pediatrics. 116(1):88-95. |