American Journal of Medicine and Medical Sciences

p-ISSN: 2165-901X    e-ISSN: 2165-9036

2018;  8(1): 295-311

doi:10.5923/j.ajmms.20180811.02


The Intellectual Efficiency of Adolescents Aged 13-15- Years-Old Using Drinking Water with Varying Fluoride Concentrations in Kajiado North Sub County, Kajiado County

Benjamin Induswe1, Gladys Opinya1, Lincoln Imbugwa Khasakhala2, Richard Owino1

1Department of Paediatric Dentistry & Orthodontics, School of Dental Sciences, University of Nairobi, Kenya

2Department of Psychiatry, School of Medicine, University of Nairobi, Kenya

Correspondence to: Gladys Opinya, Department of Paediatric Dentistry & Orthodontics, School of Dental Sciences, University of Nairobi, Kenya.

Email:

Copyright © 2018 The Author(s). Published by Scientific & Academic Publishing.

This work is licensed under the Creative Commons Attribution International License (CC BY).
http://creativecommons.org/licenses/by/4.0/

Abstract

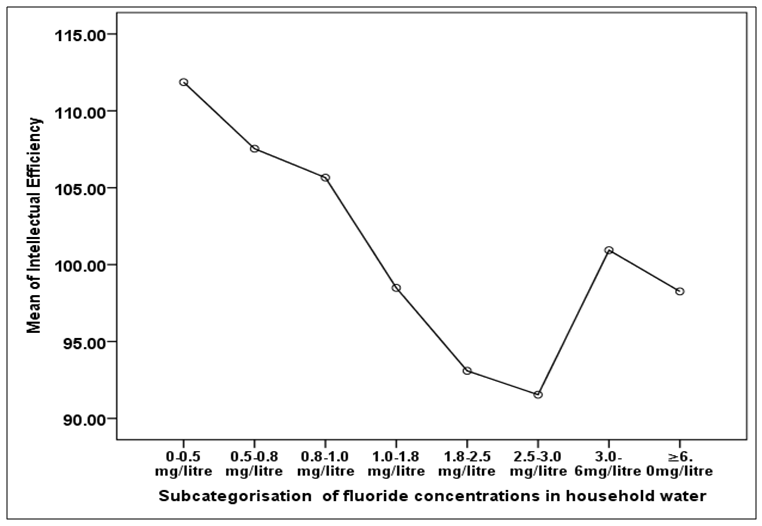
Fluoride in concentrations of 0.5 to 1 milligram per litre (mg/l) of water has been reported to reduce dental caries. However, chronic intake of higher levels of 1.5mg/l and above has not only been stated to cause varying degrees of dental and skeletal fluorosis, but also excessive fluoride intake has also been shown to affect the CNS without first creating the physical malformations of dental and skeletal fluorosis. Water is the primary source of fluoride in the human body. Therefore, the adverse effects of high fluoride in drinking water on intellectual efficiency is a potential public health problem. The study aimed at establishing the intellectual efficiency of adolescents who were born and raised in North Kajiado area known to have pockets of high fluoride in water and compared it with the intellectual efficiency adolescents born and raised in low and medium fluoride in the same area. In this cross-sectional descriptive study, 269 school children aged 13-15 years were selected from six schools in Kajiado North Sub County with medium fluoride (≥1.1mg/l and ≤2.0mg), low fluoride (≤1.0mg/l) and high fluoride (≥2.1mg/l) in their water supplies. Social-demographic data was collected using a questionnaire which included socio-demographic details. Intellectual efficiency was assessed using The Wide Range Achievement Test (WRAT4). Those who lived in low and medium water fluoride areas respectively had a higher mean intellectual efficiency (IE) thus 104.88 and 106.33 respectively in comparison to those who lived-in high-water fluoride areas who had a mean IE of 97.75. A higher proportion of low and medium fluoride areas scored above average and gifted than those from high fluoride areas. According to household water fluoride, those who had low fluoride concentration had a mean IE of 107.47 while those with medium and high had 96.20 each. The mean IE increased with an increase in the household water fluoride concentration. However, the mean IE decreased from 2.6-3.0mg/l when it increased slightly increased but did not reach the mean IE of low fluoride concentrations. The study shows that long-term exposure to fluoride from birth may result in lowering of intellectual efficiency.

Keywords: Intellectual efficiency, Intelligence Quotient, Fluoride, Drinking Water, Adolescents, Kajiado North Sub County

Cite this paper: Benjamin Induswe, Gladys Opinya, Lincoln Imbugwa Khasakhala, Richard Owino, The Intellectual Efficiency of Adolescents Aged 13-15- Years-Old Using Drinking Water with Varying Fluoride Concentrations in Kajiado North Sub County, Kajiado County, American Journal of Medicine and Medical Sciences, Vol. 8 No. 1, 2018, pp. 295-311. doi: 10.5923/j.ajmms.20180811.02.

1. Introduction

The fluoride levels in the drinking water are usually stable in specific regions for a long time [1]. Water is the primary source of fluoride to the body [2]. The fluoride in drinking water and other sources is metabolised and excreted by the kidney [3] (50-80% of the ingested fluoride). Therefore, the degree of exposure to fluoride for resident individuals can be measured by the fluoride water concentration.
Fluoride has both useful and harmful effects on humans [4]. In dentistry, fluoride was introduced for control and prevention of dental caries when used topically and systematically. Although it was later established the caries prevention is mainly through the topical effect [5]. In developed countries, the use of fluoride has been shown to reduce the prevalence of dental caries significantly [6].
Studies conducted effects of fluoride on the body. Animal studies have shown that when there is exposure to high levels of fluoride especially in drinking water, it may lead to functional and structural damages to the nervous system [7-9]. Fluoride has also been shown to cause dental and skeletal fluorosis [10].
There has been confirmation of an increase in the prevalence of dental fluorosis [11-13] and also a decrease in the intellect of children [14, 15] when there is excessive exposure to drinking water fluoride. The study examines the relationship between water fluoride levels and children’s intellectual efficiency.

2. Materials and Methods

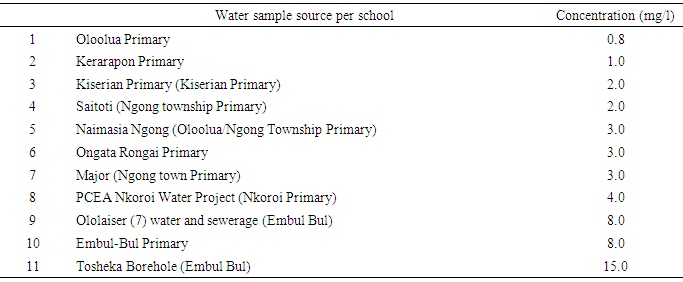
Study area: Kajiado County is one of the forty-seven counties in the Republic of Kenya. It is in the former Rift Valley province. Studies in Kenya have shown that the former Rift Valley has higher water fluoride levels in comparison to the WHO levels of 1.5mg/l [16-19]. Studies have also found a large number of children affected by dental fluorosis in the Rift Valley [20].
In this study, it was tried as much as possible to match the natural factors with the social factors like geographical environment, economic situation and educational standards. Water was got from the public schools and their surrounding water sources. The water samples were analysed by government chemist and department of mines and geology for analysis of water fluoride and heavy metals respectively.
Depending on the results of the water fluoride the schools were then divided into low, medium and high-water fluoride. Low water fluoride had ≤1.0mg/l, medium water fluoride ≥1.1≤2.0mg/l while high water fluoride ≥2.1mg/l. There was no heavy metal in the water like arsenic, lead or copper. The students were then selected randomly from this schools, and those who met the inclusion criteria were allowed to participate.
Inclusion criteria an exclusion. The individuals had to aged between 13-15 years and attending a day school. They must have been brought up in Kajiado County Kajiado North subcounty from birth up to the time of the study. Similarly, that adolescents whose parents may have migrated into the area between ages one to two years and had never migrated in and out of the study area after that. Parental consent is given and participant assent. One group low fluoride (≤1.0mg/l) in the drinking water without dental fluorosis living in Kajiado North. Second group medium fluoride (≥1.1mg/l and ≤2.0mg/l) with or without dental fluorosis residing in Kajiado North and they must have been born and raised in the study area. The study group was selected as some of the children may be sensitive to the maximum WHO recommend fluoride dose for temperate countries, but for the tropics, there is no information if this dose is too high for the children. Third group high fluoride ≥2.0mg/l with or without dental fluorosis living in Kajiado North using water without heavy metals, i.e. lead arsenic and aluminium.
Exclusion Criteria: The children were excluded if they had the existing chronic medical condition. The water in the school and neighbourhood or household had heavy metals.
Sampling and sample size A total of three hundred and eight participants took part, but only two hundred and sixty-nine were included in the final analysis. The excluded thirty-nine either had a chronic illness or were below thirteen and above fifteen years after analysis their ages. The Necessary ethical approvals were obtained from The University of Nairobi and Kenyatta National Hospital Ethics Committee, National Commission of Science Technology and Innovation, Kajiado county Education and County Commissioner’s office.
A written informed consent was obtained from the parents of all the participants and permission obtained from the individual participants.
Study design the study was cross-sectional descriptive in nature and the formula for comparison of two groups was used to calculate the sample size. Thus N=2(Z1-α/2+Z1-β) p (1-p)/ (P1-p2)2; Where N was the desired sample size. Z1-α/2 was the confidence level at 95% (SD 1.96) while, Z1-β is 1.28 β=5%, at 95% confidence level. P was the mean difference between prevalence of p1 (61.8%) and p2 (38.2%); with N=2(1.96+1.28)2(0.236) (1-0.236)/ 0.618-0.382)2= 67 per group and 74 children per group was used to cater for attrition.
Collection and analysis of water samples: The sources of drinking water around the schools were identified and water samples collected in uniform clear plastic bottles. The fluoride in the water collected was analysed using ion-selective rod and lead, and other heavy metals were also analysed. The study area (schools) were then divided into three depending on the water fluoride, i.e. low water fluoride 1.0mg/l or less, medium water fluoride 1.1-2.0mg/l and high-water fluoride 2.1 mg/l and above. Those selected to take part in the study and who had a signed consent form were then given a clean plastic bottle and brought the water they use domestically which was then analysed for levels of fluoride.
Assessment of intellectual efficiency: The first author administered the test. The Wide Range Achievement Test (WRAT4) was the tool of choice, and it was conducted in two sessions [21]. The 1st session was oral for letter and word reading. The letter reading had 15 points, and all candidates did not do this unless the candidate was not able to pronounce correctly at least five responses. If not, the letter reading section was not necessary but full credit was given, i.e. 15 points. The word reading is a test of word recognition and has 40 words to be read each earning 1 point and a maximum of 40 points. The word reading test is a test of word recognition so unusual pronunciations due to accent, or poor articulation are accepted as correct if the peculiarity is consistent throughout. A maximum of 57 points was awarded for letter and word reading. The spelling test was undertaken where forty words and fifteen letters where be spelt. Each session had a maximum of thirty participants seated in classroom words were read out by the first author and the participants wrote them down in a form provided. One point was awarded for each correctly spelt word and letter to a maximum of 55. The arithmetic subtest was also done in 15 minutes. The scores in all the subtests were then added to get an absolute score that was interpreted as gifted for those who scored 130 and above, above average was between 115-129, average between 85-114, below average between 71-84 and intellectually challenged 70 and below [21].
Statistical analysis: The analysis was performed by the statistical package for social sciences (SPSS) version 22.0 of windows. The data was also be subjected to chi-square, Spearman's test and analysis of variance (ANOVA) Post Hoc test, Mann Whitney U test and Kruskal-Wallis. Level of significance p<0.05 (confidence interval of 95%).

3. Results

Distribution of the children by gender: A total of two hundred and sixty-nine children whose parents had given consent and allowed their children to participate in the study were recruited to join. There was a total of ninety-one (33.8%) males and one hundred and seventy-eight (66.2%) females. There were more females whose caregivers gave consent as compared to males, figure 1.
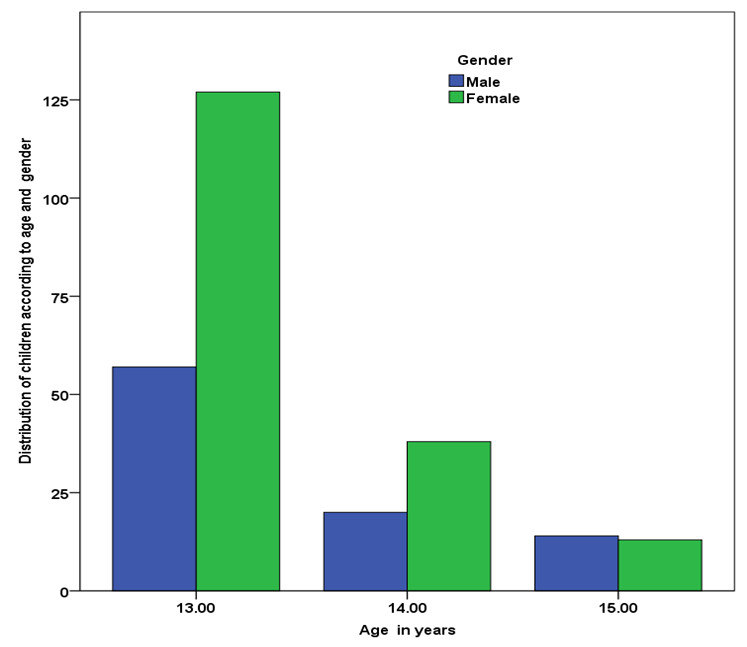
Figure 1. Distribution of the Respondents by age and gender
Distribution of the individuals by age: The distribution of the children by age showed that one hundred and eighty-four (68.4%) were 13 years old; fifty-eight (21.6%) were 14 years old, and twenty-seven (10%) were 15 years old Figure 1. The mean age for the 269 adolescents was 13.4±.67, and the mean difference was significant with t=329.712, df=268, p≤0.001.
Place of birth and age of migration into Kajiado north subcounty: Majority of those who participated in the study, were 191 (71%) were born and brought up in Kajiado North subcounty, Kajiado county, while thirty-five (13%) were not and forty-three (16%) had no response. Sixteen (50%) of those not born in Kajiado North were born in Kajiado county but not in Kajiado north sub-county and the other sixteen moved in before the age of 4 years, figure 2. Any participant with a chronic illness or history of head injury was excluded from the study.
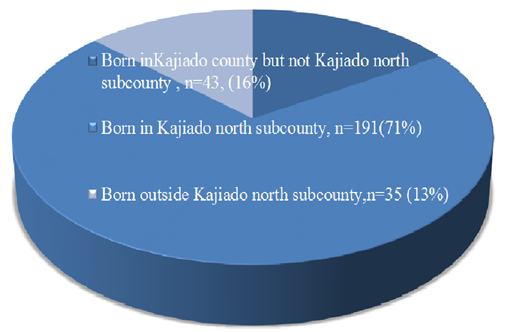
Figure 2. Place of birth
Fluoride concentration in the environs and, school water supplies and the household water: Most areas in Kajiado County, Kajiado North subcounty are considered high fluoride areas with pockets of low fluoride. This study identified areas and classified them into low ≤1.0mg/l, medium ≥1.1≤2.0mg/l and high ≥2.1mg/l of Water fluoride concentration in the sources, Table 1. The mean area Water fluoride was 4.53mg/l with a range of 0.8mg/l to 15.0 mg/l. An analysis of the water from sources in the areas where the selected schools were sampled and analysed for the presence of heavy metals but the water yield negative results in Table 1.
Table 1. Water fluoride by source around the in the schools
     
The participants also brought water samples from water used in the household and in total there were 269 samples which were analysed for fluoride. There were one hundred and five (39%) children who brought in water samples which had a fluoride content ranging between 0-1.0 mg/litre while water samples which contained medium fluoride (1.1-2.0) mg/litre of fluoride were eighty one (30.1%) and those with high fluoride of ≥2.1 mg/litre were eighty three (30.9%). The mean fluoride concentration in the household water was 2.897± 3.292 mg/l.
Caregivers level of education: Out of the 269 caregivers two hundred and thirty (85.5%) had different levels of informal and formal education. Six (2.2%) had no formal schooling, one hundred and eight (40.1%) children had caregivers who had had level primary school. Seventy-three (27.1%) had education up to high school level while twenty-seven (10.1%) had achieved a college education and six (2.23%) of the caregivers had a university education. However, thirty-nine (14.5%) of the caregivers did not respond, Figure 3.
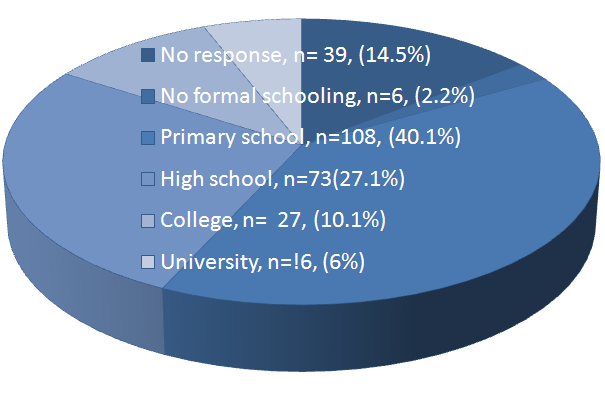
Figure 3. Caregivers level of education
IE and gender: The intellectual efficiency for the ninety-one (33.8%) males the mean intellectual efficiency was 99.26 ±15.03 while one hundred and seventy-eight (66.2%) girls had a mean intellectual efficiency of 101.29 ±12.89. The difference in the IE between gender was insignificant with an independent t-test for equality of mean, Levene’s with equal variance not assumed and F (267. 159)= 4.271, t=-1.153, p=.250.
Age groups and IE: The thirteen-year-olds were one hundred and eighty-four (68.4%), and they had a mean IE of 100.7120±13.43 with a 95% CI for the mean of (98.76, 102.67) and the lowest score was 71 while the highest was 134. The 14-year-olds were fifty-eight (21.6%) and had a mean IE of 99.69±13.66 with a 95% CI for the mean of (96.1, 103.28). The minimum score was 71 while the maximum score was 128. Twenty-seven (10.0%) fifteen-year olds had a mean IE of 101.85 ±15.53 with a 95% CI for the mean of (95.71, 107.99) with the minimum score was 71 while the highest was 133.
An ANOVA test for means indicated insignificant differences in the means for intellectual efficiency for within and between groups with a value for F (2, 268) = .247, p=.781 at 95% CL. However, an Eta test for measurement of association showered a weak association between chronological age and the intellectual efficiency scored with Eta =0.043 and Eta squared was .002 at 95% CL.
Linear regression of intellectual efficiency and demographic factors: The influence of the child’s age, gender parental education was also investigated using a linear regression model. The child’s intellectual ability was influenced by the place of birth where beta=0.191, t=2.474, p≤0.014 at 05% CL. Also, medium and high fluoride concentrations in household water affected the intellectual efficiency of the children. The respective relationships were medium fluoride content in the household water had a negative linear relationship with beta=-0.323, t=-3.940, p≤0.001 while the high fluoride in household water had beta = -0.345, t=-3.958, p≤0.001. However, age, gender duration of child’s residence in Kajiado sub-county, the source of water and parental level of education had negligible contribution toward the intellectual ability of the children Table 2.
Table 2. A linear regression of various variables as predictors for the level of intellectual efficiency
     
Intellectual Efficiency: Out of the 269 children there was one (7%) child whose scores was 70, while thirty (11.2%) had their scores vary between 71-84; and one hundred and eighty-six (69.1%) individuals had average scores for intellectual efficiency which ranged between 85-114. For forty-five (16.7%) adolescents their IE scores ranged between 115-129 while three (1.11%) individuals had scores which varied between 130-134. The mean IE for the 269 individuals aged between 13-15 years was 100.61±13.66, Figure 4.
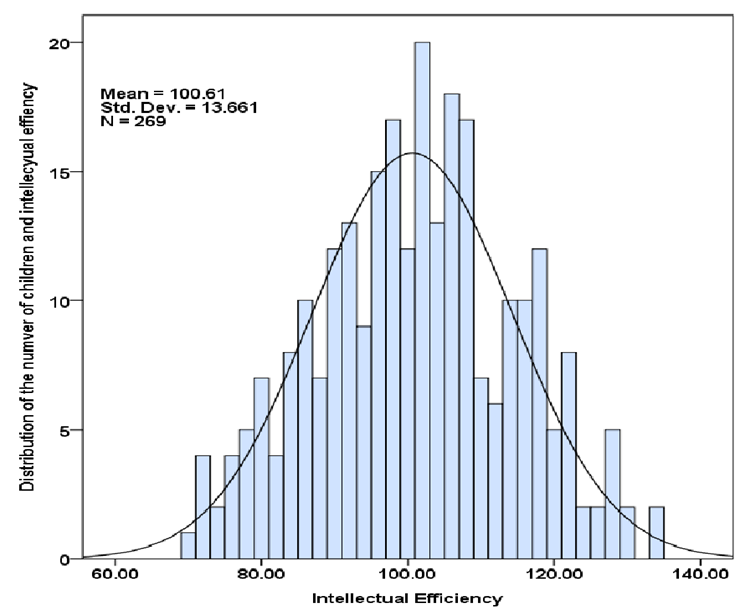
Figure 4. The distribution of the Intellectual efficiency score for the adolescents
Schools located in low fluoride areas: Sixty eighty (25.3%) children attended schools in the low fluoride areas, and their mean intellectual efficiency score was 104.8824±14.61, with the 95% CI for the mean was (101.35, 108.42). The child with the lowest score had 71 while the highest IE score was 134, Figure 5.
Schools located in medium fluoride areas: The children who attended schools which were found in the medium fluoride area were thirty-three (12.3%) with a mean IE of 106.33 ±13.62, and a 95% CI for the mean of (101.50, 111.16). The child who scored the lowest had 76 while the highest score was 130, Figure 5.
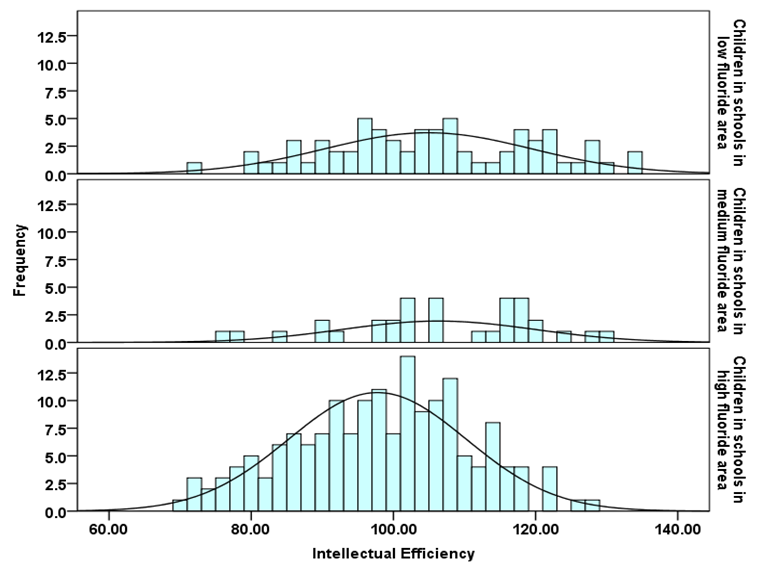
Figure 5. Distribution of the children according to the intellectual efficiency sores and location of the school
Schools located in high fluoride areas: However, one hundred and sixty-eight (62.5%) children attended schools located in the high fluoride areas, and their mean IE score was 97.75±12.49 at 95% CI for the mean as (95.85, 99.65), and the lowest score was 70 while the highest was 134, Figure 5. The children in the medium fluoride area had the highest mean IE 106.33±13.62 followed by those in the low fluoride area 104.8824±14.61 and those in the fluoride area had the lowest mean of 97.75±12.49, and the median was 100.61, Figure 6.
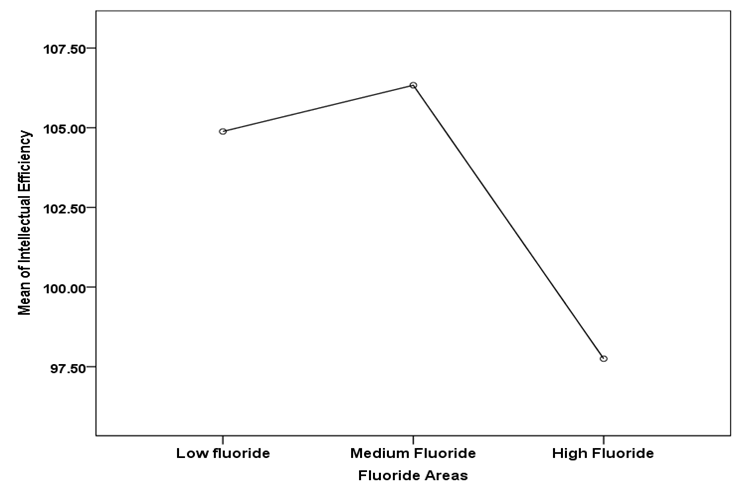
Figure 6. Difference in the mean intellectual efficiency according to fluoride area
The differences in the means for between and within groups was significant with ANOVA where F (2, 266) = 10.613, p≤0.001. A Tukey HSD post hoc test for insignificant differences in the IE of the adolescents was noted after multiple comparisons were made between the individuals from the low and the medium fluoride area school. The mean difference (M=-1.45098, SE=2.79958), p=.862 at 95% CL. A comparison of the means for IE of the children from the low and high fluoride are schools indicated significant differences with a Post hoc test Tukey HSD where the mean difference was (M=7.13235, SE=1.89666), p ≤.001 at 95% CL. Similarly, a comparison of the means for IE for the children from the medium and high fluoride schools with a Tukey post hoc test showered significant differences with a mean difference (M=8.58333, SE=2.51263), p≤0.002 at 95% CL.
Household water fluoride categorisation and intellectual efficiency: Categorisation of the household water fluoride into low, medium, and high fluoride concentrations showered children who used water with low fluoride had the highest mean for the intellectual efficiency figure 7.
Figure 7. Categorisation of fluoride concentration in household water and the intellectual efficiency of the children
Low fluoride in household water (≤1mg/litre): One hundred and five individuals used household water with low fluoride which ranged between 0-1.0mg/l and their mean IE was 107.47±13.03, and the 95% CI for mean was (104.95, 109.99). The children who scored lowest had a score of 71 while the highest had a score of 134.
Medium fluoride in household water (≥1.1mg/litre to 2mg/litre): The medium fluoride (1.1-2.0 mg/litre) concentration in the household water was used by eighty-one (30.1%) had a mean IE of 96.20 ±12.39 with a 95% CI for the mean of (93.46, 98.95). The minimum score was 70 while the highest was 127.
High fluoride concentration in household water ≥2.1mg/litre: The high fluoride concentration of ≥2.1 mg/litre was used by eighty-three (30.9%) whose mean IE was 96.20 ±12.06 and the 95% CI for the mean was (93.57, 98.84); The child with the lowest score for IE was 72.00, and the highest was 128.
An ANOVA analysis showered that there were significant differences in the means for intellectual efficiency between and within the groups with F (2, 266) = 25.811, p≤.001.
Multiple comparisons between the mean intellectual efficiency for children whose household water fluoride had a low, medium and high was compared using a Tukey HSD post hoc test. It was noted that the mean differences in the IE of one hundred and five children who used water with a fluoride concentration range of 0-1.0 mg/ litre were significantly different from the mean IE of eighty-one (30.1%) children whose household fluoride concentration was medium (1.1-2.0 mg/litre). The mean difference was (M=11.26631 SE=1.85575, p≤.001, at 95% CL.
Similarly, a significant difference between the means for IE was observed when a comparison of the mean IE for the children using water with a low fluoride (0-1.0 mg/litre) concentration with the IE of eighty-three (30.9%) children who used water with a high fluoride (≥2.1mg/litre). The mean difference was (M=11.27137, SE=1.84308), p≤.001, at 95% CL. A comparison of the mean IE of children who used water with medium (1.1-2.0 mg/l) fluoride concentration with that of the individuals whose fluoride concentration was high ≥2.1 mg/litre a Tukey post hoc indicated insignificant differences between the medium fluoride and the high fluoride. The mean difference was (M=.00506, SE=1.9599), p=1.00, at 95% CL.
Intellectual Efficiency and Household Water Fluoride Concentration Subcategories: The fluoride concentration of household water was subcategorised into 0.0-0.5mg/litre; 0.6-0.8 mg/litre 0.9-1.0 mg/litre 1.1-1.8 mg per litre; 1.9-2.5 mg/litre, 2.6-3.0 mg/litre; 3.1-6 mg/litre and ≥6.1 mg/litre fluoride in household water and examine in relation to intellectual efficiency.
0-0.5 mg/litre household water fluoride concentration: There were fifteen (5.6%) individuals who used the household fluoride content in water as 0.-0.5, and they had a mean IE of 111.87±5.54, and the 95% CI for the mean was (108.80, 114.9) while the minimum score was 101 and the highest 122, Figure 8.
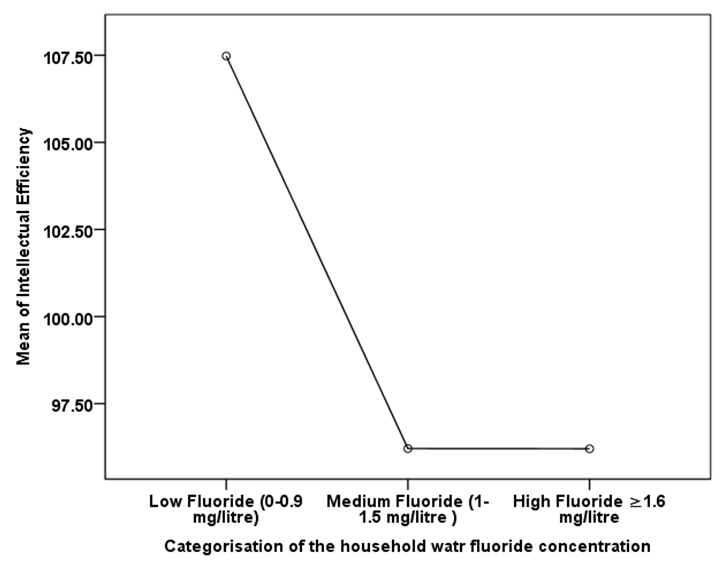
Figure 8. The mean intellectual efficiency and the fluoride concentrations in the household water
An ANOVA comparison of the means showered significant differences between and within the groups in the means for intellection efficiency in relation to the household water was categorise. The value for F (7, 261) =9.586, p≤0/001.
There was an insignificant difference between the means for the children 0-0.5mg/l with the mean IE of children 0.6-0.8mg/l, (M=4.328, SE=3.618) p=.933 at 95%CL. Also, insignificant differences were observed with children who used water with 0.9-1.0/litre with the Tukey HSD post hoc (M=6.208, SE=3.764) p=.720. Also, the mean IE, when compared to the IE of individuals whose water had 3.1-6mg/litre, was nonsignificant with the mean difference (M=10.929, SE=4.437) p=.216 at 95% CL. However, significant differences were noted in the mean IE for the children who used household water with fluoride concentration of 0.5 mg/litre and the mean IE of the children whose fluoride ranges were 1.1-1.8 mg/litre (M=13.378, SE=3.725) p≤.009 and water fluoride 1.9-2.5 mg/litre with a Tukey Post Hoc mean difference (M=18.775, SE=3.691) p≤.001 at 95% CL. Also, when the differences in the IE of those who used water with 0-0.5 mg/l was compared with the mean IE of those who used water with 2.6-3.0 mg/l with a Tukey HSD analysis with the mean difference (M=20.325, SE=4.063), p≤.001 and those who used water with ≥6.1mg/litre had significant differences with (M=13.610, SE=3.751) p≤.008 at 95% CL.
Fluoride concentration of 0.6-0. 8mg/litre in household water: Fifty-two (19.3%) whose household water fluoride ranged between 0.6-0.8 mg/litre had a mean IE of 107.54≠14.26 with the 95% CI for the mean as (103.57, 111.51). The children who used this water had the lowest score as 78 while the highest score was 134 Figure 9.
The Intellectual efficiency mean for the children who used water with a fluoride content range of 0.6-0.8 mg/litre was compared with the mean IE of the children whose household water contained fluoride in the ranges of 0.9-1mg/litre. There insignificant differences in the IE with a Tukey HSD where (M=1.880, SE=2.635) p=.997 at 95% CL.
Those who used household water with 0.6-0.8mg/litre of fluoride had their IE compared with the mean IE of those whose household water fluoride had fluoride concentrations were 1.1-1.8 mg/litre had significant differences were observed in the mean IE with a Tukey HSD where (M=9.050, SE=2.578) p≤.012 at 95% CL. The adolescents who used water with a fluoride concentration of 1.9-2.5 mg/litre had their IE compared with the IE of the individuals whose water fluoride content was 0.6-0.8 mg/litre. There was a significant difference in the IE with a Tukey HSD with the differences in the mean (M=14.447, SE=2.529), p≤.001 at 95% CL. Also, the mean IE of individuals who used water with a fluoride concentration range of 2.6-3.0 mg/litre showed significant differences in the IE with a Tukey HSD analysis with (M=15.996, SE=3.046), p≤.001 at 95% CL when compared with the IE of those who used water with 0.6-0.8mg/litre. The IE of individuals who used water with 3.1-6mg/litre of fluoride their mean IE was insignificantly different (M=6.60, SE=3.529), p=.573 at 95%CL, from the IE of individuals whose water fluoride ranged between 0.6-0.8mg/litre. However, the differences in the IE of individuals who used water containing 06-0.8mg /l of fluoride was significantly different from the IE of individuals household water included fluoride ranges of ≥6mg/l of fluoride.
0.9-1.0 mg/litre of fluoride concentration in household water: Thirty-eighty (14.1%) children with a mean IE of 105.66±13.19 used water with a fluoride concentration ranged from 0.9-1 mg/litre. The 95% CI for the mean was (101.32, 109.99), the minimum score was 71 while the maximum score for IE was 127.
The mean IE of the children whose household water contained fluoride in the range of 0.9-1mg/litre (105.66±13.19); was compared with the mean IE of individuals whose fluoride ranged between 1.1-1.8, mg/l (98.49±11.66; 1.9-2.5 mg/l (93.09 ±12.81). Also, those who used water with 2.6-3mg/l (91.54 ±15.20), 3.1-6mg (100.94±10.66751) and above 6mg/l (98.26±8.92872) in household water. For individuals who used water with a fluoride content range of 0.9-1.0 mg/litre had their IE compared with the IE of the children who used water which had a fluoride range 1.1-1.8 mg/litre however nonsignificant differences were observed with a Tukey HSD where (M=7.170, SE=2.780), p=.168 at 95% CL. Significant differences were noted after a comparison of the IE of the children who used water with 1.9-2.5mg/litre with the IE of the individuals whose household water had fluoride in the range of 0.9-1.0 mg/litre. The Tukey HSD values for the differences were (M=12.566, SE=2.734), p≤.001 at 95%CL. Similarly, those who used water with a fluoride content of 2.6-3.0 mg/litre had their IE compared with the mean IE of those who used water with a fluoride content of 0.9-1.0 mg/litre. Significant differences in the mean IE were observed with a Tukey HSD where the values were (M=14.116, SE=3.219), p≤.001 at 95%CL. However, when the mean IE of those whose water had 3.1-6mg/litre of fluoride was compared with the mean IE of those whose water contained 0.9-1.0 mg/litre, nonsignificant differences were indicated with a Tukey HSD analysis (M=4.720, SE=3.679), p=.905 at 95% CL. Also, those whose household water had ≥6.1mg of fluoride had their IE compared with the IE of those whose water contained 0.9-1.0 mg/litre, and insignificant differences were observed with a Tukey HSD where (M=7.401, SE=2.814), p=.150 at 95% CL.
1.1-1.8 mg/litre of fluoride concentration in household water: Forty-one (15.2%) who used water with a fluoride concentration range of 1.1-1.8 mg/litre had a mean IE of 98.49+/-11.66. The 95% CI for the mean was (94.81, 102.17) while the lowest IE score in this category was 77 and the highest was 127. Individuals whose mean IE was (105.66+/-13.19) and the household water contained fluoride in the ranges of fluoride concentrations in the household water of 1.1-1.8, mg/l was compared with the mean IE of individuals whose household water had a fluoride range 1.9-2.5 mg/l (93.09 +/-12.81). Also, individuals whose water contained fluoride in the ranges of 2.6-3mg/l (91.54 +/-15.20); 3.1-6mg per and above 6mg/litre were compared to that of the children who used water with a fluoride range of 1.1-1.8 mg/l of fluoride. For individuals who used water with a fluoride content range of 1.1-1.8.0 mg/litre had their IE compared with the IE of the children who used water which had a fluoride range 1.9-2.5 mg/litre however nonsignificant differences were observed with a Tukey HSD where (M=5.396, SE=2.680), p=.475 at 95% CL. Multiple comparisons with a Tukey HSD post hoc test indicated non-significant differences in the mean IE with of the children who used water with 1.1-1.8mg/litre when compared to the mean IE of individuals who used water with fluoride concentrations of 2.6-3.0mg/litre; 3.1-6 mg/litre and ≥6.1 mg /litre. The respective Tukey HSD values were 2.6-3.0mg/litre (M=6.946, SE=3.173), p=.362 at 95% CL; 3.1-6 mg/litre (M=-2.449, SE=3.639), p=.998 at 95% CL, and ≥6.1mg /litre (M=.231, SE=2.762), p=1.000 at 95% CL.
Fluoride concentration of 1.9-2.5 mg/litre in household water: The children whose mean IE was 93.09 ±12.81 and they were forty-fours (16.4%) the 95% CI was (89.20, 96.99) while the child with the lowest IE score was 70 and the highest was 124. The children whose household water contained fluoride in the ranges between 1.9-2.5 mg/l (93.09+/-12.81) was compared with the mean IE of individuals whose household water fluoride ranged between 2.6-3mg/l (91.54 ±15.20), 3.1-6mg/l (100.94±10.66751) and above 6 mg/l (98.26±8.92872). The mean differences in intellectual efficiency for the children who used water with 1.9-2.5 mg/litre of fluoride was insignificant from the other categories of fluoride concentration (2.6-3.0 mg/litre; 3.1-6 mg/litre and ≥6.1 mg/litre) in the household water was insignificant with a Tukey HSD post hoc test. The respective values for the Tukey post hoc test were 2.6-3.0 mg/litre; (M=1.549, SE=3.133), p=1.0 at 95% CL; 3.1-6 mg/litre (M=-7.846, SE=3.604), p=.369 at 95% CL; ≥6.1 mg/litre (M=-5.165, SE=2.715), p=.551 at 95% CL.
Fluoride concentration of 2.6-3.0 mg/ in household water: Twenty-four (8.9%) individuals whose mean IE was 91.54 +/-15.20 used water with a fluoride content of 2.6-3 mg/litre. The 95% CI for the mean was (85.1, 97.96) while the lowest IE score was72 and the highest was 128, Figure 6. The mean IE of those whose household water contained fluoride in the ranges between 2.6-3mg/l (91.54 +/-15.20) was compared with the mean IE of individuals whose household water fluoride ranged between 3.1-6m /l. (100.94±10.66751) and above 6 mg/l (98.26±8.92872). The intellectual efficiency of the individuals who used water with household water which contained fluoride in the ranges between 2.6-3mg/l (91.54 +/-15.20); was compared with the mean IE of individuals whose household water fluoride ranged between 3.1-6mg/l (100.94±10.66751) and above 6mg/l (98.26±8.92872). The multiple comparisons with a Tukey HSD post hoc test indicated non-significant differences in the means with the mean difference of (M=-9.395, SE=3.984) p=.267 at 95% CL. The mean IE for children whose water had ≥6.1 mg/litre of fluoride was nonsignificant with M=-6.71, SE=3.20, p=.420 at 95% CL.
3.1-6 mg/litre of fluoride concentration in household water: The mean IE of 100.94±10.66751 was observed among sixteen (5.9%) children whose household water fluoride ranged between 3.1-6 mg/litre. The 95%CI for the mean was (95.25, 106.62). The minimum score for IE for this subcategory was 83 while the highest score was 122. The intellectual efficiency of children who used household water with a fluoride concentration which ranged between 3.1-6mg/l (100.94±10.66751) was compared with the mean IE of individuals whose household water fluoride was above 6mg/l (98.26±8.92872). The differences in the means were insignificant (M=-6.714, SE=3.203), p=.420 with a Tukey HSD post hoc test.
≥6.1 mg/litre household water fluoride concentration: Thirty-nine (14.5%) individuals used water whose fluoride concentration was above 6 mg/litre and they had a mean IE of 98.26±8.92872 with a 95% CI of (95.36, 101.15) and the minimum IE score for the category was 75 while the highest was 116. The children whose household water contained fluoride in the ranges between 1.9-2.5 mg/l (93.09+/-12.81) was compared with the mean IE of individuals whose household water fluoride ranged from 2.6-3mg/l (91.54 ≠15.20), 3.1-6mg (100.94±10.66751) and above 6 mg/l (98.26±8.92872).
Intellectual Efficiency Levels: The 269 adolescents were distributed according to levels of intellect one (0.4%) was intellectually challenged while thirty-four (12.6%) were below average. One hundred and eighty-six (69.1%) of the population had an average level of intellectual efficiency, forty-five (16.7%) had above average while three (1.1%) had a gifted level of intellect. The children had a median IE of two above average Figure 9.
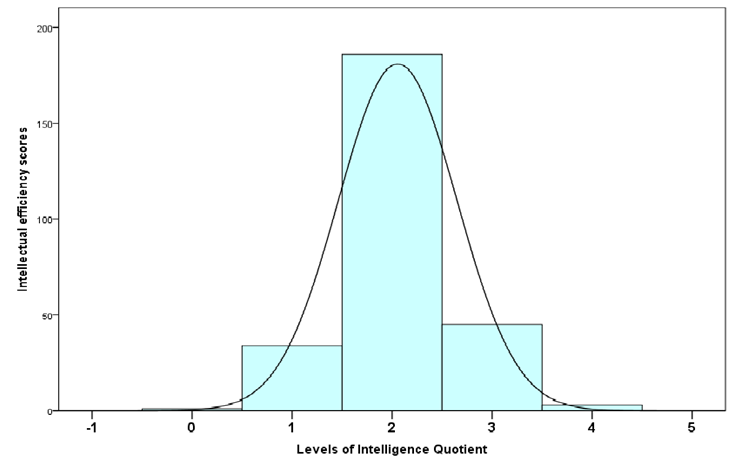
Figure 9. Levels of intellectual Efficiency
Intellectual efficiency levels and gender: The ninety-one (33.8%) boys had one (1.1%) individual who was categorised as gifted, seventeen (18.7%) individuals whose IE level was above average, fifty-four (59.3%) were average, eighteen (19.8%) individuals were below average while one (1.1%) had intellectual challenge, Figure 8. The differences in the intellectual efficiency levels between gender were insignificant with a Mann Whitney U analysis where U=7503, Z=-1.213, p=.225 at 95% CL.
Intellectual efficiency levels and age: The 269 individuals had a mean age of 13.4±.7years were ninety-one (33.8%) boys aged 13-15 years and their mean age 13.5±.8 years while the girls in the same age categories had a mean age of 13.4±.6years. A comparison of the IE levels of individuals aged 13 with the IE levels of fifty-eight (21.6%) individuals aged 14 and twenty-seven (10.03%) aged fifteen years was insignificant differences with a Kruskal Wallis Test analysis where the Chi-square = 2.082, df=2, p =.353 at 95% CL.
Intellectual Efficiency levels and fluoride in the school and environs water supplies
Low fluoride area: The schools and the water environs which was categorised as low fluoride had sixty-eight (25.3%) individuals. Out of the sixty-eight two (2.94%) were gifted while nineteen (27.9%) were above average and forty-two (61.8%) had average IE level. Five (7.7%) below average IE and none was mentally challenged.
Medium fluoride area: The medium fluoride area had a total of thirty-three (12.3%) individuals selected. Out of the thirty-three, one was gifted (3.03%), twelve (36.4%) were above average IE level, seventeen (51.5%) were average while three (9.1%) had a below average IE and none was mentally challenged, Figure 10.
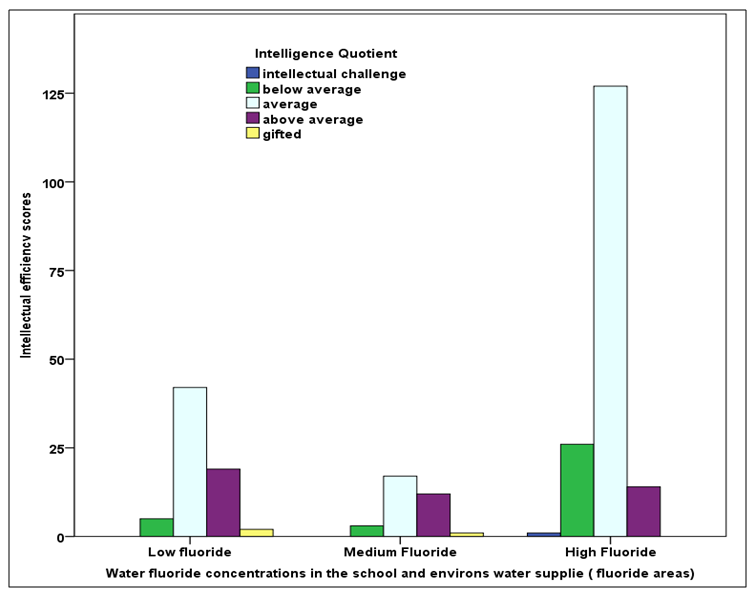
Figure 10. The fluoride concentration in the school and environs water supply in relation to the intellectual efficiency levels
Intellectual Efficiency levels and fluoride concentration in household water
Low fluoride (≤1.0mg/l) in household water: The children whose household water had a low fluoride content in the range of 0.0-1.0 mg/litre were one hundred and five (39.03%) in total; out of whom three (2.86%) had gifted IE level, 34(32.38%) were above average IE, 62(59.05%) had average IE while six (5.71%) were below average and none was mentally challenged Figure 11.
Medium (≥1.1mg/l to≤2.0 mg/l) fluoride in household water: The children whose household water contained medium fluoride concentration were 81(30.1%), out of whom none was gifted, seven (8.6%) were above average, 58(71.6%) were average, 15(18.5%) had below average IE level and one (1.2%) was mentally challenged, Figure 11.
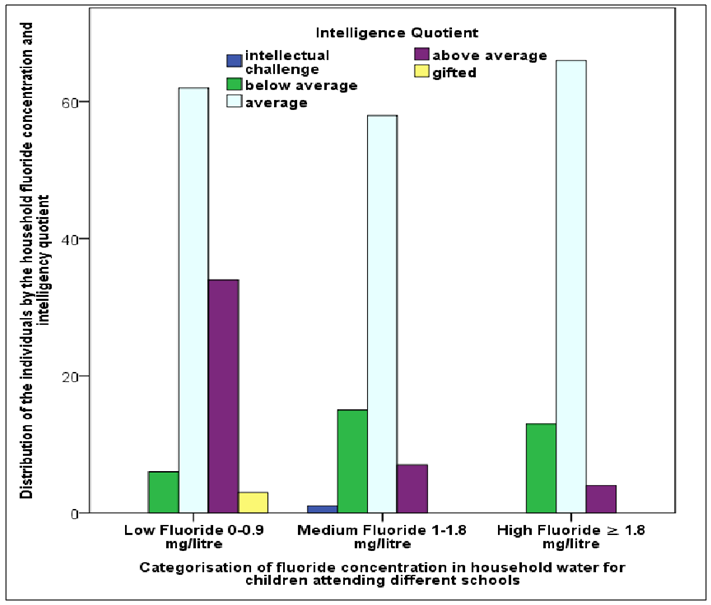
Figure 11. Categorisation of fluoride concentration in household water and the intelligent efficiency levels
High fluoride area: There were 168 (62.5%) schools in the high fluoride area out of whom non-was gifted, fourteen (8.3%) were above average, 127(75.6%) had average IE levels, twenty-six (15.5%) had an IE level of below average and one (0.6%) was mentally challenged, Figure 11. The differences in the intellectual efficiency for individuals who schooled in the low fluoride and the medium fluoride areas was insignificant with a Mann-Whitney U, where U=1049.5, Z=-.598, p=.550. Significant differences were noted when the comparison of the IE levels for individuals in the low fluoride schools and those in the high fluoride schools with a Mann-Whitney U, where U=4158, -4.129, p≤.001 at 95% CL. Also, significant differences were noted between the IE levels of individuals who attended schools in the medium fluoride areas and those who attended schools in the high fluoride areas with a Mann-Whitney U analysis with U=1863.5, Z=-3.755, p ≤.001 at 95% CL.
High (high ≥2.1mg/l) fluoride in household water: The household water with high fluoride concentrations was used by eighty-three (30.9%) individuals, of whom none had gifted IE, four (4.8%) had an IE that was above average, sixty six (79.5%) had an IE that was average while thirteen (15.7%) had a below average IE and none was mentally challenged Figure 11.
The Pearson’s Chi-square showed a significant difference in IE according to water fluoride areas with a chi-square value =31.32, d. F=8, p = 0.001 at 95% CL. The comparison of the intellectual efficiency of the children whose water had low fluoride with the IE of those whose water had medium fluoride, also low fluoride and high fluoride and medium fluoride with high fluoride in the household water. Significant differences in IE of adolescents attending low fluoride and medium fluoride were noted with a Mann-Whitney U where U=2786, Z=-4.75, p≤.001. Similarly, the IE levels of the low fluoride children were different from the IE levels of those using water with high fluoride with a Mann-Whitney U where U=2821, Z =-5.047, p≤.001 at 95% CL. However, insignificant differences were noted in the IE levels of the individuals who used water with medium fluoride and those who used high fluoride with a Mann- Whitney U, where U=3332., Z=-.127. p=.899 at 95% CL.
Intellectual Efficiency levels and subcategorization of the fluoride concentration in household water: Intellectual efficiency levels were examined in relation to the subcategorised fluoride concentrations in the household water which ranged as follows 0.0-0.5mg/litre; 0.6-0.8 mg/litre 0.9-1.0 mg/litre 1.1-1.8 mg per litre; 1.9-2.5 mg/litre, 2.6-3.0 mg/litre; 3.1-6 mg/litre and ≥ 6.1 mg/litre, Figure 12.
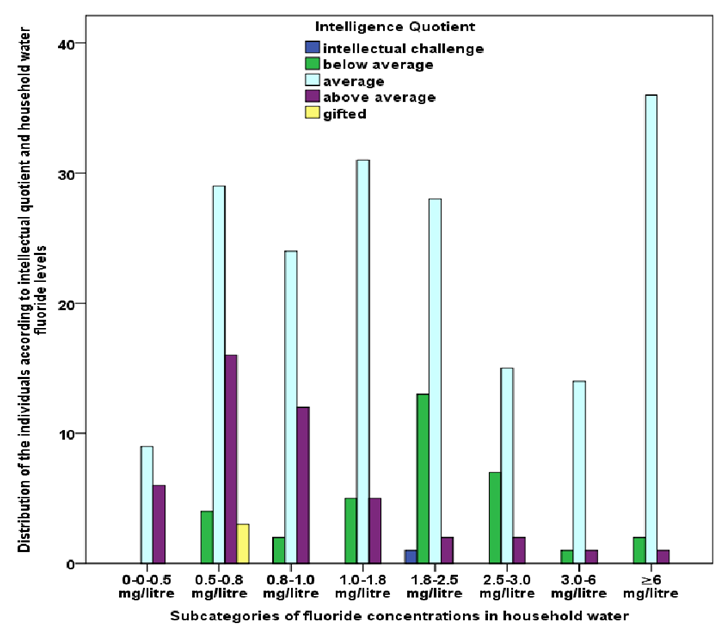
Figure 12. Intellectual efficiency levels and fluoride in household water categorisation
0.0-0.5mg/litre of fluoride concentration in household water: Fifteen (6.6%) children who use water with 0-0.5mg/litre and the IE of fifty-two (26.7%) individuals who use water with a fluoride concentration of 0.6-0.8 mg/litre was compared and found to be different, Figure 12. However, the differences in the IE levels were nonsignificant with a Mann-Whitney U. The value for U was 367.5, Z= -.383, p=.702 at 95% CL.
0-0.5mg/litre vs 0.9-1 mg/litre: Thirty-eight (14.13%) children who used water with 0.6-0.8mg/litre had their IE levels compared with that of fifteen (6.6%) individuals who use water with a fluoride concentration of 0.0-0.5mg/litre. However, the differences in the IE levels was nonsignificant with a Mann-Whitney U. The value for U was 252. Z= -.768, p=-.442 at 95% CI. Forty-one (15.2%) individuals using household water containing 1.1-1.8 mg/litre had their IE levels compared with fifteen (6.6%) individuals whose water had a fluoride content of 0-0.5mg/litre and significant differences in IE levels were indicated with a Mann-Whitney U, where U= 199.5, Z=-2.523, p≤.012 at 95% CL.
Forty-four (16.4%) adolescents whose household water had a fluoride content of 1.9-2.5 mg had their IE compared with 15(6.6%) individuals whose household war had a fluoride concentration of 0-0.5mg/litre. The differences in IE levels were noted to have disagreements with a Mann-Whitney U, where U=150.000, Z=-3.642, p≤0.001 at 95% CL.
Twenty four children whose household water contained 2.6-3 mg/litre had their IE levels compared with the IE levels of fifteen (6.6%) individuals whose household water had a fluoride concentration of 0-0.5mg/litre. Significant differences were noted in the differences in the IE levels with a with a Mann-Whitney U, where U=91.5, Z=-2.944, p≤.003. Eighteen (6.7%) adolescents whose household had 3.1-6 mg/litre of fluoride had their IE levels compared with fifteen (6.6%) individuals whose household water had a fluoride content of 0-0.5mg/ litre. Negligible differences were noted with a Mann-Whitney U, where U=75, Z=-2.334, p=.078 at 95) CL. Fifteen (6.6%) children who used water with 0-0.5mg/litre of fluoride had their IE levels compared with the IE level of thirty-nine (14.5%) individuals who used the water with a fluoride content of ≥6.1 mg/litre. Significant differences were observed between the IE of those who used the low fluoride and those who used the high fluoride Mann-Whitney U, where U=174., Z=-3.535, p≤.001.
0.6-0.8 mg/litre of fluoride concentration in household water: Fifty-two (26.7%) individuals using 0.5-0.8 mg/litre fluoride in the water had their IE levels compared with the IE levels of thirty eighty (14.1%) children who used water with 0.9-1.0 mg/litre. There was the insignificant difference between the IE levels of the two groups of fluoride with a Mann- Whitney U, where U=940, Z=-.448, p=.654, at 95% CL. Forty-one (15.2%) individuals using household water containing 1.1-1.8 mg/litre had their IE levels compared with the IE of fifty-two (26.7%) individuals using 0.6-0.8 mg/litre of fluoride in water. The differences were significant with a Mann Whitney U, where U=788.5, Z=-2.532, p≤.011 at 95% CL. Forty-four (16.4%) adolescents whose household water had a fluoride content of 1.9-2.5 mg/litre had their IE compared with the IE of fifty-two (26.7%) individuals using 0.6-0.8 mg/litre fluoride in water. Significant differences in IE levels were noted with a Mann-Whitney U where the value for U=626 Z=-4.317, p≤.001.
Twenty four (8.92%) children whose household water contained 2.6-3 mg/litre had their IE levels compared with the IE of fifteen (5.6%) individuals whose household water had a fluoride concentration of 0.6-0.8mg/litre. A Mann Whitney U indicated that there were significant differences in the IE levels of the individuals using the different levels of fluoride in the drinking water with U=373.500, Z=-3.150, p≤.002 at 95% CL.
Eighteen (6.7%) adolescents whose household had 3.1-6 mg/litre of fluoride had their IE levels compared with fifty-two (19.33%) individuals using 0.6-0.8 mg/litre of fluoride in water. There were insignificant differences in the IE levels of the two groups with a Mann -Whitney U with value for U=302, Z =-1.927, p=.054.
Fifty-two (19.33%) individuals using 0.6-0.8 mg/litre fluoride in water had their IE levels compared with the IE levels of thirty nine (14.5%) individuals who used the water with a fluoride content of ≥6.1 mg/litre. A Mann-Whitney U indicated significant differences in IE levels with U=711, Z=-3.064, p ≤.001.
Fluoride concentration of 0.9-1.0 mg/litre in household water: Thirty-eighty (14.1%) children who used water with 0.9-1.0 mg/litre had their IE levels compared with the IE levels of forty-one (15.2%) individuals using household water containing 1.1-1.8 mg/litre. There was the insignificant difference between the IE of the two groups of fluoride with a Mann-Whitney U, where U=599.0, Z=-2.187, p=.029, at 95% CL. Forty-one (15.2%) individuals using household water containing 1.1-1.8 mg/litre had their IE levels compared with the IE levels of thirty-eight (14.2%) individuals using 0.9-1.0mg/litre fluoride in water. The differences were significant with a Mann Whitney U, where U=599., Z=-2.187, p≤.029 at 95% CL. Forty-four (16.4%) adolescents whose household water had a fluoride content of 1.9-2.5 mg/litre had their IE levels compared with the IE levels of thirty-eight (14.2%) individuals using 0.9-1.0mg/litre fluoride in water. Significant differences in IE levels were noted with a Mann-Whitney U where the value for U=469, Z=-3.983, p≤,001. Twenty four (8.92%) children whose household water contained 2.6-3 mg/litre had their IE levels compared with the IE of-of thirty-eight (14.2%) individuals using 0.9-1.0mg/litre fluoride in water. A Mann Whitney U indicated that there were significant differences in the IE of the individuals using the different levels of fluoride in the drinking water with U=281, Z=-2.947, p ≤.003 at 95% CL. Eighteen (6.7%) adolescents whose household had 3.1-6 mg/litre of fluoride had their IE levels compared with thirty-eight (14.2%) individuals using 0.9-1.0mg/litre fluoride in water, Figure 12. A Mann Whitney U indicated that there were insignificant differences in the IE levels of the individuals using the different levels of fluoride in the drinking water with U=229, Z=-1.779, p ≤.075. At 95% CL. Thirty-eight (14.2%) individuals using 0.9-1.0mg/litre had their IE levels compared with the IE levels of thirty nine (14.5%) individuals who used the water with a fluoride content of ≥6.1 mg/litre. There were significant differences in the IE levels with a Mann Whitney U with U=538, Z=-2.863, p ≤.004. At 95% CL.
Fluoride concentration of 1.1-1.8 mg per litre in household water: Forty-four (16.4%) adolescents whose household water had a fluoride content of 1.9-2.5 mg/litre had their IE levels compared with the IE levels of forty-one (15.2%) individuals using household water containing 1.1-1.8 mg/litre. Significant differences in IE were noted with a Mann-Whitney U where the value for U= 683.5, Z=-2.373, p≤.018. Twenty four (8.92%) children whose household water contained 2.6-3 mg/litre had their IE levels compared with the IE levels of forty-one (15.2%) individuals using household water containing 1-1.8 mg/litre. A Mann Whitney U indicated that there were insignificant differences in the IE of the individuals using the different levels of fluoride in the drinking water with U=402., Z=-1.531, p =.126 at 95% CL. Sixteen (5.9%) adolescents whose household had 3.1-6 mg/litre of fluoride had their IE levels compared with forty-one (15.2%) individuals using household water containing 1.1-1.8 mg/litre. A Mann Whitney U indicated insignificant differences in the IE levels of the individuals using the different levels of fluoride in the drinking water with U=328, Z=0.000, p =1.0, and (p≤0.05). Forty-one (15.2%) individuals using 0.9-1.0mg/litre had their IE levels compared with the IE levels of thirty-nine (14.5%) individuals who used the water with a fluoride content of ≥6.1 mg/litre. There were no significant differences in the IE levels with a Mann Whitney U with where the value for U=781.5, Z=-.270, p =.787. At 95% CL.
1.9-2.5 mg/litre of fluoride concentration in household water: Twenty four (8.92%) children whose household water contained 2.6-3 mg/litre had their IE levels compared with the IE levels of forty-four (16.4%) adolescents whose household water had a fluoride content of 1.9-2.5 mg/litre. A Mann Whitney U indicated that there were insignificant differences in the IE levels of the individuals using the different levels of fluoride in the drinking water with U=497.5, Z=-.461, p =.645 at 95% CL.
Sixteen (5.9%) adolescents whose household had 3.1-6 mg/litre of fluoride had their IE levels compared with forty-four (16.4%) adolescents whose household water had a fluoride content of 1.9-2.5 mg/litre. A Mann Whitney U indicated insignificant differences in the IE levels of the individuals using the different levels of fluoride in the drinking water with U=261.5, with Z=-1.885, and p = .059 (≤0.05).
The adolescents whose household water had a fluoride content of 1.9-2.5 mg/litre were 44(16.45) had their IE levels compared with the IE levels of thirty nine (14.5%) individuals who used the water with a fluoride content of ≥6.1 mg/litre. There were significant differences in the IE levels with an A Mann Whitney U with U=650, Z=-2.593, p ≤.010 at 95% CL.
Fluoride concentration of 2.5-3.0 mg/litre of fluoride concentration in household water: Sixteen (5.9%) adolescents whose household had 3.1-6 mg/litre of fluoride had their IE levels compared with the IE levels of twenty-four (8.92%) children whose household water contained 2.6-3 mg/litre. A Mann Whitney U indicated that there were insignificant differences in the IE levels of the individuals using the different levels of fluoride in the drinking water with U=154.5, Z=-1.325, p =.185 at 95% CL.
Twenty-four (8.92%) children whose household water contained 2.6-3 mg/litre of fluoride had their IE levels compared with the IE levels of thirty nine (14.5%) individuals who used the water with a fluoride content of ≥6.1 mg/litre. A Mann Whitney U indicated insignificant differences in the IE levels of the individuals using the different levels of fluoride in the drinking water with U=384, Z=-1.741, p = .082 (≤0.05).
3.1-6 mg/litre of fluoride concentration in household water: Thirty-nine (14.5%) individuals who used the water with a fluoride content of ≥6.1mg/litre of fluoride had their IE levels compared with the IE levels of sixteen (5.9%) adolescents whose household had 3.1-6 mg/litre. A Mann Whitney U indicated that there were insignificant differences in the IE levels of the individuals using the different levels of fluoride in the drinking water with U=304.5, Z= -.279, p = .780 at 95% CL.

4. Discussion

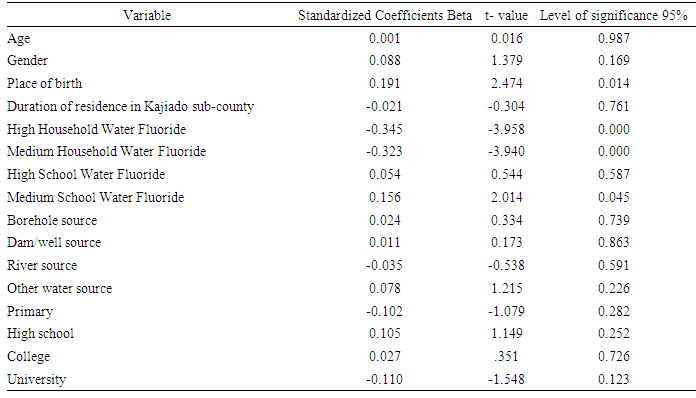
Intellectual efficiency is one of the scales intended to assess the individuals’ social interaction [22]. Those who score high in IE are considered to have the superior intellectual ability, to be self-reliant, independent, dominant and strong. Those who score low are lacking in self-direction, self-discipline, confused, cautious and unambitious [22]. Intelligence is the native aptitude for acquisition while intellectuality represents the amount acquired [23]. The two are correlated. When fluoride is taken in low concentrations, it helps in the development of the human [24, 25]. But in excess, it has both visible and invisible effects [26]. Kenya’s Rift Valley is documented to have one of the highest water fluoride concentration recorded world wide [27]. Kajiado County, Kajiado North sub-county falls in the Great Rift Valley of Kenya. Therefore, it formed a suitable site for the study. The majority, two hundred and forty-two (90%), of those interviewed and who took part in the study were between 13 and 14 years old. In Kenya, this is the school going age at which most children are just completing or about to end their primary school education.
In this study more, females participated than the males. In recent years more emphasis has been placed on the girl child using selective interventions and programmes in the subcounty which may push the boy child to develop lower esteem and loose confidence [28]. The impact of targeted interventions and programmes was evident in this study where the boy child showed minimal interest or was too shy and timid to participate. The study shows that fluoride exposure is associated with reduced intellectual ability in the adolescents. There is a significant inverse relationship between water fluoride levels in both area and household and intellectual efficiency. The degree of exposure in the current study was checked by analysis of the household water fluoride. Several studies have reported the effects of fluoride on intelligence. Despite some confounders, most of the studies have suggested fluoride has a negative impact on intelligence hence intellect [29-32]. The differences in the IE between the low, medium, and high fluoride concentrations was significant with ANOVA p≤.001. The children whose water fluoride had the lowest level was between 0-1.0 mg/litre had the highest mean IE score of 107.47±13.03 followed by eighty-one (30.1%) individuals whose water had medium fluoride content which ranged between 1.1 -1.8mg/ litre whose average IE was 96.20 ±12.39. However, eighty-three (30.9%) children whose household water had the highest fluoride in the water had the lowest mean IE of 96.20 ±12.06. The differences in IE was significant between IE for the children whose water had low and medium then low and high with p≤.001. However, no differences were observed between the mean IE (96.20 ±12.39) of eighty one (30.1%) children who used water with a fluoride content of medium 1.1-1.8 mg/l and eighty three (30.9%) whose mean IE was 96.20 ±1 the 2.06 and had used household water with a higher than 1.8 mg/litre with p=1 at 95% CL. Arsenic and lead have also been shown to cause a decline in intellectual function [29, 32]. In the present study heavy metal presence in the water was not detected, and therefore any deficits in the individual's intellectual efficiency would not be attributed to the effect of this heavy metals. Tang concluded that children in endemic fluoride areas were at higher odds about five more times likely to develop low IQ in comparison to those who resided in areas without fluoride [30, 33]. Fluoride penetrates the placenta and the blood-brain barrier [14, 30, 33, 34]. When subsequently there is continuous exposure to fluoride it negatively affects the CNS during development thus lowering the intellect and intelligence [14, 30, 33, 34]. Although there is lowered intelligence, the mechanism by which this happens is not yet clearly understood. From the evidence in human and animal studies, it has been postulated that there may be an alteration in the membrane lipid leading to reduced cholinesterase activity in the brain. The reduced cholinesterase activity in the brain may change how impulses in the brain are transmitted [26, 35, 36]. Chirumari et al. found that the dopamine, 5-hydroxyindoleacetic) acid, epinephrine, serotonin, homovanille acid and norepinephrine were altered by NaF in the neocortex and hippocampus of the brain of a rat. In endemic fluorosis areas, there are changes in the receptors and the neurotransmitters in the brain of the foetus [37]. Shuseela found that excess fluoride intake leads to impaired function of the thyroid hence causing iodine deficiency [38].

5. Conclusions

Children exposed to fluoride risk developing impaired intellectual efficiency which also affects the IQ. With the Rift Valley being a high fluoride area, there is a risk. The high number of children with below average IE means that in class they do not have a fair chance of learning and there may be a need for the children to be assessed so that they are enabled to build the learning milestones a catch up with the above average. The Kenyan education system also emphasises rote learning with a syllabus which has minimal creative knowledge such as music and art hence children of below average and those who are mentally challenged may find it difficult in excelling.

Limitations

Inheritance influences intellect. Only the fluoride content in water was analysed as the marker for exposure to fluoride, and therefore this does not account for other sources of fluoride to the body. Urine would have been a better measure of all sources of fluoride to the body [39]. Nutritional status was also not considered, and this has been shown to affect intelligence [40, 41]. Although children who had changed their water source since birth were excluded, recall bias is still possible and fluoride in water changes according to seasons. The difference in household water fluoride may be an indicator of parental and society knowledge on effects of fluoride, and therefore an attempt is made to get fluoride free Water source for domestic use.

ACKNOWLEDGEMENTS

The chairman, the dean of the department of paediatric dentistry, School of Dental Sciences, College of Health Sciences, the University of Nairobi for facilitating. The faculty and peers in the department of paediatric dentistry, School of Dental Sciences, for constructive criticism which improved the study. The children and the parents who accepted to participate in the study. The headmistress and the teachers who allowed us to run the study in their schools and for organising the children. The relevant bodies which read and approve the research proposal at the university, county and National level.

References

[1]  S(Ed.) LG. Pathogenesis of Endemic Disease. Sci Press Beijing. 2004:165-173.
[2]  Rango T, Vengosh A, Jeuland M, et al. Fluoride exposure from groundwater as reflected by urinary fluoride and children’s dental fluorosis in the Main Ethiopian Rift Valley. Sci Total Environ. 2014. doi:10.1016/j.scitotenv.2014.07.048.
[3]  Spencer H, Lewin I, Wistrowski E, Samachson J. Fluoride metabolism in man. Am J Med. 1970. doi:10.1016/S0002-9343(70)80062-6.
[4]  Indermitte E, Saava A, Karro E. Exposure to high fluoride drinking water and risk of dental fluorosis in Estonia. Int J Environ Res Public Health. 2009. doi:10.3390/ijerph6020710.
[5]  Buzalaf MAR, Pessan JP, Honório HM, ten Cate JM. Mechanisms of action of fluoride for caries control. In: Fluoride and the Oral Environment.; 2011. doi:10.1159/000325151.
[6]  Oganessian E, Lencova E, Broukal Z. Is systemic fluoride supplementation for dental caries prevention in children still justifiable? Prague Med Rep. 2007.
[7]  Wu C, Gu X, Ge Y, Zhang J, Wang J. Effects of high fluoride and arsenic on brain biochemical indexes and learning-memory in rats. Fluoride. 2006.
[8]  Shivarajashankara YM, Shivashankara AR, Gopalakrishna Bhat P, Muddanna Rao S, Hanumanth Rao S. Histological changes in the brain of young fluoride-intoxicated rats. Fluoride. 2002.
[9]  Mullenix PJ, Denbesten PK, Schunior A, Kernan WJ. Neurotoxicity of sodium fluoride in rats. Neurotoxicol Teratol. 1995. doi:10.1016/0892-0362(94)00070-T.
[10]  Liteplo R, Howe P, Malcolm H, et al. Environmental health criteria 227: Fluorides. Environ Heal Criteria. 2002. doi:10.1016/0043-1354(85)90052-1.
[11]  Sun D. Report on the surveillance of endemic fluorosis of drinking water type in China in 2005 and 2006. Chinese J Endem. 2009. doi:10.3760/cma.j.issn.1000-4955.2009.02.016.
[12]  Shitumbanuma V, Tembo F, Tembo JM, Chilala S, Van Ranst E. Dental fluorosis associated with drinking water from hot springs in Choma district in the southern province, Zambia. Environ Geochem Health. 2007. doi:10.1007/s10653-006-9062-0.
[13]  Suthar S, Garg VK, Jangir S, Kaur S, Goswami N, Singh S. Fluoride contamination in drinking water in rural habitations of Northern Rajasthan, India. Environ Monit Assess. 2008. doi:10.1007/s10661-007-0011-x.
[14]  Trivedi MH, Verma RJ, Chinoy NJ, Patel RS, Sathawara NG. Effect of high fluoride water on intelligence of school children in India. Fluoride. 2007.
[15]  Chen Y, Han F, Zhou Z, et al. Research on the intellectual development of children in high fluoride areas. Fluoride. 2008.
[16]  World health organisation. Guidelines for drinking-water quality: the fourth edition incorporating the first addendum. WHO Libr Cat Data. 2017. doi:10.1016/S1462-0758(00)00006-6.
[17]  Malago J, Makoba E, Muzuka ANN. Fluoride Levels in Surface and Groundwater in Africa: A Review. Am J Water Sci Eng. 2017. doi:10.11648/j.ajwse.20170301.11.
[18]  Thole B. Ground Water Contamination with Fluoride and Potential Fluoride Removal Technologies for East and Southern Africa. In: Perspectives in Water Pollution.; 2013. doi:10.5772/54985.
[19]  Nair KR, Manji F, Gitonga JN. The occurrence and distribution of fluoride in groundwaters of Kenya. East Afr Med J. 1984.
[20]  Chibole O. Epidemiology of Dental Fluorosis in Kenya. J R Soc Promot Health. 1987. doi:10.1177/146642408710700612.
[21]  Wilkinson GS, Robertson GJ. Wide Range Achievement Test (WRAT4). Psychol Assess Resour. 2006.
[22]  Lelland Lip, Robert Erikson DS. Intellectual efficiency a construct validation study. Educ Psychol Meas. 1968;28:595-597.
[23]  Frederic Lyman Wells. Linguistic Ability and Intellectual Efficiency. J Philos Psychol Sci Methods. 3(25):680-687.
[24]  Kim M-J, Kim H-N, Jun E-J, Ha J-E, Han D-H, Kim J-B. Association between estimated fluoride intake and dental caries prevalence among 5-year-old children in Korea. BMC Oral Health. 2015;15(1):169. doi:10.1186/s12903-015-0153-0.
[25]  Tygerberg 2. Louw A J and Chikte U M E. THE STATUS OF RESEARCH IN SOUTH AFRICA 2nd International Workshop on Fluorosis Prevention and Defluoridation of Water. In: ; 1997:15-22.
[26]  Vani ML, Reddy KP. Effects of fluoride accumulation on some enzymes of brain and gastrocnemius muscle of mice. Fluoride. 2000. doi:10.1016/j.proenv.2013.04.026.
[27]  Fawell J, Bailey K, Chilton J, Dahi E, Fewtrell L, Magara Y. Fluoride in Drinking-Water.; 2006. doi:10.1007/BF01783490.
[28]  National Gender and Equality Commission. The status of the boy child in Kenya A Report of emerging perception on the exclusion of the boy child in the gender equality agenda. 2015.
[29]  Rocha-Amador D, Navarro ME, Carrizales L, Morales R, Calderón J. Decreased intelligence in children and exposure to fluoride and arsenic in drinking water. Cad Saude Publica. 2007. doi:10.1590/S0102-311X2007001600018.
[30]  Zhao LB, Liang GH, Zhang DN, Wu XR. Effect of a high fluoride water supply on children’s intelligence. Fluoride. 1996.
[31]  Lu Y, Sun ZR, Wu LN, Wang X, Lu W, Liu SS. Effect of high-fluoride water on intelligence in children. Fluoride. 2000.
[32]  Wang SX, Wang ZH, Cheng XT, et al. Arsenic and fluoride expose in drinking water: Children’s IQ and growth in Shanyin Country, Shanxi Province, China. Environ Health Perspect. 2007. doi:10.1289/ehp.9270.
[33]  Tang QQ, Du J, Ma HH, Jiang SJ, Zhou XJ. Fluoride and children’s intelligence: A meta-analysis. Biol Trace Elem Res. 2008. doi:10.1007/s12011-008-8204-x.
[34]  Spittle B. Psychopharmacology of fluoride: A review. Int Clin Psychopharmacol. 1994. doi:10.1097/00004850-199400920-00002.
[35]  Guan ZZ, Wang YAN, Xiao KQ, et al. Influence of chronic fluorosis on membrane lipids in rat brain. Neurotoxicol Teratol. 1998. doi:10.1016/S0892-0362(97)00136-0.
[36]  Basha PM, Madhusudhan N. Pre and postnatal exposure of fluoride-induced oxidative macromolecular alterations in developing a central nervous system of rat and amelioration by antioxidants. Neurochem Res. 2010. doi:10.1007/s11064-010-0150-2.
[37]  Chirumari K, Reddy PK. Dose-dependent effects of fluoride on neurochemical milieu in the hippocampus and neocortex of rat brain. Fluoride. 2007.
[38]  Susheela AK, Bhatnagar M, Vig K, Mondal NK. Excess fluoride ingestion and thyroid hormone derangements in children living in Delhi, India. Fluoride. 2005. doi:10.1080/02772248.2013.847619.
[39]  Saxena S, Sahay A, Goel P. Effect of fluoride exposure on the intelligence of school children in Madhya Pradesh, India. J Neurosci Rural Pract. 2012. doi:10.4103/0976-3147.98213.
[40]  Liu C, Luo R, Yi H, et al. Soil-transmitted helminths in Southwestern China: A cross-sectional study of links to cognitive ability, nutrition, and school performance among children. PLoS Negl Trop Dis. 2015. doi:10.1371/journal.pntd.0003877.
[41]  Isaacs EB, Gadian DG, Sabatini S, et al. The effect of early human diet on caudate volumes and IQ. Pediatr Res. 2008. doi:10.1203/PDR.0b013e318163a271.