-
Paper Information
- Paper Submission
-
Journal Information
- About This Journal
- Editorial Board
- Current Issue
- Archive
- Author Guidelines
- Contact Us
American Journal of Medicine and Medical Sciences
p-ISSN: 2165-901X e-ISSN: 2165-9036
2018; 8(8): 178-190
doi:10.5923/j.ajmms.20180808.03

Bone Age and Maturity in Association with Anthropometric Measurements of Children and Adolescents Aged Six to Seventeen Years in a High Fluoride Area
 Abstract
 Reference
 Full-Text PDF
 Full-text HTML
Gladys N. Opinya
BDS (UoN), CAGS, MSc. D (Boston USA); PhD (UoN), Professor of Paediatric Dentistry; Department of Paediatric Dentistry & Orthodontics, School of Dental Sciences, College of Health Sciences, University of Nairobi, Kenya
Correspondence to: Gladys N. Opinya, BDS (UoN), CAGS, MSc. D (Boston USA); PhD (UoN), Professor of Paediatric Dentistry; Department of Paediatric Dentistry & Orthodontics, School of Dental Sciences, College of Health Sciences, University of Nairobi, Kenya.
| Email: |  |
Copyright © 2018 The Author(s). Published by Scientific & Academic Publishing.
This work is licensed under the Creative Commons Attribution International License (CC BY).
http://creativecommons.org/licenses/by/4.0/

Bone age is dependent on chronological age, and it is related to growth which may be influenced by nutritional changes. The aim was to examine the association between the chronological, bone age and maturity with anthropometric status and prevalence of malnutrition. The study was in a rural village whose sources of water a borehole with a fluoride content 9.3ppm. The sample was selected based on using Fisher et al., formula and fifty-eight individuals aged six to seventeen were recruited. The Chronological age was determined using the date of birth. Bone age was obtained using Tanner and White method. The nutritional status was assessed using anthropometric measurements. The weight for age was obtained using a Salter scale, while height was obtained using a standard height board. The Z scores were determined based on World Health Organisation Anthroplus. The mean chronological, bone age and maturity for the study group of fifty-eight individuals was 10.57±3.55 years, 9.63±3.40 years, and 0.97±1.19 years respectively. The differences between chronological age and bone age were significant paired t-test, with t= 4.094, d.f=29, p≤0.001 at 95%. Forty-four (75.9%) out of fifty-eight were malnourished and the mean BAZ. The prevalence of chronic malnutrition due to leanness was significant with Chi sq. =43.586, d.f=2, and p≤0.001 at 95%CL. Stunting and underweight showed no significant difference. Linear regression showed a relationship between chronological age and bone age where beta=0.946, t=21.864, and p≤0.001 while bone maturity and chronological age hand a linear relationship with beta=0285, t=2.225, p=0.039 at 95%CL. There were significant associations between chronic leanness for boys aged 6-10 years. Stunting was pronounced in the adolescent girls but not the boys.
Keywords: Children, adolescents, Chronological, Bone age, Bone maturity, Anthropometrics, Malnutrition
Cite this paper: Gladys N. Opinya, Bone Age and Maturity in Association with Anthropometric Measurements of Children and Adolescents Aged Six to Seventeen Years in a High Fluoride Area, American Journal of Medicine and Medical Sciences, Vol. 8 No. 8, 2018, pp. 178-190. doi: 10.5923/j.ajmms.20180808.03.
1. Introduction
- Sufficient nutrition is essential for the proper growth and development for children and adolescents, and anthropometric measurements are a measure of growth and development [1, 2]. Growth and development of children are affected by hormonal changes, genetics and by to environmental factors [3, 4]. The nutritional status is monitored by having individuals who are underweight (acute malnutrition), stunted (chronic malnutrition) and experiencing thinness/leanness as suffering [5, 6]. The nutritional health of a child is determined using the World Health Organisation (WHO) set references as percentiles and Z scores for age and gender. The normal for weight (W/A), height (H/A) and body mass index for age (BMI/A); the median percentile is zero, and it is 50th. The median Z score is zero SD for weight (WAZ), weight for height for age (WHAZ), height (HAZ), and body mass index (BAZ). However, the percentiles and z scores for values for weight and weight for height are range from the 4th up to the 85th percentile or from -1.99SD to + 1.99 SD for z scores. Hence the percentiles and their corresponding z scores for weight for age have been given as <-0-2nd percentile as equivalent to–3SD. The 2nd-3rd percentile is Z score –2SD. Height for age the 2-3rd percentile as equivalent to –2SD and it has been categorised as HAZ scores for chronic malnutrition associated with stunted growth in both children and adolescents. The average percentiles are from the above the 5th percentile or the Z score –1.64SD up to the 85th or z score + 1.04SD. A healthy body mass index for age (BMI/A) is considered to be between 18.5 to 24.9kg/height/height. An individual weighing 18.5 kg/height/height is considered to be underweight and thus below the 5th percentile. Below the 5th percentile or from below–1.96SD reported as thinness or leanness. Overweight is 25-29.9 kg/height/height or the 85th to below 95th percentile [2, 3]. Individuals from the 85th percentile or +1.04SD to the 97.7th are considered to be moderately obese. Above the 98th percentile or +2SD up to the 99.8th percentile, -3SD are overly overweight [5-7]. The height of a child when standing is a physiological measure of a period when maximum bone growth rate occurs. Hence, peak height velocity is used as a tool to determine growth and maturity. The period of maximum bone growth rate for standing height is a positive sign of bone maturity [8]. Therefore, it is a reliable standard sign to predict the past and future growth over an extended period in children and adolescents. The female pubertal bone growth has been found to correlates with the start of the menstrual cycle which also corresponds to the period of maximum bone growth rate. These phases of bone maturity occur at age's 11-years, twelve and thirteen. Bone growth for females starts early around the age of 9-years, and it is at a maximum peak at age 11.5 years. While the boys increased, bone growth begins at the age of 11 years and peaks at age 13.5 years. An increase in height for age is an indicator of linear and cumulative growth over a period. [8]. Adolescents who have ha early childhood malnutrition where there was stunting of stature have been reported to have delayed the onset of puberty and delayed pubertal growth [9-11].Growth is related to the chronological and bone age of a person. Bone age is a measure of the physical age of an individual, and it has been documented to be a determinant of adult height. Bone age has been reported to lack behind by about 2.5 years [12, 13]. Facial growth correlates with bone maturity as proved by the hand wrist radiograph analysis in normal growing children [14]. Children whose bone maturity was delayed or had a low bone age were noted to have a delay in the facial growth, and in particular, the mandible was found to be the most vulnerable to a slowdown in facial growth [15]. Radiographic examination of the levels of bone maturity individuals has been used to the physical body maturity of person (s) by gender and age and race. These determinations have been used in forensic identifications, in dentistry to establish the appropriate time to initiate specific treatment which involves tooth movement in relation to facial bones. There are no studies in Kenya which have looked at bone age and maturity pre-adolescents and adolescents about their nutritional status from a high fluoride area.The study aimed to establish any of the relationship between chronological age, bone age and maturity with anthropometrics and nutritional status of children aged 6-17 -years living in a high fluoride area.
2. Materials and Methods
- The area for the study was a rural community on a 269-acre plantation. There were four sources of public water three of which were surface water with a fluoride content ranging from 0.2-0.65. The fourth water source had a fluoride content of 10ppm. One hundred and thirty households used water with a fluoride content of 10ppm. The nutritional study involved 105 children drawn from a total of 168 children and adolescents living in 138 homes. Out of these houses, children who were breastfeeding were used as the criteria to select the older siblings into the nutritional status survey. In total there were 105 infants, toddlers, children, and adolescents. The 105 children from the thirty households had thirty breastfeeding mothers.Out of the 105 individuals, 63 (60%) aged between 5.1-17 years living in the thirty homes were recruited in the nutritional study. Out of the sixty-three children, fifty eighty had participated in both the dietary research and the radiographic survey. Nutritional status was used to establish the anthropometric measurements of the children. The height was determined using a standard height board. The height measurements were done by having the child stand upright with the buttocks and occiput touching the measuring board and height was measured to the nearest 0.5 of a centimetre. The weight for age was determined using a Salter scale for children who could stand upright. The toddlers were placed in a knapsack then weighed to the nearest 0.1 kg. Two measurements were made for the children, and the mean was recorded for both weight and height. The data for age in months, weight and height were entered in the WHO anthroplus program from which the body mass index, were determined. The growth indicators weight for age Z-score (WAZ), and height-for-age Z scores (HAZ) and body mass index for age Z scores (BAZ) were calculated [16]. A hand and wrist radiograph were obtained for each of the 105 children were examined according to the recommendations of Tanner et al. 1975. One radiographer took the radiographs which were developed under standardised conditions. Skeletal age, for each radiograph, was assessed blindly according to the Tanner White 2 (TW2) method of Tanner et al. 1975 [13]. In this procedure, each of the 20 biologically selected hand and wrist bones was scored on a scale of 1-9 well-categorised rating stages. The skeletal age was obtained by adding the points for such radiograph while skeletal maturity was achieved by subtracting bone age from chronological age for each child [12]. Chronological age was recorded in years, and it was considered the number of years the child had lived from birth [17]. Hence it was calculated from the date of delivery as was recorded in the school register. Children were excluded from the radiological study if they were not born and raised in the community. The children must have been using drinking water with a low fluoride content of 0.2-0. 65ppm from birth to the time of study and if they were below six years of age. The analysis of the data was achieved by using SPSS version 17, and the results are presented in tables using descriptive, Spearman's rho and multiple variables which would significantly be associated with undernutrition were analysed using descriptive statistics, one sample t-test, ANOVA, paired t-test and linear regression models. Ethical approval of the study was done by the relevant ethical bodies and clearance from the appropriate government offices at the village and national level. The parents of the children have explained the purpose of the study and asked if they and their children would participate. The mothers were asked if they would be prepared to ask permission to be away from the workstation. The researcher had before the start of the study negotiated with the management for the households which were to be involved in the survey so that the mothers did not get their month-end pay deducted because of the missed work-day. Children withdrew from the study at any time without any consequences. Children were confirmed to be malnourished were referred to the nearest public health service. Children with medical conditions were assisted to access the public health facilities.
3. Results
- The mean number of years that each family had resided in Twiga was 9.6 years, and the families had lived in the same household using one particular water source for 9.1 years. There was intro community migration from one residential cluster to another. The movement was highest among the families who used water with 0.65 ppm in a group which used 10ppm fluoride. Out of the 107 children fifty-eight, 54.2% aged 6-17 years were selected to participate in the anthropometric study as they had also been recruited for the radiographic examination. The radiographic findings were correlated with the anthropometric survey findings for individuals aged 6-17 years. The 58 children and adolescents had a respective mean chronological and bone age of 10.57±3.55 years (range 5.5-17.92 years) and 9.63±3.40 (4.48 to 16.67 years) while bone maturity was 0.97±1.19 years (-0,06 to 5.17 years) Figure 1. Simple linear regression showed that there was a linear relationship between chronological age and bone age with beta=0.946, t=21.864, and p≤0.001 at 95%CL; also bone maturity had a positive relationship with chronological age beta=0285, t=2.225, p=0.030 at 95% CL.
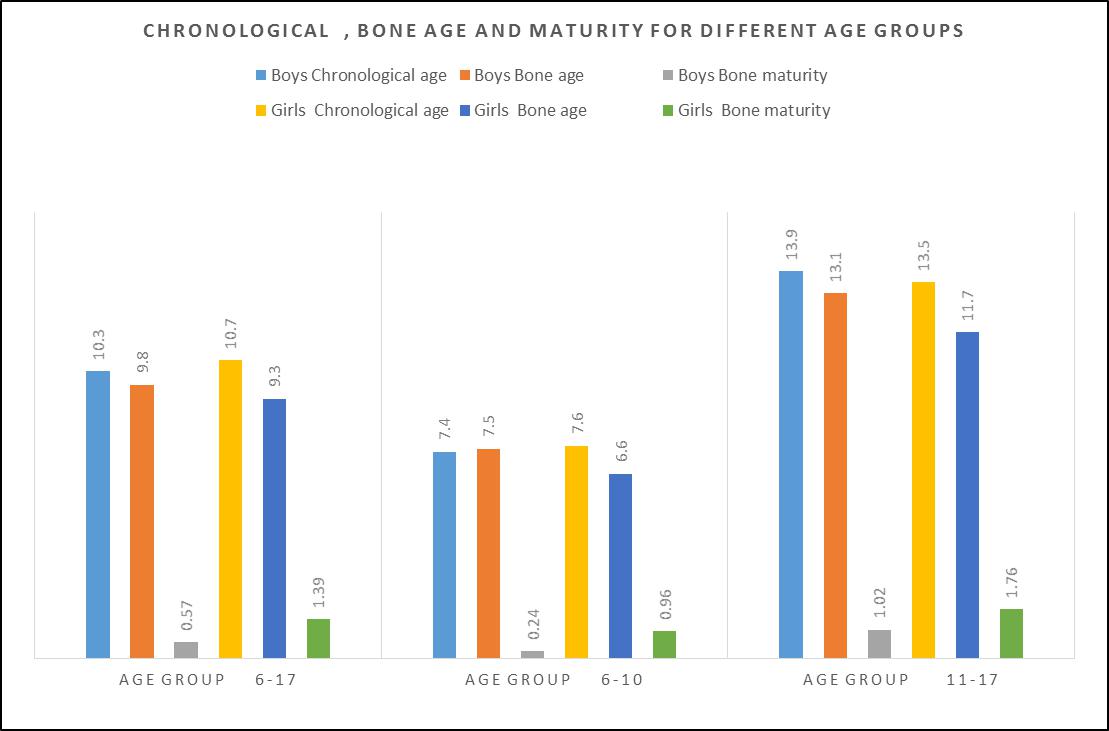 | Figure 1. Chronological, bone age and maturity for different age groups n=58 |
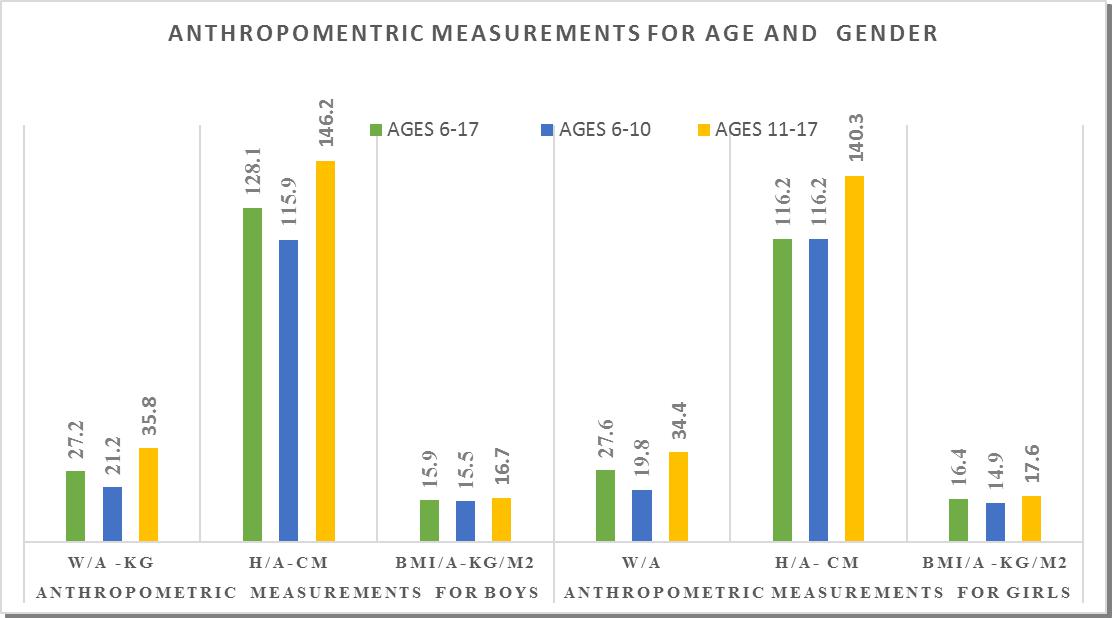 | Figure 2. Anthropometric measurements by gender and age group for children |
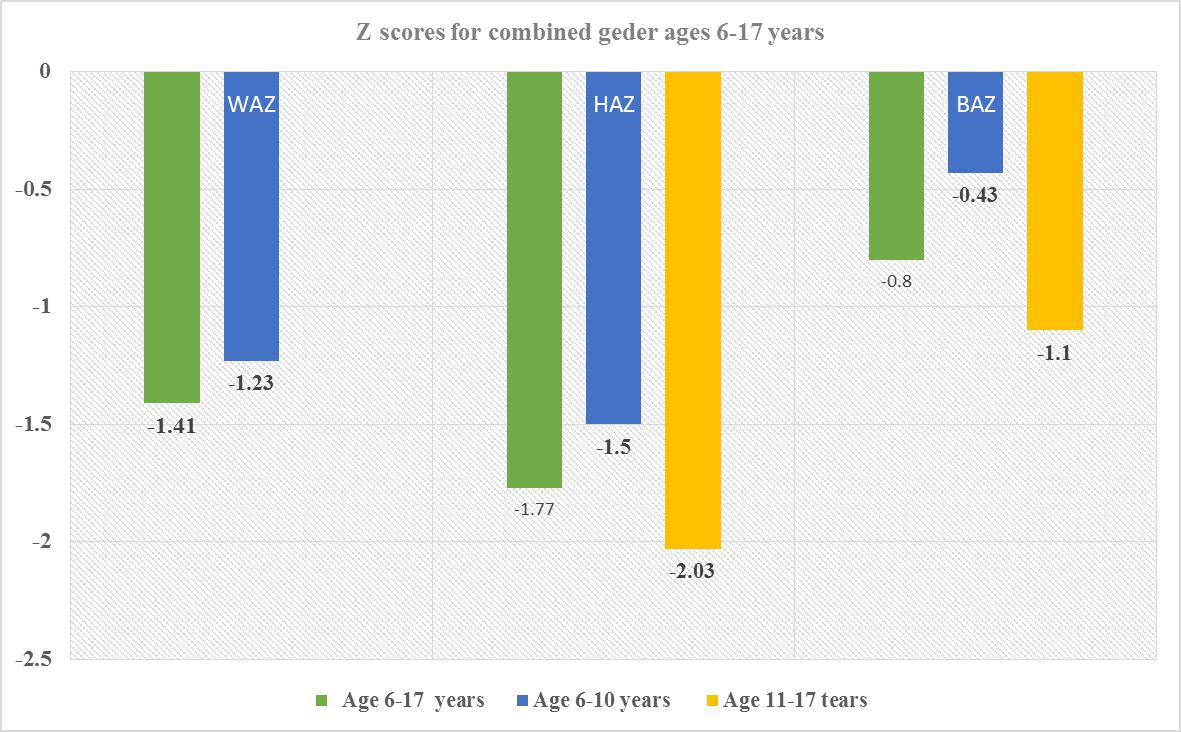 | Figure 3. Z scores for combined gender for ages 6-17 years |
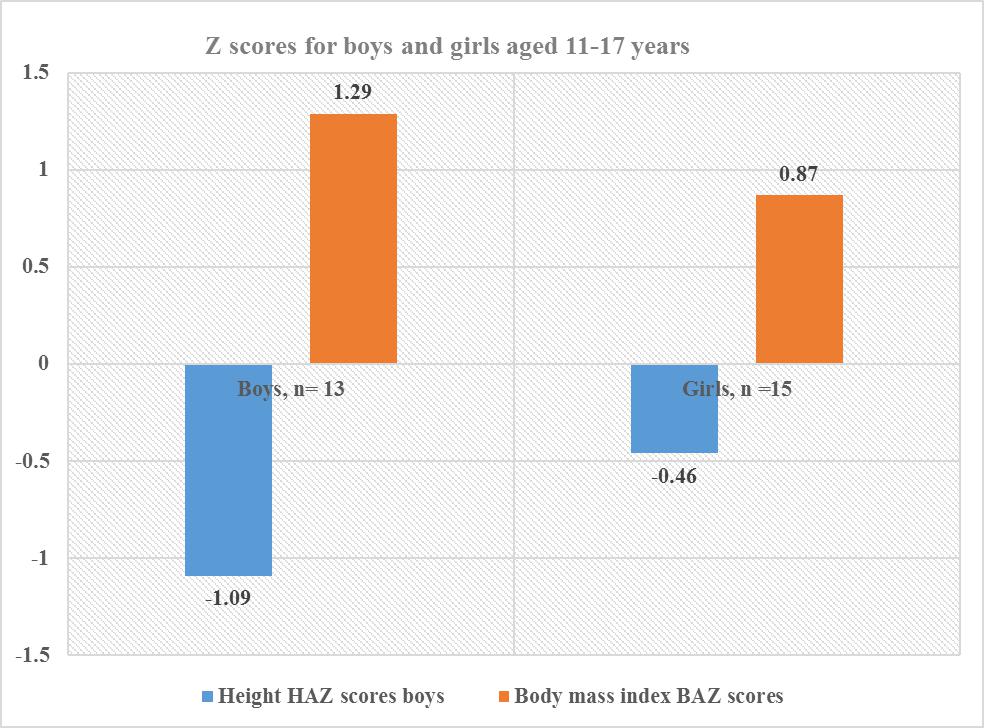 | Figure 4. Z scores for combined gender for the adolescent boys and girls age 11-17 years |
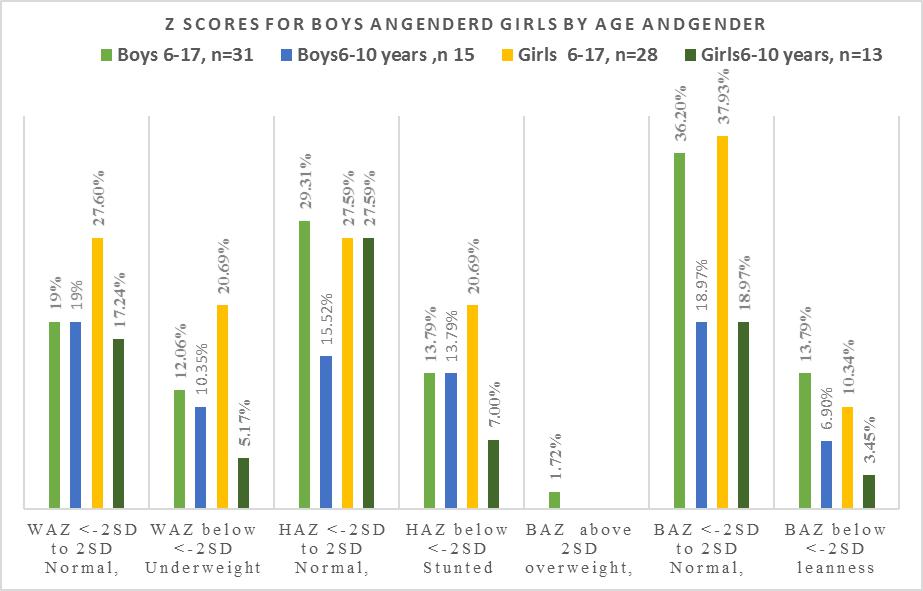 | Figure 5. Prevalence of malnutrition in boys and girls by and gender |
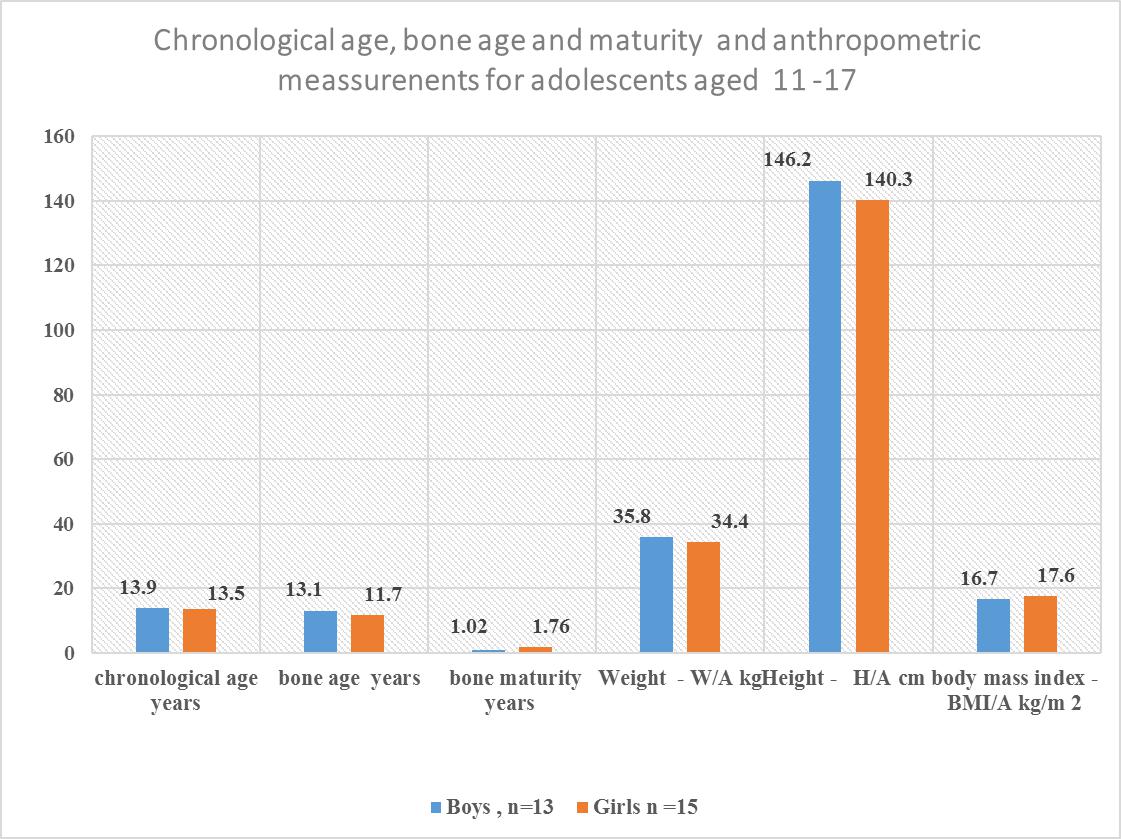 | Figure 6. Chronology bone age and maturity and anthropometric measurements for Adolescents aged 11-17 years |
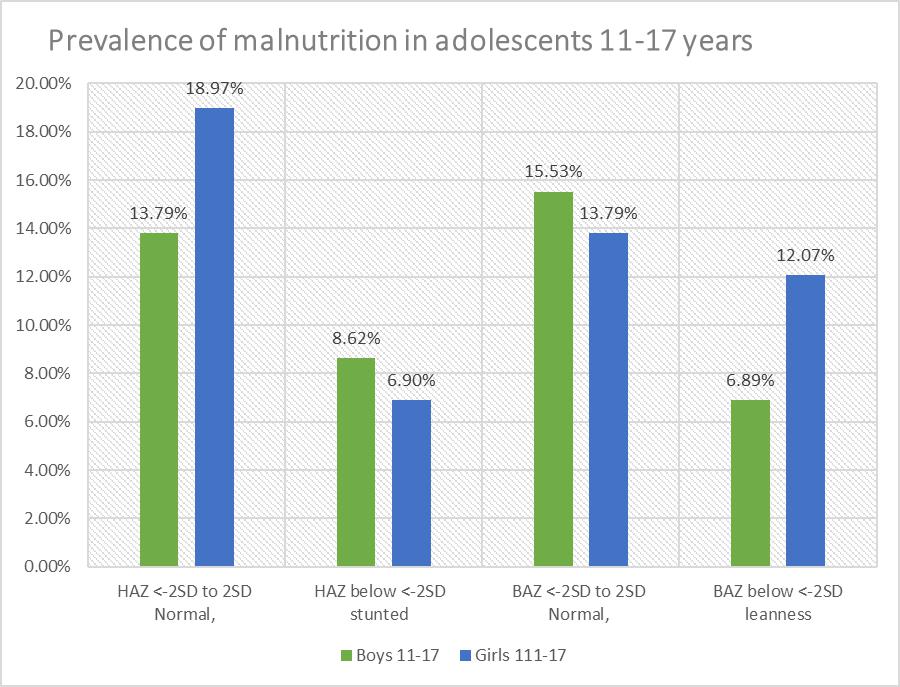 | Figure 7. Prevalence and severity of malnutrition in adolescents 11-17 years, n=28 |
4. Discussion
- Each family which was involved in the study had stayed in the community for a minimum of 9.6 years, and each stayed in the same household for 9.1 years. The low migration into and out of the village ensured that the children were exposed to the same environment during the period of development and growth. Hence. The confounding environmental factors such as dietary intake, water fluoride levels may have had a near uniform impact on the children when genetic conditions were excluded. There were ten children whose caregivers reported they were 23 months at the time of migration into the community. However, there were differences in their bone age and nutritional status when they were compared to the other children. The mean chronological age was 10.5 for the fifty-eight involved in the skeletal age study who also participated in the nutritional status study. There was a significant difference between chronological age, and bone age for age groups 6-17 years, and 11-17 years with the respective values for chronological age and bone age in the age groups for combined boys and girls p≤0.001 for those aged 6-17 years while those aged 11-17 years, and p≤0.01 at 95% confidence interval. Similarly, girls aged 6-17also had a relationship between bone age and chronological age with p=0.001. The respective mean chronological age for the adolescent boys and girls was 13.9 ±2.2years and 13.5±2.7years while their corresponding bone ages were boys 13.1+2.1years and for the girls 11.7+3.3years. A comparison of the boys chronological age with their bone age showed the bone lagged behind the chronological age by 0.8 years while the girls lagged behind their chronological age by 1.8 years. There was a strong correlation between chronological and bone age for boys and girls aged 11-17 years, p=0. 001. However, this finding differs from Greulich and Pyle report where the chronological age and bone age were reported to be of the same value and where there was a difference between the two ages, the difference was 0.5 to 1 years [12].For both boys and girls aged 6-10, there was no relationship between the chronological and bone age lagged behind by 1 to 1.8 years. The lack of association may be due to the fact the age of 6-10 years there was minimal growth compared to the 11-17 year age groups for both genders. Also, there were four children whose bone age dropped from the 6-10 year age bracket to below 4.8 years this may have influenced the outcome. However, in the current study, the difference in bone maturity ranged between minus 0.6 and 4.8 years which was between five to ten times lower than what was reported by Greulich and Pyle [12]. Studies have shown that underlying medical conditions retard bone maturity [18]. There was noted to be a wide range in bone maturity between negative 0.06 and 4.8 years. The wide range in bone maturity is an indication of some of the children in this age group being severely stunted in growth. In the six-year age group, it was noted that five children had a bone age of 4.5 years and whose mean bone maturity was delayed by 1.5 years. Strong positive correlations were observed between the chronological age and bone age, p=0.001. However, the chronological age had a weak relationship with the bone maturity p=0.030. A recent overview of research articles and a meta-analysis indicated that some of the differences or similarities between the chronological age and the bone age might be due to what was termed as age “mimicry” [18]. However, in the analysis it was not indicated if the studies which had been selected was for individuals who were free of underlying medical challenges due to environmental contaminants such as fluoride or the health of the nutritional status was compromised.Bone age and maturity are influenced by both gender and age, in this study the boys aged 6-17 years was 10.3±3.6, and the bone age 9.8±3 and the bone maturity was 0.6±0.7 and ranged between 0.01 to 3.17 years with a mean range of with a mean interval 3.16 year. The wide range in bone maturity may be due to chronic malnutrition which resulted in stunting in growth and possible delayed, altered physiological functions at the cellular level. Bone growth and maturity have been used as an indicator to assess the nutritional status of children and in cases where the bone growth and maturity have been found to be delayed the children have been observed to have a poor nutritional status [19, 20].The nutrition condition of the children was based on WAZ scores ranged from <-3SD to +2 SD about the WHO reference median. There were thirty 51.7% children of both genders aged 6-10 who had a mean WAZ score which ranged between <-1.96 SD to +1.99SD about the WHO reference median zero SD. In this study, the children WAZ were among the 2.5th (<-1.96, 5th percentile with <-1.64, 15th percentile, <-1.04; 16 the percentile. The world health organisation has correlated the percentiles with the Z scores as follows 0.2nd with Z score <-3SD, <-150th percentile is the median, and it is zero SD. The 84th percentile is equivalent to +1SD, 85 percentile, +1.04, 95th percentile as +1.64, 97.5TH percentile +2 and the 99.8th percentile equivalent to +3which a tendency to obesity. Hence for children aged 6-10 the WAZ of thirty-one children was between 2.5th <-1.96 to 85 percentile, +1.04. Prevalence of malnutrition was reported as moderate and severe; where 9 (15.5%) children were moderately underweight WAZ, <-2.99 to <-2 while those severely underweight were 21(36.2%) with WAZ <-3 out fifty-eight children. According to the WHO underweight or wasting is a sign of recent acute malnutrition. Hence thirty-one children aged 6-10 years who underweight had severe malnutrition. The total number of children who were underweight was thirty (51.7% out of 5; therefore, the children aged 6-10 years in this community may be categorised exhibiting very high malnutrition ≥ 30% [2].There was a total of eighteen 31 % boys aged 6-17 out of fifty-eight individuals of whom 11(19%) had standard W/A for on the WHO reference standard and the Z scores, -1.99 and +1.99 while 7(12%) were underweight. Thirty-one 29.3% out of the fifty-eight were boys aged six to seventeen of whom 17 had normal HAZ which ranged between, -1.99 to +1.99 and 14(24.2%) were stunted in growth. For the BAZ 21(36.2%) had average z scores about the WHO reference standard; eight 13.8% had low BMI, and two (3.4%) children were categorised as obese. Boys aged 6-10 were seventeen with six 10.3% being underweight while eleven (19%) had acceptable weight. The height for age z scores nine (15.5) had a height within the normal WHO reference standards while eight 13.8% were stunted. There were thirteen adolescent boys aged 11-17 years, and their Z scores showed eight (13.8%) had average height while five 8.6% were stunted. In the same age group BAZ, nine (15.9%) had acceptable BAZ scores while four (6.9%) had low BAZ. Girls aged 6-10 years were thirteen (22.4%) out of fifty-eight, and their nutritional status was WAZ 10 (17.2%) had average z scores while three (5.2%) were underweight. The KNDHS have reported underweight and wasting in the under five years to have declined in the last 15 years from 18% to 11%. Stunting has reduced from 38% to 26% for children below five years. Body wasting was observed to have reduced from 7% to 4%. Malnutritional in the children below five years of age is known to affect stature in adolescents [21, 22].There were twenty-eight girls in the age group 6-17 out of whom sixteen (27.8%) had HAZ within the normal range of the WHO standard while twelve (20.7%) were stunted. Twenty-Two (37.9%) individuals had BAZ scores, which were healthy between, -1.99 and +1.99. There were six (10.3%) individuals with low z scores <-3 to <-2. It has been shown that girls whose BMI increased by <-2 SD had a corresponding increase in dehydroepiandrosterone (DHEA) and the onset of puberty, hence in the girls in this study who had low BAZ scores may have delayed the onset of menarche [23]. The height for age z scores the 6-10-year-olds the respective normal, and low HAZ nine (15%) had average while 4 (6.8%) had low Z score below <-2 SD. Height for age is an indicator of linear and cumulative growth over a period. Height for age Z score below minus <-2 standard deviations below the median for height for age is an indication of stunting. Kenya health demographic survey 2014 reported 29% of the children aged 0-5 years living in rural communities to be stunted [24]. Stunting in children occurs when a child fails to access adequate food over an extended period. Children with stunting are vulnerable to chronic illness and other environmental [25]. The stunting has been observed in the ten-year-olds, and it has been associated with maternal and environmental determinants [26]. Stunting in pre-adolescents and adolescents interferes with linear growth in a child, and it has been associated with underweight, wasting and leanness which also have been undernutrition and high mortality and poor learning capacity and increased mortality [2, 27]. In Africa stunting in early life has been reported to be 40% and it is known that stunting is associated with impaired cognitive development [28, 29]. For the BAZ scores, eleven (19%) had z scores within the normal range whiles two (3.4%) had low z scores. The height for age Z scores for fifteen (25.8%) adolescent girls, where seven (12.1%) had standard z scores and eight (13.9%) were stunted in growth. The BAZ scores out of fifteen 11(19%) had z score within the WHO reference range while four (6.9%) had low BAZ scores. Stunting and things were reported to be associated with delayed growth were up to between 1.5 to 2 years in adolescent girls in western Kenya region [2]. Also, short stature has been associated with undernutrition in early childhood and adolescent [30]. Recent research information on nutritional status of adolescents in Kenya and in particular the adolescent boys is scanty. However, a global nutrition report has documented 12% leases and 1% stunting in women of reproductive age form 15 years in Kenya [31]. Kulin et al. reported childhood malnutrition which resulted in a delayed onset of pubertal growth up to 3years for malnourished boys and two years delayed growth in puberty for girls from poor rural communities [4]. Children and adolescents who are stunted are vulnerable to disease as their body immunity is compromised. Secondly, when exposed to environmental toxins such as fluoride, they are susceptible to toxicity as their fluoride is a chemical which is dose related to body weight. Though the children did not have any signs of clinical oedema, the siblings from the same households were noted to have symptoms of malnutrition with browning and thinning of the hair. The differences in the reported findings may be due to the fact the sugarcane growing region the people owned the plantations compare to the current study where the children were drawn from a community which did not own the land on which they practised kitchen gardens. The lack of land to grow the necessary food may have created a situation of food insecurity. Secondly, in seasons of sugarcane harvest, the purchasing power of the farmers would increase as they earned from the yield compared to the families in the current study where the monthly income at the time of the survey was US dollars fifteen. Inadequate income and large households could have led to insufficient food. The western Kenya region has good surface water, and there are communal boreholes whose fluoride content is low [2]. The mean bone age lacked behind by as much as 4.8 years for five children aged six years this means that the bone growth was delayed by 1.5 years. There was a healthy relationship between chronological age and bone age, and this finding is in agreement with other studies [10].The height of a child when standing is a physiological measure of a period when maximum bone growth rate occurs. Female bone growth correlates with the start of the menstrual cycle which also corresponds to the stage of maximum bone growth rate. These phases of bone maturity may occur at age's 11-years, twelve and thirteen. Bone growth for females starts early around the age of 9-years, and it is at a maximum peak at age 11.5 years. While the boys increased, bone growth begins at the age of 11 years and peaks at age 13.5 years [4]. The period of maximum bone growth rate for standing height is used as a positive sign of bone maturity. Therefore, it may be a reliable standard sign to predict the past and future growth over an extended period in children and adolescents. Radiographic determination of the levels of bone maturity of the individual is used to establish body maturity of an individual (s) by gender and age and race may occur. Facial growth correlates to bone maturity has been shown to correspond to hand wrist radiograph analysis in healthy growing children. These determinations have been used in dentistry to establish the appropriate time to initiate specific treatment which involves tooth movement in relation to facial bones [33]. There are no studies in Kenya which have looked at bone maturity of boys and girls in pre-adolescence and during pubertal growth.Height for age HAZ involved 58 children who also had been involved in the radiographic examination. In total there were forty-one (70.7%) out of fifty-eight children who were stunted in growth. When children were categorised according to the severity of malnutrition, there were 16(27.6% who were stunted and 25 (43.1%) were severely stunted. According to WHO, this community has a high prevalence of malnutrition ≥ as it is 40% according to the WHO cut off public health significance [25]. A recent study in Ethiopia reported some of the anthropometric determinants to be the child’s gender, age and maternal Mid-Upper Arm Circumference (MUAC) and education. Also, open defecation was a risk factor to a child’s anthropometric which may be associated with maternal access to food and the household food security [26].In this study forty-two 72.4%, individuals had a healthy BMI; 14(27.6) had a low BMI, and two (3.4%) children tended towards obesity. As concerns, the severity of malnutrition 44(75.8%) had normal BAZ which ranged between <-1.90SDto +1.51SD while 2(3.4%), children were obese and 12(20.7%) had BAZ scores between <-3SD to <-2D. This finding contradicts the findings associated with HAZ scores for severity of chronic malnutrition which is at 70.7%, with 43% of the stunted children being severely stunted. This different result may be explained by the fact that BMI is weight in kg/m2 of height. Hence when the height is low due to stunted growth the body weight in kg/height/height is high. Secondly, the children stunted in growth may be at a transient stage of Kwashiorkor/marasmus and therefore retaining of body fluids thus giving false normal weight consequently false BMI which appears normal. The Kenya national health survey 2014 has reported the indicators for malnutrition as wasting 4%, stunting 26%, and eleven percent as underweight in children aged five years and below. In the current study, underweight has accounted for 51.7% which 4.7 times the national value, stunting at 70.7% is 2.7 times higher. Low BMI is related to delayed physiological maturity where there is delayed adolescent growth spurt and for the girls delayed the onset of menarche [24].Stunting associated with chronic malnutrition due to prolonged poor nutritional lack and children who are stunted in growth are poor performers in school. They may also be vulnerable to infections and environmental toxins such as fluoride. A Fluoride dose is weight related hence, who were stunted may even be more vulnerable to low fluoride doses when suffering from malnutrition in both early childhood and adolescents. However, when age was related to the Z scores, there was no relationship. Bone age and maturity correlated positively with the percentile anthropometric value and not the Z scores.However, the correlation between bone maturities had no association with body mass index and the Z scores. Bone maturity strongly correlated with height for age percentiles and not the Z scores for WAZ, HAZ, and BAZ. Current research has reported a rise in stunting in children less than five years of age. It has been estimated that by 2015 66% of children in an Africa will be stunted in growth by below <-2 [1] Childhood undernourishment is related to short adult height and for girls, it may result in giving birth to underweight babies and stunting is associated with a child’ cognitive development and poor school performance. From the WHO global database on the growth and development of a child stunting in Kenyan children aged <5 years has a prevalence of 30-39% [32]. However, children and adolescents afflicted with undernutrition may have stunting and leanness which may affect even the facial and jaw growth delayed development and eruption of the late mineralisation and erupting teeth [33, 34]. Adolescents with delayed growth milestones may have low age given to them when actually when they are older.Although malnutrition has been associated with delayed bone maturity, recent studies have shown that cellular exposure of high doses fluoride interferes with cellular function in both animals and humans. In human’s fluoride is known to bind to and inhibit functional amino acid groups of the active centres in enzymes of the glycolytic pathway and Krebs pathway. Fluoride interacts with a diverse range of physiological processes in cells. These processes include gene expression, cell cycle and proliferation, respiration, apoptosis and oxidative stress among others. The mechanisms by which it either enhances or inhibits these processes are thought to be through modulating a variety of signalling pathways [35, 36]. Fluoride ions further inhibit cellular respiration and decrease the production of ATP by negatively affecting sodium and potassium ATPases. The interference with the Krebs cycle by fluoride also create artificial malnutrition where the body cells are starved of energy due to the interference with the ATP [37].Also, fluoride inhibits protein secretion and synthesis, as well as influencing signal pathways for cellular proliferation. Other proteins affected include the mitogen-activated protein kinase, p53 (hence cell cycle regulation is modified), activator protein 1 (AP-1) and nuclear factor kappa b [38]. The interference in the cellular function may be associated with some of the children who had both bone and joint deformities and on the X-ray the month eaten appearances of radiolucencies with striae of radiopaque appearance.