-
Paper Information
- Next Paper
- Paper Submission
-
Journal Information
- About This Journal
- Editorial Board
- Current Issue
- Archive
- Author Guidelines
- Contact Us
American Journal of Medicine and Medical Sciences
p-ISSN: 2165-901X e-ISSN: 2165-9036
2017; 7(1): 363-368
doi:10.5923/j.ajmms.20170711.01

A Comparison of Atherogenic Indices among Untreated Hypertensives in a Tertiary Hospital in Southern Nigeria
 Abstract
 Reference
 Full-Text PDF
 Full-text HTML
Akpa Maclean Romokere1, Unamba Ndubuisi Norbert2
1Department of Medicine, Faculty Clinical Sciences, University of Portharcourt, Portharcourt, Nigeria
2Department of Medicine, University of Portharcourt Teaching Hospital, Portharcourt, Nigeria
Correspondence to: Unamba Ndubuisi Norbert, Department of Medicine, University of Portharcourt Teaching Hospital, Portharcourt, Nigeria.
| Email: |  |
Copyright © 2017 Scientific & Academic Publishing. All Rights Reserved.
This work is licensed under the Creative Commons Attribution International License (CC BY).
http://creativecommons.org/licenses/by/4.0/

BACKGROUND: Cardiovascular disease (CVD) is the major cause of deaths worldwide because of increasing prevalence of hypertension, the major risk factor. Clustering of hypertension and dyslipidemia increases cardiovascular morbidity and mortality. Several atherogenic indices have been derived from standard lipid profiles measurement in an attempt to enhance predictive capacity of the lipid profile in CVD management. OBJECTIVES: To measure plasma lipids of untreated hypertensive patients and determine if the lipid ratios were superior in identifying dyslipidemia compared to the use of conventional lipid parameters. METHODS: Hypertensive subjects were consecutively enrolled from our cardiac clinic and had fasting lipid profile measured using standard procedures. The following atherogenic indices were then calculated from the lipid profile: Castelli Risk Index-I (total cholesterol/high-density lipoprotein), Castelli Risk Index-II (low-density lipoprotein/high-density lipoprotein), and the atherogenic index of plasma (AIP) [Log Triglyceride/HDL]. Descriptive statistics and correlation studies were used to determine the relationship between lipid parameters, atherogenic indices and gender. The area under the curve (AUC) of the receiver operator curve (ROC) and the 95% confidence intervals (CIs) were used to determine which index showed the highest accuracy in screening for dyslipidemia in the studied population. RESULTS: Two hundred and forty-eight subjects (108 males and 140 females) aged 20 to 86 years were recruited, mean age was 55.94 ±15.29 and 53.46±13.99 years for males and females respectively (p=0.186). Mean total cholesterol (TCH) and low-density lipoprotein (LDL-C) levels were significantly higher in the females (p=0.005 and p=0.021) respectively. Mean high-density lipoprotein (HDL-C) levels were higher in the females (p=0.003). 10.3% of patients had increased TCH 2.1% had elevated triglyceride, 37.3% had reduced HDL-C and 30.3% had elevated LDL-Cholesterol. AIP showed a strong inverse correlation with HDL-C (r= -0.447, p<0.001), LDL-C (r= -0.130, p=0.045), and TCH (r=-0.209, p=0.001). CRI-I showed an inverse correlation with HDL-C (r= -0.404, p<0.0001) and a positive correlation with TCH and LDL-C (r=0.146, p=0.02) and (r=0.128, p=0.04) respectively. CRI-II showed a strong inverse correlation with HDL-C (r=-0.406, p<0.0001) and a weak positive correlation with LDL (r=0.284, p<0.0001). Using the Receiver Operating Curve (ROC), the CRI-II most sensitive in identifying the hypertensive individuals with dyslipidemia (AUC= 0.882). CONCLUSIONS: Disorders of lipid is common amongst untreated hypertensive patients in Port Harcourt and CRI –II is most sensitive for identifying dyslipidemia in the population studied.
Keywords: Hypertension, Atherogenic indices, Dyslipidemia, Port Harcourt
Cite this paper: Akpa Maclean Romokere, Unamba Ndubuisi Norbert, A Comparison of Atherogenic Indices among Untreated Hypertensives in a Tertiary Hospital in Southern Nigeria, American Journal of Medicine and Medical Sciences, Vol. 7 No. 1, 2017, pp. 363-368. doi: 10.5923/j.ajmms.20170711.01.
1. Introduction
- Cardiovascular disease is the leading cause of death globally and appears to have overtaken infectious diseases as a leading cause of death in developing countries [1]. Hypertension is the number one cardiovascular disease risk factor in addition to others such as dyslipidemia, obesity, tobacco, diabetes. In addition the risk of cardiovascular disease is increased several folds when several risk factors are clustered in the individual patient. Dyslipidemia is the strongest risk factor for atherosclerotic vascular disease after age [2] which underlies all cardiovascular disease. Thus, hypertension and dyslipidemia must be seen as the most potent risk factor for cardiovascular diseases. Adequate management for hypertension must include identification and treatment of all other known risk factors for cardiovascular disease. The identification of hypertension is easy but the determination of what level of dyslipidemia to treat may not be very easy. Dyslipidemia is the strongest risk factor for myocardial infarction in addition to others such as hypertension, diabetes and tobacco. Thus a proper assessment of dyslipidemia in hypertensive patients is appropriate. Plasma lipids have both pro-atherogenic components (triglyceride and LDL cholesterol) and anti-atherogenic components, HDL cholesterol [3]. While guidelines have recommended threshold values for treatment of dyslipidemia [4] in developed countries with high prevalence of coronary artery disease, the determination of absolute levels of lipid that require treatment in resource limited setting with a low prevalence of coronary disease may be challenging. Studies have also shown that the risks of cardiovascular disease events attributable to dyslipidemia are better assessed using different ratios of the different components of the plasma lipid profile [5, 6]. The Castelli Risk Index I (CRI – I) assesses the ratio of total cholesterol to high density lipoprotein cholesterol ( TCH/HDL-C) and sets healthy value at 3.5 or less [7], Castelli Risk Index II assesses the ratio of Low density lipoprotein cholesterol LDL -C to High Density Lipoprotein cholesterol –C (LDL –C/HDL –C) [8] while atherogenic index of plasma (AIP) is the logarithm of molar ratio of triglyceridemia to high-density lipoprotein cholesterol (Log10TG/HDL-cholesterol) and is said to reflect the true relationship between protective and atherogenic lipoprotein and as well as being associated with the size of pre- and anti- atherogenic lipoprotein particle [9-11].We reviewed the lipid profile of treatment naive hypertensive patients seen in the cardiology clinic of UPTH over a one year period July 2013 to June 2014 and calculated various indices of atherogenicity with a view to determining the degree of dyslipidemia and which of the parameters best reflects the degree of dyslipidemia in our hypertensive population. The aim of the analysis was to determine the prevalence of dyslipidemia among newly diagnosed and treatment naive hypertensive patients, the sensitivity of various measures of dyslipidemia and which best identify the risk of cardiovascular disease.
2. Methods
- The study population consisted of all the hypertensive patients referred to the cardiology clinic of the University of Port Harcourt Teaching Hospital over a two year period from July 2013 to June 2015. All the patients were treatment naïve and referred to the clinic for proper evaluation and treatment.All patients had routine biodata collected, clinical evaluation and routine cardiovascular risk assessment including renal function, full lipid profile, 12-lead electrocardiogram and echocardiogram. All the data were entered into the clinic data base. Fasting cholesterol and triglyceride levels were measured using the enzymatic method with a reagent from Atlas Medical Laboratories. Fasting HDL was measured with the precipitation method. LDL cholesterol values were calculated using the Friedewald equation when the triglyceride level was less than 4.0mmol/l: LDL = TC – (HDL + TG /2.2) [12].Definition of abnormal lipid profile [13]:• Elevated triglyceride= TG >1.7 mmol/l.• Hypercholesterolemia= TC >5.2 mmol/l.• Low high density lipoprotein cholesterol= HDL-C <1.03mmol/l • Elevated low density lipoprotein cholesterol = LDL-C >3.0mmol/l. We extracted the relevant data and lipid profile for this report. The lipid profile results were used to calculate three atherogenic index of plasma (AIP), the Castelli Risk Index I (CRI-I) and Castelli Risk Index II (CRI –II). The Atherogenic ratios were calculated as follows: Atherogenic Index of Plasma (AIP) = log TG/HDL-C; Castelli Risk Index (CRI-I) = TC/HDL-C; Castelli Risk Index (CRI-II) = LDL-C/HDL-C. According to previous studies, AIP was further classified into three groups: low (<0.11) risk, intermediate (0.11–0.21), and increased (>0.21) risk [14, 15]. Descriptive statistics and correlation studies were used to determine the relationship between these atherogenic indices and were then compared across gender and the general population. Finally, the screening ability of various atherogenic indices to identify individuals with dyslipidemia among the hypertensives was explored using receiver operating characteristic curve (ROC) analysis. The area under the curve (AUC) of the ROC which have a high discriminating power were used to determine the highest accuracy in screening for dyslipidemia in this hypertensive population. The AUC of 0.5, 0.6≤AUC < 7, 7≤AUC < 0.8, 0.8≤AUC < 0.9, and ≥0.9 corresponded to no discrimination, poor, acceptable, excellent, and outstanding discrimination, respectively [16]. All analyses were performed by SPSS statistical software (version 19.0, SPSS Inc). P values of <0.05 were considered statistically significant.
3. Results
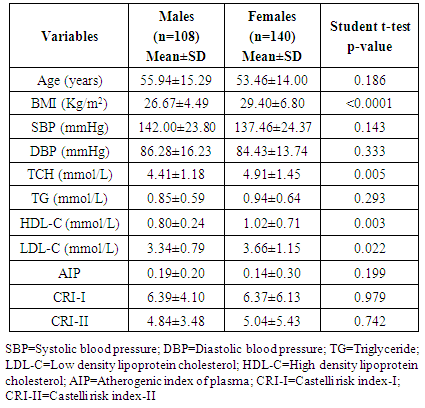
- Two hundred and forty-eight untreated (248) hypertensive patients (108 males and 140 females) aged 20 to 86 years were consecutively enrolled in the register over a two years period. The mean (±SD) age of the patients in the study population was 55.94 ±15.29 years for the males and 53.46±13.99 years for the females (p=0.186). The mean systolic blood pressure was 142.0 ±23.8mmHg for males and 137.46± 24.37mmHg for females while mean diastolic blood pressure was 86.28 ± 16.23mmHg for males and 84.43± 13.74mmHg for females (See Table 1). The mean body mass index (BMI) was 26.67±4.49 Kg/m2 for the males and the mean BMI was 29.40±6.80 Kg/m2 for the females (p<0.0001). About 27.1% of all the subjects had normal BMI, 27.1% were overweight, and 45.7% were obese.The mean total cholesterol (TCH) was 4.69±1.36mmol/L, mean low-density lipoprotein cholesterol (LDL-C) was 3.52±1.09mmol/L, mean high density lipoprotein cholesterol (HDL –C) was 0.92±0.56mmol/L and mean triglycerides (TG) was 0.90±0.62mmol/L. The mean TCH and LDL-C levels were significantly higher in the females than in the males (p=0.005 and p=0.022) respectively. The mean HDL-C levels were higher in the females (p=0.003) (See Table 1). The mean AIP, CRI-I and mean CRI-II were comparable between sexes (p=0.199, p=0.979, and p=0.742 respectively).
|
|
|
|
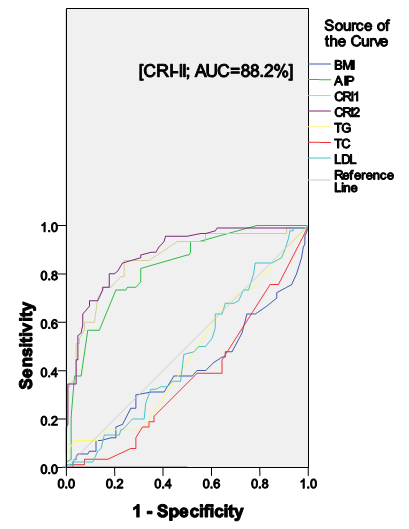 | Figure 1. ROC Curve for Dyslipidemia in Hypertensives subjects |
4. Discussion
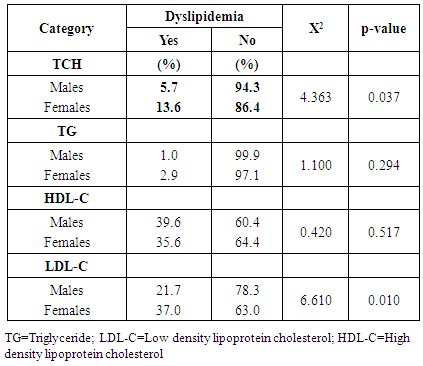
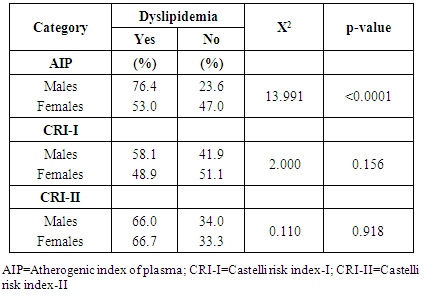
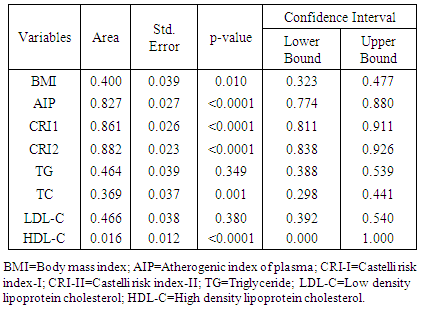
- Lipid profile refers to some routinely done biochemical tests to assess the atherogenic status of individuals at risk of cardiovascular disease (CVD). It includes serum triglycerides (TG), serum total cholesterol (TCH) and its sub fractions like HDL-C and LDL-C. Various studies have established the role of deranged lipid profile in the progression of CVD and deranged LDL-C levels are the primary target for treatment [13]. Calculating certain ratios using these parameters may increase the identification of at-risk individuals. Hence, this study aimed at evaluating the role and contribution of the ratios like AIP, CRI-I, and CRI-II in identifying dyslipidemia in drug-naïve newly-diagnosed hypertensive individuals.The results of this study revealed that dyslipidemia was high in our hypertensive population. Reduced HDL-C levels were the most common form of dyslipidemia (37.3%). This is consistent with the findings by Akintunde et al [17] and Ojji et al [18], but in contrast to Ajayi et al [19] where elevated LDL-C was the most common lipid abnormality. This disparity in findings may be explained by the difference in the study populations. We also found that hypertriglyceridemia was the least prevalent dyslipidemic pattern. This study also revealed that hypercholesterolemia and elevated LDL-C levels were more common among the female hypertensives (See Table 2). This was consistent with the findings by Russo et al [20]. This sex-related difference in the level of LDL-C and TCH could be due to the fact that the female population had significantly more total body fat than their male counterparts (See Table 1). This alone could be responsible for the changes in lipid homeostasis because increased whole-body adiposity and central fat accumulation and decreased insulin sensitivity are associated with increased plasma TG and LDL-C concentrations [21] which were all evident in the female population in this study.In this study, dyslipidemia as assessed by AIP was 63.3%, when assessed by CRI-I was 52.4% and when assessed by CRI-II was 66.4%. These values were greater than those reported by Ajayi et al [19] in South-western Nigeria. The importance of this finding hinges on the fact that lipid ratios have been found to indicate atherogenic risk and are said to be better predictors of coronary artery disease than lipids alone [22] because they these lipid parameters have a combination of pro-atherogenic and anti-atherogenic lipids and lipoproteins. We also found that although the mean values of AIP was comparable across gender, AIP was able to discriminate for atherogenicity in the males (p<0.0001). The association between TG and HDL-C reflected by AIP depicts the balance between atherogenic and protective lipoproteins. The clinical implication of sex-related difference in AIP values reported in this study is that because of statistically significant difference in HDL-C levels (See Table 1), the male hypertensive may have a higher predilection to atherosclerotic vascular disease (ASVD). This is in concert with previous studies that had shown that validated difference exists in disease presentation, progress, and outcome between the sexes, even though the mechanism(s) behind this is still unclear [23, 24]. Also, when AIP was used to risk-stratify the subjects by gender, we found that more of the male subjects were classified as high (p=0.038). Also, the AIP is known to have a positive correlation with the HDL esterification rate and an inverse correlation with LDL size [25]. This finding was also reported in this study, with AIP showing inverse correlations with LDL-C, HDL-C, and TCH. AIP is therefore able to define abnormal levels of HDL-C, LDL-C and TCH which also includes TG and may therefore be considered as mirroring the derangement of spectrum of lipids. The CRI-I and CRI-II appear to be comparable in significance in a gender-related sense (See Table 3). The role played by LDL-C in atherogenicity is well-documented. CRI-I and CRI-II are lipid ratios in which LDL-C plays a central role. So it was not surprising that CRI-I and CRI-II showed positive correlations with LDL-C (P=0.02 and p<0.0001), while showing inverse associations with HDL-C. The CRI-I appears to be as useful as CRI-II. Their similarity can be explained by the fact that approximately two-thirds of plasma cholesterol is found in LDL and, consequently, total and LDL-C are closely related [26]. It has been reported that individuals with high CRI-I or CRI-II have a greater cardiovascular risk owing to the imbalance between the cholesterol carried by atherogenic and protective lipoproteins. This may be due to an increase in the atherogenic component contained in the numerator, a decrease in the anti-atherosclerotic trait of the denominator, or both [27]. The evidence derived from the Framingham study [28] suggests that the TCH/HDL-C ratio is a more powerful coronary risk predictor than independently-used TCH and HDL-C. We also found that when the individual lipid parameters were compared with the lipid ratios to determine their degree of discrimination for atherogenicity in the entire population, the CRI-II had the highest AUC value (AUC=0.882), followed by CRI-I, AIP, LDL-C, TG, TCH, BMI, and HDL-C (See Table 4 and Figure 1). We also found that when also compared to the other atherogenic indices, CRI-II had the highest AUC in males (AUC=0.884) and females (AUC=0.881). This finding highlights the excellent discriminating ability of CRI-II in identifying dyslipidemia in newly-diagnosed, drug-naïve hypertensives.
5. Conclusions
- In this present study, the ROC curve analysis revealed significant AUC for the lipid ratios of TCH/HDL-C, LDL-/HDL-C and AIP. These lipid ratios were found to have high sensitivity and specificity for atherogenicity compared to absolute lipid values. Hence, the lipid ratios, especially CRI-II could be applied as a marker for dyslipidemia even in the presence of insignificant changes in the individual lipid parameters in hypertensives in the Nigerian environment.