-
Paper Information
- Next Paper
- Previous Paper
- Paper Submission
-
Journal Information
- About This Journal
- Editorial Board
- Current Issue
- Archive
- Author Guidelines
- Contact Us
American Journal of Medicine and Medical Sciences
p-ISSN: 2165-901X e-ISSN: 2165-9036
2017; 7(8): 313-317
doi:10.5923/j.ajmms.20170708.02

Effects of Folic Acid and Magnesium Co-Administration on Some Haematological Parameters in Streptozotocin – Induced Type I Diabetic Wistar Rats
 Abstract
 Reference
 Full-Text PDF
 Full-text HTML
Goji A. D. T.1, Mohammed A.2, Tanko Y.2, Kawu M. U.3, Isah A. D.4
1¹Department of Human Physiology, College of Medicine Kaduna State University, Kaduna, Nigeria
2Department of Human Physiology, Ahmadu Bello University, Zaria, Nigeria
3Department of Veterinary Physiology, Ahmadu Bello University, Zaria, Nigeria
4Department of Obstetrics and Gynaecology University of Abuja Teaching Hospital, Nigeria
Correspondence to: Goji A. D. T., ¹Department of Human Physiology, College of Medicine Kaduna State University, Kaduna, Nigeria.
| Email: |  |
Copyright © 2017 Scientific & Academic Publishing. All Rights Reserved.
This work is licensed under the Creative Commons Attribution International License (CC BY).
http://creativecommons.org/licenses/by/4.0/

Background: Diabetes mellitus (DM) is a global public health problem with increasing prevalence. It is a chronic disorder characterized by hyperglycemia and the late development of vascular and neuropathic complications. This work was designed to study the effects of folic acid and magnesium co- administration on some haematological parameters in STZ induced diabetic rats. Methodology: Healthy albino rats weighing between 150g and 200g were used. The rats were randomly allotted into six groups, each containing five albino rats respectively. Five of the groups (II, III IV V and VI) were induced with diabetes by single intraperitoneal (i.p) injection of freshly prepared in 0.1 mol/L citrate buffered solution (pH 4.5) of streptozotocin (Sigma Aldrich, St. Louis, MO, USA) at a dose of 60 mg/kg body weight. Control (vehicle) rats were injected with equal volume of 0.1 mol/L citrate buffer. Four days after STZ injection, diabetes induction was confirmed by measuring fasting blood glucose level in a tail vein blood samples using ACCU-CHEK compact plus glucometer (Roche, France). Rats with glucose level of 200 mg/dl or higher were considered as diabetic. After the induction of diabetes the rats were treated using the FA and Mg separately and in combination respectively according to group daily, whereas, the other group (I) was not given any treatment and this served as the normal control, providing a baseline data. Results: The results indicated that oral supplementation of folic acid (20 mg/kg b.w. /day) and MgCl2 (500/kg b.w. /day) separately or in combination for 4 weeks of treatment exhibited significant alterations in the haematological parameters in STZ-induced-type-1 diabetic; the diabetic rats showed marked reduction in packed cell volume (PCV), haemoglobin (Hb) content, red blood cell (RBC) count, mean corpuscular haemoglobin concentration (MCHC), mean corpuscular haemoglobin (MCH), mean corpuscular volume (MCV) and an increase in the platelet count. Conclusion: These anomalies were all ameliorated to about normal values after four weeks of treatment with FA+Mg. This suggests the synergistic beneficial effects of folic acid and Magnesium against STZ-induced diabetes in Wistar Rats.
Keywords: Diabetes, Hypoglycemia, Folic acid, Magnesium, Wistar Rats
Cite this paper: Goji A. D. T., Mohammed A., Tanko Y., Kawu M. U., Isah A. D., Effects of Folic Acid and Magnesium Co-Administration on Some Haematological Parameters in Streptozotocin – Induced Type I Diabetic Wistar Rats, American Journal of Medicine and Medical Sciences, Vol. 7 No. 8, 2017, pp. 313-317. doi: 10.5923/j.ajmms.20170708.02.
Article Outline
1. Introduction
- Diabetes mellitus, is a syndrome characterized by disordered metabolism and inappropriate hyperglycaemia (high blood sugar) resulting either from low levels of insulin secretion or to a combination of resistance to insulin's effects and inadequate insulin secretion to compensate for insulin resistance [1]. The effects of DM include long-term damage, dysfunction and failure of various organs [2]. Diabetes mellitus may present with characteristic symptoms such as thirst, polyuria, blurring of vision, and weight loss and in its severe forms, keto-acidosis or a non-ketotic hyperosmolar state may develop and lead to stupor, coma and in absence of effective treatment, death [3]. The free radical scavenging properties and possible antioxidant activity of folic acid are reported [4]. [5] assessed the effect of FA treatment on T1DM by analyzing the gene expression profile of Endothelial progenitor cells (EPCs) from T1DM patients treated with FA and comparing it to that from healthy controls, and showed that FA normalized a majority of changes in gene expression induced by T1DM (99.6%), suggesting the therapeutic potential of FA in the treatment of T1DM. Magnesium plays an essential physiological role in many functions of the body [6]. It is a cofactor for DNA and protein synthesis, oxidative phosphorylation, many enzymes, and for more than 300 different metabolic reactions including glycolysis, Krebs cycle, β-oxidation or ion transport across cell membranes [7]. Magnesium stabilizes cell membranes; it also antagonizes calcium and functions as a signal transducer [8]. The aim of this study therefore is to investigate the effect of the co-administration of folic acid and Magnesium on some haematogical parameters in streptozotocin induced type 1 diabetic rats.
2. Materials and Methods
- Streptozotocin (Sigma Aldrich Inc.st Louis, MO, USA), Folic acid (Sigma), Magnesium, (Sigma Aldrich Inc.st Louis, MO, USA), Glucose. All other chemicals and drugs were obtained commercially and were of analytical grade.Experimental AnimalsThirty Wistar male rats weighing between 200 to 250g (aged six to eight weeks) were obtained and housed in the animal house unit of the Department of Human Physiology, Ahmadu Bello University, Zaria. The normal standard rat chow and tap water were provided ad libitum during the experiment. Animals were stabilized to acclimatize to animal house environment for one week before commencement of the experiment. The study protocol was approved by the Institutional Animal Ethnic Committee of the University, Ahmadu Bello University, Zaria.MethodologyInduction of Diabetes MellitusDiabetes was chemically induced by intraperitoneal (i.p) injection of freshly prepared in 0.1 mol/L citrate buffered solution (pH 4.5) of streptozotocin (Sigma Aldrich, St. Louis, MO, USA) at a dose of 60 mg/kg body weight. Control (vehicle) rats were injected with equal volume of 0.1 mol/L citrate buffer. Four days after STZ injection, diabetes induction was confirmed by measuring fasting blood glucose level in a tail vein blood samples using ACCU-CHEK compact plus glucometer (Roche, France). Rats with glucose level of 200 mg/dl or higher were considered as diabetic [9]. Glucose levels of diabetic rats were checked before starting of treatment, so that animals could be homogenously and randomly distributed between the groups.Experimental DesignApparently normal healthy rats were used as normal control and diabetic-induced rats and were randomly alloted into six groups (n=5):GROUP 1- Normal untrated were given normal saline 1 ml/kg daily orally for 4 weeks GROUP 2- Diabetic untreated were given Normal saline 1ml/kg daily orally for 4 weeks.GROUP 3- Diabetic were treated with magnesium 500 mg/kg daily orally for 4 weeks [10].GROUP 4- Diabetic were treated with folic acid 20 mg/kg daily orally 4 weeks (2).GROUP 5- Diabetic were treated with magnesium 500 mg/kg + folic 20 mg/kg acid daily orally for 4 weeks.GROUP 6- Diabetic were treated with Insulin 6 U.I/kg i.p. daily orally for 4 weeks. [11]Blood CollectionAt the end of the experimental period of four weeks, overnight fasted animals were anaesthesized by halothane About 5 mL of blood was aseptically collected by cardiac puncture from each rat using a 5 mL syringe. The blood sample was placed in a bottle containing ethylenediaminetetraacetic acid (EDTA) for haematological analysis.Determination of Haematological ParametersErythrocyte was evaluated using a haemocytometer as described by Dacie and Lewis, 1991. The packed cell volume was estimated by the microhaematocrit method as described by [12], while (Hb) concentration was evaluated using the cyanmethaemoglobin method [13].Determination of total red blood cell countTotal red blood cell counts were determinmed by haemocytometer method as described by [14]. The tip of a clean and dry RBC pipette was placed at the edge of a drop of blood. Blood was then drawn to the mark 0.5; sucked Hayem’s fluid to the mark 101, and the mixture mixed thoroughly for 3-4 minutes. After the blood has been well mixed with the diluents, the tip of the pipette was carefully wiped and quickly placed on the floor piece, its tip just touching the edge of the cover slip at an angle 30◦ to the horizontal. The diluted blood was allowed to flow by capillarity action evenly and slowly under the cover slip. The cells were allowed to settle down for 2-3 minutes and the chamber carefully placed on the microscope. The cells were then counted under the desire magnification.Determination of packed cell volume Non-EDTA acid capillary tubes were filled with the blood collected in bottles containing anticoagulant from the Wistar rats. About 15 mm of the capillary tubes were left unfilled and the open end of each of the tubes was carefully sealed with flame from a microburner. The tubes were then loaded into a microhaematocrit centrifuge (Hawksley, England) and centrifuged at 1000 x g for 10 minutes. A haematocrit reader (Hawksley, England) was used to read the PCV value of each tube [12].Determination of haemoglobin concentrationThe haemoglobin (Hb) concentration was determined using cyamethaemoglobin method of (12). Blood sample (20 µL) was pipetted into a tube and diluted with 5 mL of Drabkin’s fluid and was allowed to stand for 3 minutes and the absorbance of the mixture read using a spectrophotometer (Beckman Coulter®, Model BU20, Australia) at a wavelength of 540 nm against the reagent blank. The haemoglobin concentration was calculated using the formula:Hb = T x C x D (g/dL)/A x 1000Where:T = AbsorbanceA = Standard absorbanceC = The concentration of cyanomethaemoglobinD = Dilution factor (1: 250)1000 converts the Hb concentration from mg/dl to g/ dL.Platelet CountPlatelet (PLT) count was done using the haemocytometry method and the improved Neubauer’s counting chamber [15]. Whole blood was diluted with a 1% ammonium oxalate solution. The isotonic balance of the diluent is such that all erythrocytes were lysed while the leucocytes, platelets, and reticulocytes remained intact. The standard dilution for platelet counts is 1:100. This dilution was prepared using the leucocyte/platelet Unopette system. The dilution was mixed well and incubated to permit lysis of the erythrocytes. Following the incubation period, the dilution was mounted on a haemacytometer. The cells were allowed to settle and then counted in a specific area of the haemacytometer chamber under the microscope. The number of platelets was calculated per µL (x 109/L) of blood.Statistical AnalysisAll data were expressed as Mean. SEM and data were entered and analyzed using statistical package SPSS (version 20) followed by one way analysis of variance (ANOVA) with multiple comparisons. The Tukey’s post-hoc test was used to determine difference between groups. Values of p<0.05 was considered as statistically significant [16].
3. Results
- Effects of Treatment on Haematological ParametersErythrocyte count (x1012/L)There were significant increases (P < 0.05) in the red blood cell counts in the FA, Mg and FA+Mg groups compared to that in the diabetic control (Table 1). In the diabetic treated group, erythrocyte counts increased significantly from 5.26 ± 0.31 to 6.58 ± 0.16 in FA + Mg treated group However, in the groups that had FA, Mg and FA+Mg, RBC counts were significantly higher as compared to DB +DW group (6.78 ± 0.19, and 6.40 ± 0.19, 6.58 ± 0.13 vs 5.26 ± 0.31, respectively; P < 0.05).Haemoglobin ConcentrationThe Hb (g/dl) concentration obtained in normal and diabetic controls were 15.48 ± 0.27 and 9.74 ± 0.24 (P < 0.05) (Table 1). In the diabetic treated group, a significant improvement (P < 0.05) was recorded in the Hb concentration in the FA + Mg group (12.48 ± 0.35) compared to that of diabetic control group. Similarly, there were significant increases in the Hb concentration in the group 3 (DB+FA) and group 4 (DB+Mg) rats (11.88 ± 0.32 and Mg alone 12.18 ± 0.28l, respectively P < 0.05).Packed Cell VoumeTable 1 demonstrated that the decrease in PCV level in STZ-induced diabetic rats was appreciably counteracted by folic acid and magnesium when administered conjointly. The study reveals that the PCV was significantly (P < 0.05) increasesd to 42.6% following treatments. Folic acid alone restored the level of PCV to 36.46 % whereas magnesium restores PCV level to 35.02 ± 0.40%.Effect of Treatments on Erythrocyte IndicesThere were no significant differences (P > 0.05) in the MCV, MCH and MCHC between groups. (Table 1) Platelet CountThe platelet counts (x109/L) were significantly lower in normal control than in diabetic control rats (617.20 ± 29.17 vs 815.40 ± 32.6, P < 0.05) (Table 1). In the treated groups, a significant (P < 0.05) decrease was recorded in the platelet count in the FA+ Mg group (669.40 ± 75.90) compared to that of diabetic control group (815.40 ± 32.63). However, there were decreases in the platelet counts in the group administered FA alone (768.60 ± 41.06) and Mg alone (721.00 ± 58.07), but the difference were not significant, when compared to the diabetic control (Table 1).
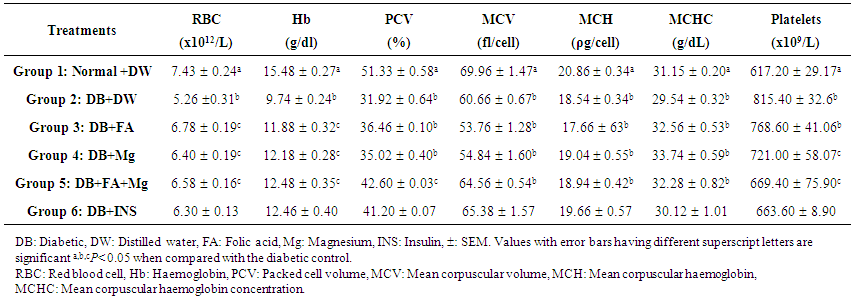 | Table 1. Effects of Co-administration of Folic Acid and/or Magnesium on some Haematological Parameters in Streptozotocin-Induced Diabetic Wistar Rats |
4. Discussion
- In the result obtained, there were significant (P < 0.05) reduction in the RBC, PCV, and Hb, in the diabetic control when compared with the normal control group. The result agrees with the finding that anaemia is a common pathophysiology, associated with diabetes mellitus [17]. In contrast, FA and Mg co-administration significantly (P < 0.05) attenuated the anemic response engendered by STZ, when compared with the diabetic control group. The effect of the treatment was observed to be more effective in the combination than the two other groups that were administered folic acid and magnesium alone. This may be partly due to its ability to improve the erythrocyte membrane integrity by the mitigation of oxidative damage to the erythrocytes membranes. Besides, the co-administration of FA and Mg may suppresse hemolysis through osmoregulation and biomembrane stabilization [18]. It may be hypothesized that FA and Mg co-administration improved the erythrocytic indices through these mechanisms. The link between chronic diseases and anaemia is well characterized [19]. The occurrence of anaemia in DM has been reported due to the increased non-enzymatic glycosylation of RBC membrane proteins, which correlates with hyperglycaemia [20]. Anaemia is associated with an increased risk of diabetic complications, including nephropathy, retinopathy and macrovascular disease. Similarly, a previous study observed that the mean values of TRBC, Hb, PCV and MCHC for the diabetic patients are lower than those of the control group, indicating the presence of anaemia in the former group [21]. Anaemia has been shown to be a risk factor for cardiovascular disease in diabetic patients, particularly those with chronic kidney disorder. There is advocacy to monitor and manage the development of anaemia in patients with type-1 DM may predate an abnormality in renal function. Anaemia may also be significant in determining the outcome of heart failure and hypoxia-induced organ damage in diabetes. While several factors contribute to the increased prevalence of anaemia in diabetes, the failure of the kidney to increase erythropoietin in response to falling haemoglobin appears to be the dominant factor. Oxidation of these proteins and hyperglycaemia in diabetes mellitus causes an increase in the production of lipid peroxides that lead to haemolysis of RBC [22]. The major pathological consequences of free-radical induced membrane lipid peroxidation include increased membrane rigidity, decreased cellular deformability, reduced erythrocyte survival, and lipid fluidity [23]. The decrease in MCH and MCHC values, observed after administration of STZ, is an indication of abnormal haemoglobin synthesis, failure of blood osmoregulation, and plasma osmolarity [24].
5. Conclusions
- The results of the present day study indicated that type 1 diabetes evoked detrimented effects on the physiological profiles in Wistar rats. It is posited that FA+Mg appreciably mitigated the changes induced by STZ- induced type 1 diabetes partially through their synergistic protective effects in attenuating almost all of the parameters induced by oxidative stress in STZ-induced treated rats. Therefore, FA and Mg combination may be useful in improving the physiological profiles against the detrimental effects posed by type 1 diabetes.
ACKNOWLEDGEMENTS
- The authors wish to thank Mallam Ya’u Bello casual staff of the Department of Human Physiology, ABU, Zaria for the care of the experimental animals throughout the period of this research work.