Uduma Eke Osonwa1, Stephen Olaribigbe Majekodunmi2, Emeka Osegbo1, Aniefiok Udobre3
1Department of Pharmaceutics and Pharmaceutical Technology, Faculty of Pharmaceutical Sciences, Nnamdi Azikiwe University, Awka, Nigeria
2Department of Pharmaceutics and Pharmaceutical Technology, Faculty of Pharmacy, University of Uyo, Uyo, Nigeria
3Department of Pharmaceutical and Medicinal Chemistry, Faculty of Pharmacy, University of Uyo, Uyo, Nigeria
Correspondence to: Stephen Olaribigbe Majekodunmi, Department of Pharmaceutics and Pharmaceutical Technology, Faculty of Pharmacy, University of Uyo, Uyo, Nigeria.
| Email: |  |
Copyright © 2017 Scientific & Academic Publishing. All Rights Reserved.
This work is licensed under the Creative Commons Attribution International License (CC BY).
http://creativecommons.org/licenses/by/4.0/

Abstract
Antimalarial drug resistance has emerged as one of the greatest challenges facing malarial control. The aim of this investigation is to enhance the antimalarial effect of mefloquine (MQ) by combining it with chlorpheniramine (CPM) using Plasmodium berghei-infected wistar rat model. P. berghei parasites (106) were administered intraperitoneally into albino rats weighing 118-208g. 20% parasitaemia was taken and treatment commenced after day 4. The haematological, biochemical and pharmacokinetic investigations of malarial infected rats were carried out followed by the histopathological changes in the liver. The albino rats (35) were randomized into 7 groups of 5 animals each. Treatment of infected rats with drug combination was as follows: Group 1: neither infected nor treated; group II: mefloquine alone at dose 1250mg/70kg man weight; group III: chlorpheniramine alone at dose 4mg/70kg man weight; group IV: mefloquine at dose 1250mg/70kg man and chlorpheniramine (4mg/70kg man) together; group V: chlorpheniramine (4mg/70kg man) followed by mefloquine (1250mg/70kg man) 30 mins after; group VI: mefloquine followed by chlorpheniramine 30 mins after; group V11: infected and untreated serving as control. The baseline parasitaemia before treatment were 37.6%, 32.4%, 32.4%, 34.6%, 38.4% and 51.2% for MQ alone, CPM alone, MQ + CPM, CPM + MQ 30, MQ + CPM 30 and Negative control respectively. Administration of the various drug combinations resulted in significant (p > 0.05) percent parasite reductions of 7.4%, 26.5%, 89.2%, 22%, 76% and -104% on day 1, and 86.2%, 71.6%, 92.8%, 59.5%, 82.8% and -140.6% on day 3 respectively. The ranking of the percent parasite reductions on day 3 was MQ + CPM > CPM alone > MQ + CPM 30 > MQ alone > CPM + MQ 30. The RBC count, haemoglobin and PCV showed no significant difference (p > 0.05) in all the groups. ALT showed a significant (p < 0.05) increase in blood of infected and untreated group compared to all the other groups. AST was significant (p < 0.05) in infected and untreated rats compared to all of the other groups. The results showed that chlorpheniramine enhances the antiplasmodial activity of mefloquine and the combination gives an affordable and highly effective antimalarial.
Keywords:
P. falciparum, Drug resistance, Drug combination, Antimalarials, Mefloquine, Chlorpheniramine
Cite this paper: Uduma Eke Osonwa, Stephen Olaribigbe Majekodunmi, Emeka Osegbo, Aniefiok Udobre, Enhancement of Antimalaria Effect of Mefloquine by Chlorpheniramine, American Journal of Medicine and Medical Sciences, Vol. 7 No. 6, 2017, pp. 248-264. doi: 10.5923/j.ajmms.20170706.04.
1. Introduction
Malaria is an acute and chronic mosquito-borne ancient disease of man characterized by chills, fever, anemia, splenomegaly and damage to other organs such as the liver and brain [1]. Young children, pregnant women and non-immune visitors to malarious areas are at greatest risk of severe or fatal illness. According to Centre for Disease Control (CDC), nearly 85% of malaria cases in Africa are caused by P. falciparum, the remaining cases being caused by the other three strains. P. vivax is now the most geographically widespread of the human malaria, occurring in much of Asia, Central and South America, the Middle East, where 70-90% of the malaria burden is of this species and the rest due to P. falciparum [2]. P. Malaria causes sporadic infections in Africa, Parts of India, Western Pacific and South America, whereas P. ovale is restricted to tropical Africa, New Guinea and Philippines [3, 4]. P. knowlesi has been reported in South East Asian countries such as Malaysia, Thailand, Vietnam, Myanmar and philipines [5].Anti-malarial drug resistance has emerged as one of the greatest challenges facing malaria control today leading to malaria morbidity and mortality [5, 6]. Drug resistance has been implicated in the spread of malaria to new areas and re-emergence of malaria in areas where the disease had been eradicated. Drug resistance has also played a significant role in the occurrence and severity of epidemics in some parts of the world. Population movement has introduced resistant parasites to areas previously free of drug resistance. P. falciparum has also developed resistance to nearly all of the other currently available antimalarial drugs such as sulfadoxine/pyrimethamine, mefloquine, halofantrine and quinine. Although resistance to these drugs tends to be much less widespread geographically, in some areas of the world, the impact of multi-drug resistant malaria can be extensive. Most recently, a low-grade resistance to artemisinin-based drugs has emerged in parts of Southeast Asia. Parasite resistance to antimalarials has been documented in three of the five malaria species known to affect humans; P. falciparum, P. vivax and P. malariae [7]. However, most of these drugs still have a place and their life-span could be prolonged if better deployed and used, and also by rationally combining them based on pharmacodynamics and pharmacokinetics properties with other drugs. Pyronaridine, a Chinese drugs was combined with pyrimethamine [8]; artesunate is used in combination with mefloquine or tetracycline in Southeast Asia [9-11]. Chloroquine resistance can be reversed by combining chloroquine with calcium channel blockers, verapamil or chloropromazine [6]. Antihistamine compounds cyproheptadine, ketotifen reversed chloroquine resistance in P. yoelii mice [12, 13]. Mefloquine, a 4-quinolinemethanol derivative (Fig. 1) and 2-aryl substituted chemical structural analog of quinine was invented in 1970 at Walter Reed Army Institute of Research (WRAIR) [14]. Mefloquine was first used to treat chloroquine-resistant P.falciparum malaria in Thailand where it was formulated with pyrimethamine-sulfadoxine (fansimefR) to delay development of drug resistant parasites. This strategy failed largely because slow elimination of mefloquine fostered the selection of resistant parasites at sub-therapeutic drug concentration [15].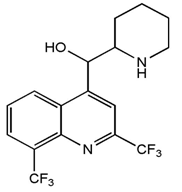 | Figure 1. Chemical Structure of Mefloquine |
Chlorpheniramine maleate (Fig. 2) a synthetic alkylamine derivative and salt of chlorpheniramine is prepared by chlorination of pheniramine in the para position of the phenyl ring. This chlorination at the para position of the phenyl ring increases the potency by almost 10-fold with no appreciable change in toxicity. Most of the antihistamine activity resides with the dextro isomer [16]. Studies show that chlorpheniramine maleate can reverse chloroquine resistant Plasmodium falciparum [17-19]. 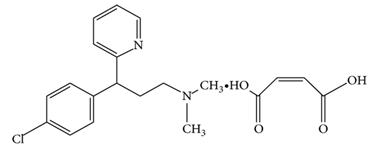 | Figure 2. Chemical Structure of Chlorpheniramine maleate |
Higher dosage of chlorpheniramine enhances the efficacy of chloroquine in treating acute and uncomplicated P. falciparum in children from an endemic area of Nigeria [20]. Data on potentiation of antimalarial effect of mefloquine by chorpheniramine in animals are lacking. Previous work by Nakorchai and Konthiang [21] was on in vitro studies and did not consider in vivo studies like pharmacokinetics of the combination, the effect of the combination on haematological and biochemical parameters as well as the effect on the liver. The present study investigates the ability of chlorpheniramine to enhance or potentiate the therapeutic efficacy of mefloquine in vivo against P. berghei malaria in rat by assessing the percentage reduction in parasitaemia; changes in haematological and biochemical parameter; determination of histopathological changes in the liver; pharmacokinetic studies of mefloquine/chlorpheniramine combination in rat.
2. Materials and Methods
2.1. Materials
2.1.1. Drugs Used
Mefloquine hydrochloride tablets (Occulus Pharma Nigeria) and chorpheniramine maleate tablets (Evans Medicals Nigeria). Tablets were dissolved in water for injection and concentration made to 7.49mg/ml for mefloquine and 0.024mg/ml for chlorpheniramine.
2.1.2. Animals
In-breed male and female (non-pregnant) albino rats weighing between 118g and 208g (mean weight 169.63) were obtained from the animal house of the Department of Veterinary Medicine, University of Nigeria Nsukka. The animals were observed under 12hours light/dark cycles in metabolic cages in a well ventilated rodent cubicle. They were fed on a rat pellet diet (Ladokun Farms, Nigeria) with water ad libitum. The use of animals in this study was in accordance with the guidelines approved by the Animal Ethical Committee, Nnamdi Azikiwe University Awka. The animals were acclimatized for 7 days prior to their randomization into various experimental groups.
2.1.3. Parasite
The P. berghei parasites used in this study was obtained from the Department of Pharmaceutics, University of Nigeria Nsukka. It was maintained by serial passage in mice which served as donor mice in this study.
2.1.4. Chemicals and Reagents
Alanine aminotransferase and Aspartate aminotransferase (Randox Laboratory, UK), Chloroform (Sigma Aldrich, USA), Drabkin’s solution (Organo Biotech Laboratories, India), EDTA (Fushun Shunnum Chemical, China), Paraffin wax (Green Mountain, China), Xylene (Shiyan Industries, India), Haematoxylin (Abbey Colour, Philadelphia), RBC diluting fluid (Organo Biotech Laboratories, India), WBC diluting fluid (Alpha Chemicals, India), Formal saline (Vet Way Industries, UK), Phosphate buffer (Vet Way Industries, UK). HPLC Grade Acetonitrile (Sigma – Aldrich Germany), HPLC grade Methanol (Sigma- Aldrich Germany), HPLC grade formic acid (Sigma -Aldrich Germany), HPLC grade water (double distilled water), mefloquine HCL USP analytical grade (Sigma-AldrichGermany), chlorpheniramine maleate USP analytical grade (Sigma –Aldrich Germany).All other reagents are of analytical grade.
2.2. Methods
2.2.1. Determination of Parasite Density and Inoculum Preparation
A standard inoculum was prepared from a donor rat with P. berghei parasitized erythrocytes. Infected blood from donor rat was obtained by cardiac puncture after anesthesia with chloroform. Each rat was infected with a standard inoculum of the 106 parasitized erythrocyte suspension in phosphate buffered saline (0.2ml) from a donor rat that was prepared based on percentage parasitaemia and number of erythrocytes counted per µL of blood using an improved haemocytometer.
2.2.2. Parasitamia Determination
Blood samples were collected by bleeding via the tail vein of P. berghei infected rat and thin blood smears were made on microscope slides fixed with methanol and stained with 10% Giemsa stain for 30 min and then rinsed with tap water. Parasitaemia was determined by counting the number of PRBC for ten different fields. Parasitaemia was mornitored daily using X100 objective of light microscope. Treatments commenced when about 20% parasitaemia were established in infected rat.Curative treatments in the set of 35 albino rats randomized into 7 groups of 5 animals per group were introduced intra-peritoneally infected with 106 parasitized erythrocyte. Oral treatment commenced on day 4 post infection. Group I (Uninfected and Untreated). Animals in this group were not infected and untreated. Group II (mefloquine alone). Animals in this group were infected with P. berghei and treated on day 4 post infection with mefloqune alone at the dose of 1250 mg/70kg man.Group III (chlorpheniramine alone). Animals in this group were infected with P. beighei and treated on day 4 post infection with chlorpheniramine alone at the dose of 4mg/70kg man. Group IV (mefloquine + chlopheniremine together). Animal in this group were infected with P. berghei and treated on day 4 post infected with mefloquine + chlorpheniremine together at the doses of 1250mg/70kg man and 4mg/70kg man for mefloquine and chorpheniramine respectively. Group V (chlorpheniramine first followed by mefloquine 30mins later).Animals in this group were infected with P. berghei and treated on day 4 post infection with chlorpheniramine given first at the dose of 4mg/70kg man and followed by mefloquine at the dose of 1250mg/70kg man 30 mins after. Group VI (mefloquine first then followed by chlorpheniramine 30mins after) Animals in this group were infected with P. berghei and treated on day 4 post infection with mefloquine given first at the dose of 1250mg/70kg man, then followed by chlorpheniramine at the dose of 4mg/70kg man 30 mins later. Group VII (infected and untreated) Animals in this group were infected and untreated serving as control.
2.2.3. Haematological Parameters
The haematological parameters determined are percentage cell volume (% PCV), haemoglobin, erythrocytes and leukocyte counts.
2.2.4. Determination of Packed Cell Volume (PCV)
PCV is used to measure the amount of cells in the blood; blood is made up of cells and plasma. The amount of cells on the blood is expressed as a percentage of the total volume of blood. Blood sample was collected from the ocular orbit of each mouse with a heparinized capillary tube by capillary action. The tube was sealed with plasticine at one end. The sealed capillary tubes were then arranged on the hematocrit centrifuge and spun at 10,000 rpm for five minutes to separate the blood into plasma and packed cells. The % PCV was read on the hematocrit reader and recorded. The PCV of each rat was measured before infection and on day 4 after infection using the formula: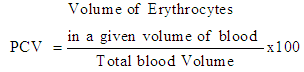
2.2.5. Haemoglobin
Using the micropipette, 20μl of blood was taken and mixed with 4ml of Drabkin solution in a test tube. The blood mixture was allowed to stand for 5mins and then read with a colorimeter at 540nm wavelength. The heamoglobin was recorded.
2.2.6. Determination of Total Leukocyte (White Blood Cell) Count
Total leukocyte is the total number of white blood cell in the blood. This experiment was carried out using a haemocytometer: a device used for counting red blood cells and white blood cells in a sample of blood. The blood was collected from the rat in an EDTA bottle to prevent clotting of the blood. Using the micropipette in the haematocytometer, 20 µL of blood was taken and mixed with 380 µL of Gower solution. Using micropipette, the blood mixture was placed on a haemocytometer slide and viewed on a microscope with magnification of 40X. The White Blood Cell count was noted and recorded.
2.2.7. Determination of Total Erythrocyte (Red Blood Cell) Count
Total erythrocyte count is the total number of red blood cell in the blood. This experiment was carried out using a haemocytometer: a device used for counting red blood cells and white blood cells in the blood. The blood was collected from the rat in an EDTA bottle to prevent clotting of the blood. Using the micropipette, 20 µL of blood was taken and mixed with 4 ml of RBC diluting fluid in a test tube. The blood mixture was allowed for 10 min, and then placed on a haemocytometer slide to be viewed on a microscope with magnification of 40X. The red blood cell count was noted and recorded.
2.2.8. Biochemical Parameters
Blood was collected by cardiac puncture and transferred into plan bottles. It was allowed to clot and centrifuged at 3500 rpm for 10mins and the clear sera collected by aspiration and store at -4oC. The sera were later thawed to room temperature and assayed for biochemical parameters namely: alanine aminotransferase (ALT), aspartate aminotransferase (AST)
2.2.9. Determination of Aspartate Amino Transferases (AST) Activity
The method of Reitman and Frankel [22] was used as outline in Randox kit as follows: 0.lml of serum with 0.5ml of substrate solution (aspartate and 2 – ketoglutarate, in phosphate buffer (PH. 7.4) was incubated at 37°C for 30min. After incubation, 0.5ml of 2, 4, dinitrophenylhydrazine (DNPH) solution was added to arrest the reaction and kept for 20mins at room temperature. To this, 5.0ml of 0.4N sodium hydroxide was added and absorbance was red at 510nm wavelength. Activities were expressed as IU/L.
2.2.10. Determination of Alanine Aminotranferase (ALT) Activity
The activity of alanine aminotransferase was also assayed by the methods of Reitman and Frank [22] as outlined in Randox kits. Serum (0.1mL) with substrate solution (alanine and 2-keto glutarate, in phosphate buffer PH 7.4) (0.5mL) was incubated at 37°C for 30min. After incubation 2, 4 dinitrophenyl hydrazine (DPH) solution (0.5) was added to arrest the reaction and kept for 20min at room temperature. 0.4N sodium hydroxide (5.0mL) was added and absorbance was read at 510nm wavelength. Activities were expressed as IU/L.
2.2.11. Histopathology
Histopathological changes in the liver were assessed at the end of the haematological and biochemical analysis. Tissue sections of the liver from experimental animal were fixed in 0.9% sodium chloride (normal saline) at room temperature for 72h and dehydrated in ascending grades of ethanol. Then after that, the tissue were stored in chloroform overnight, infiltrated and embedded in molten paraffin wax. The blocks were later trimmed and sectioned at 5-6 microns. The sections were de-paraffinized in xylene, then taken to water and subsequently stained with haematoxylin and Eosin (H and E).
2.2.12. Pharmcokinetics Studies Using HPLC
Inbred male and non-pregnant female albino rats (15) of 10 weeks old weighing between 90.2g and 134.1g were grouped as follows: Group A (Mefloquine alone); Group B (Chlorpheniramine alone); Group C (Mefloquine + chlorpheniramine together); Group D (Chlorpheniramine first + mefloquine 30 mins later); Group E (Mefloquine first + chlorpheniramine 30 mins later).
2.2.13. Preparation of the Standard Solution of Mefloquine
Mefloquine reference standard (25mg) was weighed (Weighing balance Sartorius TE-2145) accurately and transferred to 25ml volumetric flask and dissolved with 10ml of the mobile phase (methanol + acetonitrile, 75:25, v/v) and then made up to 25ml with the same mobile phase to get 1mg/ml. This was sonicated for 10mins and then diluted to get six different concentrations. All solutions were freshly prepared.
2.2.14. Construction of the Calibration Graph for Mefloquine
According to USP 2015 specification, the recommended concentration of the standard solution of mefloquine HCL was 0.05mg/ml. Aliquot portions (0.5-5ml) of 1mg/ml mefloquine standard solution was transferred to a series of 25ml measuring flask and completed to volume with the mobile phase (methanol + Acetonitrile, 75:25, v/v). The dilutions gave six different concentrations from 0.02mg/ml to 0.2mg /ml (20μg/ml to 200μg/ml) 10μL of the solution was injected from each flask and the chromatograms recorded, maintaining the flow rate at 1.0ml/min and wavelength at 222nm. The ratio of peak areas were measured corresponding to concentration of each. Calibration graph was constructed representing the relation between concentration and peak area. Concentrations of unknown samples were derived from the calibration graph.
2.2.15. Preparation of Standard Solution for Chlorpheniramine
25mg of Chlorpheniramine maleate reference standard was weighed accurately and transferred to 25ml volumetric flask. This was dissolved with 10ml of the mobile phase (methanol + acetonitrile, 75:25, v/v) and made up to 25ml with the same mobile phase to obtain 1mg/ml. It was then sonicated for 10 minutes.
2.2.16. Construction of the Calibration Graph for Chlorpheniramine
According to USP specification, the concentration of the standard solution is 8µg/ml.To obtain different concentrations of the standard solution, the following dilutions were made:2.5 ml of the standard solution (1.0mg/ml) was taken and enough volume of mobile phase added to make up to 25 ml (0.1mg/ml). Then aliquot portions (0.5ml, 1.0ml, 2.0ml, 3.0ml, 4.0ml, and 5.0 ml) of this solution (0.1mg/ml) were withdrawn and placed in different 25ml measuring flasks. Enough quantity of the mobile phase was added to each of the flasks to make up the volume to 25ml. The dilutions were done to yield six different concentrations ranging from 2µg/ml to 20µg/ml). All the solutions were freshly prepared. Then 10μL of the solution from each flask was injected into the HPLC machine (HPLC System Hitachi, Japan, equipped with auto sampler L-220 with capacity of 200 samples. pump – L- 2130, Oven L. – 2350, UV – Vis detector L2420FL, detector L 2485, Reservoir for mobile phase, micron filter (Biofil syringe filter PTFE Membrance) max pressure 4.5 bars (67.5psi) and pore size 0.45μmC18 column: 4.6nm×10cm; 5µ packing) to obtain the chromatograms. The flow rate is maintained at 1.0ml/min and the UV wavelength at 214nm. The peak areas were measured corresponding to the different concentrations. The data was used to construct a calibration graph depicting the relationship between the concentrations and the peak areas. The concentrations of the test samples were then derived from the calibration graph.
2.3. Pharmacokinetics Studies
The animals were acclimatized under 12 hours light /dark cycles in metabolic cages in a well ventilated rodent cubicle. They were fed on a rat pellet diet (Ladokun Farms, Nigeria) with water al libitum. The use of animals in this study was in accordance with the guidelines approved by the animal ethical committee, Nnamdi Azikiwe University, Awka. The animals were acclimatized for 7days and randomly selected into the various experimental groups. The animals were fasted over night before the administration of the drugs. The drugs were administered to the rats according to their body weights: mefloquine1250mg /70kg man/day) and chlorpheniramine (4mg/70kgman/day). 0.5ml of the blood samples were withdrawn at specific time intervals of 30mins, 1hr, 2hr, 4hrs 6hrs and 8hrs.The blood samples were centrifuged at 3000rpm for 15mins using the auto refrigerated centrifuge (TGL20M China) and the supernatant transferred into a fresh tube and the cells washed with distilled water. Then equal volume of methanol was added to the cells and centrifuged at 15000rpm (TGL20M China) for 10mins and the supernatant transferred into a clean fresh tube.The supernatant was labeled accordingly A and B (A, supernatant from centrifuged whole blood; B, supernatant from washed and centrifuged cells). These were filtered using 0.45micron syringe filters and 10μL injected into the chromotographic system using the auto sampler and eluted by isocratic method using the mobile phase; methanol + acetonitrile mixture (75%v/v: 25%v/v) as organic phase and 0.1% formic as the aqueous phase and the stationary phase is C18 column and flow rate maintained at the rate of 1.0ml/ min. It was detected by UV-Visible at 222nm for mefloquine and 214 nm for chlorpheniramine.
2.4. Statistical Analysis
The results were expressed as mean ± standard deviation (SD). Parameters in the groups were compared by one way (ANOVA) using the computer software statistical package for social sciences (SPSS) version 16.All data were analyzed at a 95% confidence interval and values were considered statistical significance (p< 0.05). The research statistic employed for the comparison of levels of parasite in the various groups was ANOVA at 95% confidence. Multiple comparisons using post hoc Dunnett test (with negative control group as reference) and Turkey test (excluding the negative control) were conducted on the data to ascertain the degree of significance in percent parasite reduction among the various experimental groups.
3. Results
3.1. Antiplasmodial Testing
The results of antiplasmodial testing are shown in Figures 3 and 4.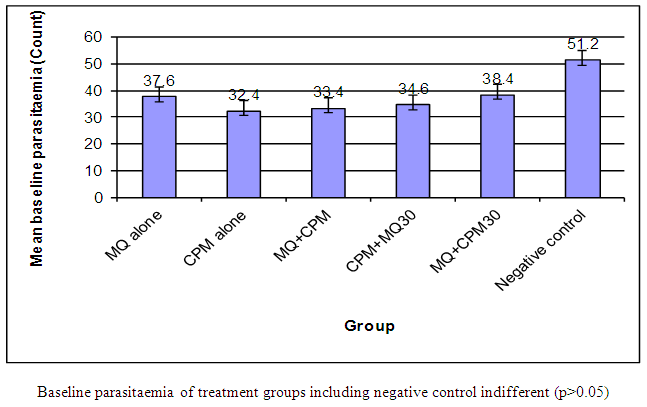 | Figure 3. Baseline parasitaemia of experimental animals before treatment |
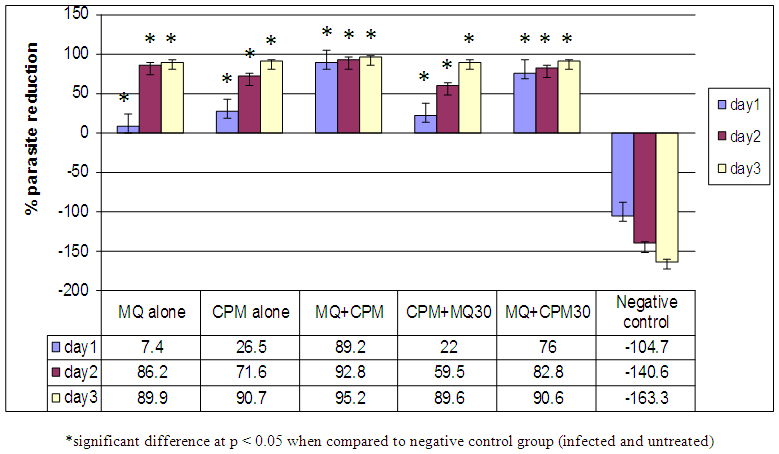 | Figure 4. Percent parasite reductions of experimental groups from day 1-3 |
3.2. Haematology
Figures 5 to 8 show the effect of treatment on haematological parameters;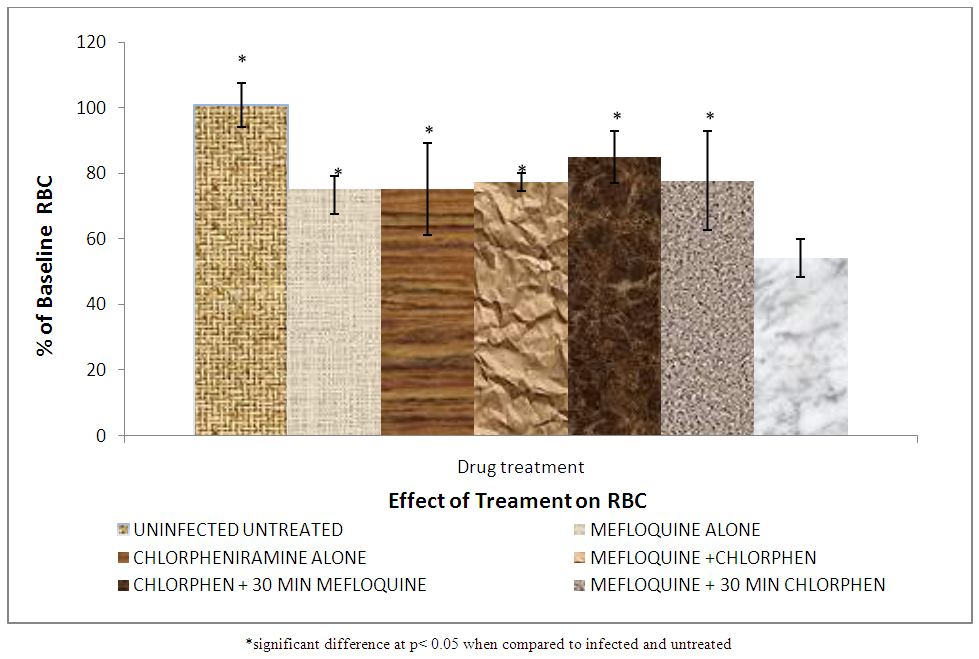 | Figure 5. Effect of treatment on red blood cell count |
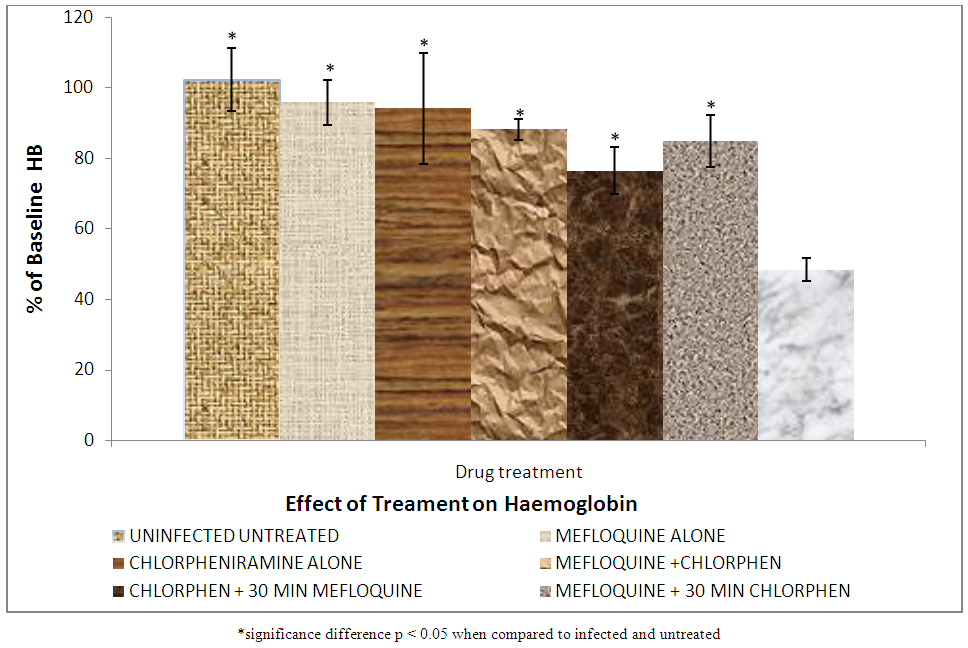 | Figure 6. Effect of treatment on serum haemoglobin |
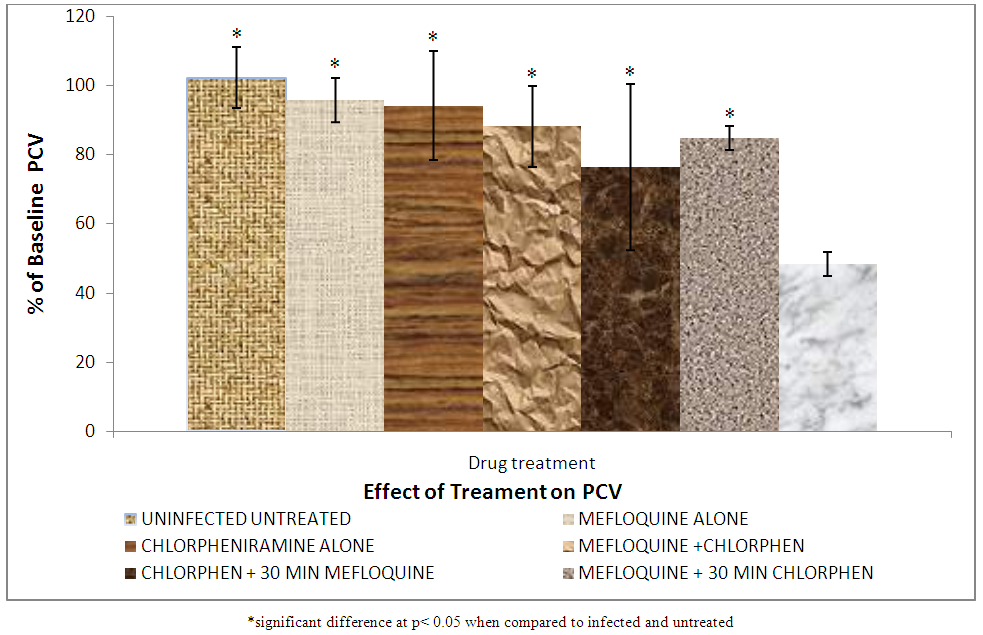 | Figure 7. Effect of treatment on packed cell volume |
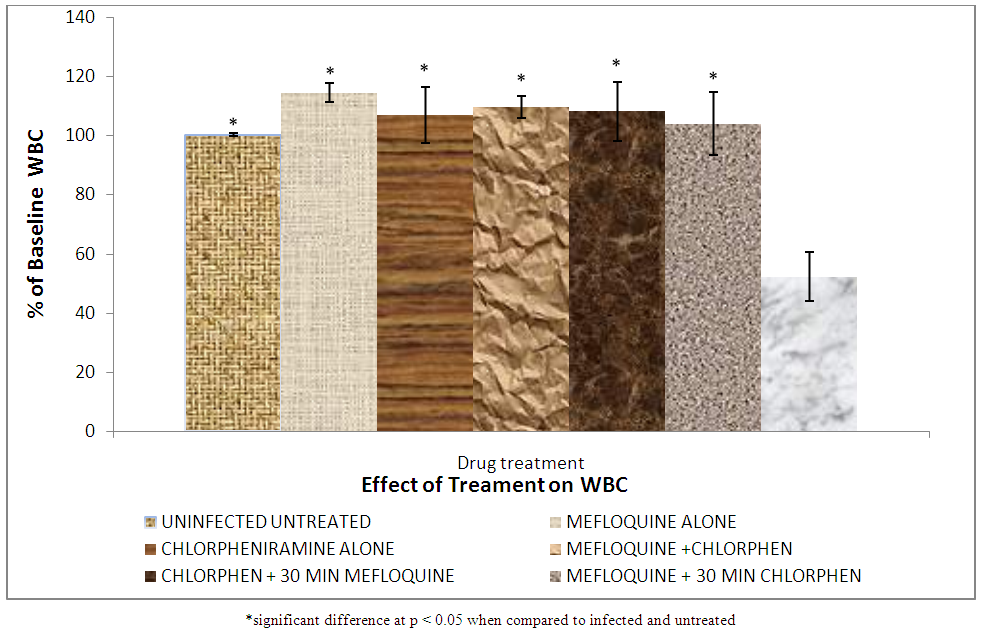 | Figure 8. Effect of treatment on white blood cell count |
Haemoglobin is found on the surface of the red blood cell as oxygen carrying pigment. As the malaria parasite attacks the red blood cells causing its haemolysis, there is reduction in the haemoglobin concentration. The growing malaria parasite also consumes and degrades heamoglobin [26]. This leads to further decrease in haemoglobin concentration of the red blood cells. Group VII (infected untreated) showed significantly (p < 0.05) lower haemoglobin when compared to groups II, III, IV, V and VI (mefloquin alone, chlorpheniramine alone, mefloquine + chlorpheniramine together, chlorpheniramine first + mefloquine 30mins later and mefloquine first + chlorpheniramine 30mins later respectively. This is as a result of the administration of treatment to the animals which killed the parasite and prevented further digestion of haemoglobin. But there was no significant difference (p<0.05) between groups II, III, IV, V and VI .This indicates that mefloquine + chlorpheniramine combination cannot induce haemoglobin reduction in any way.
3.3. Packed Cell Volume
The results of the packed cell volume is shown in Figure 7 shows that the percentage PCV of group VII rat (infected and untreated) decreased significantly (p < 0.05) compared to all the other groups. PCV drop is as a result of the parasite attacking the red blood cells and causing haemolysis. A significant decrease in PCV of group VII (infected and untreated compared to group II, III, IV, V and VI treated with mefloquine alone, chlorpheniramine alone, mefloquine + chlorpheniramine together, chlorpheniramine first + mefloquine 30mins later and mefloquine first + chlorpheniramine 30mins later respectively was observed.
3.4. White Blood Cell
The results of white blood cell are shown in Figure 8.
3.5. Biochemical Parameters
The result of the effect of treatment on liver enzyme, alanine aminotransferase are shown in Figure 9 while Figure 10 shows the effect of treatment on liver enzyme: Aspartate aminotransferase. In Figure 9, there was a significant (p < 0.05) increase of alanine aminotransferase (ALT) in the blood of group VII (infected untreated) compared to all the other groups. This is as a result of malaria parasite infection which caused injury to the liver leading to the release of the enzyme in the blood stream.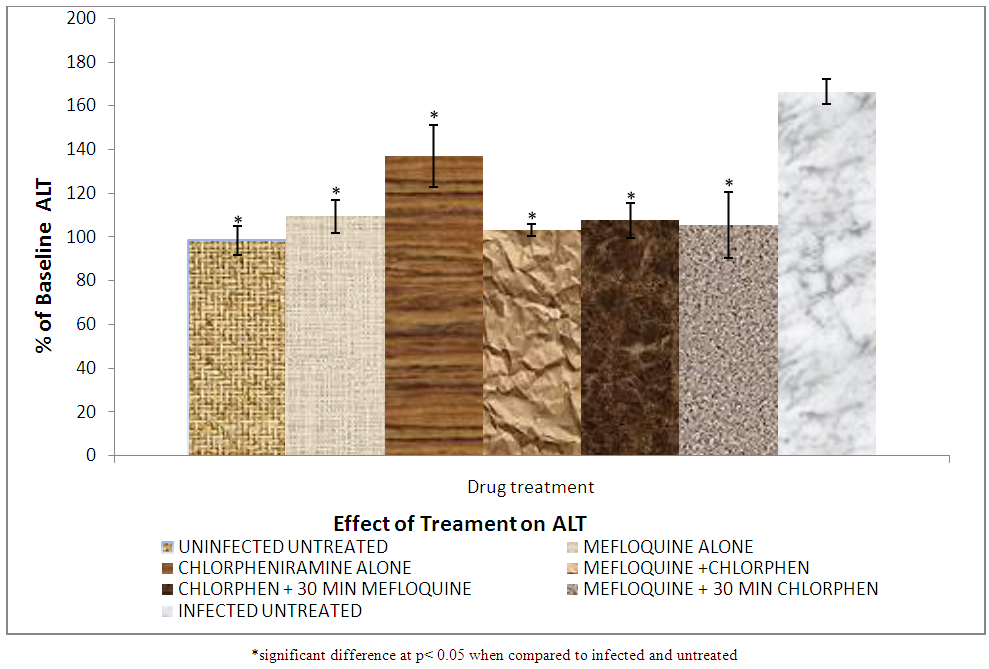 | Figure 9. Effect of treatment on serum alanine aminotransferase |
3.6. Result of AST
The results of AST on the effect of treatment on liver enzyme are shown in Figure 10.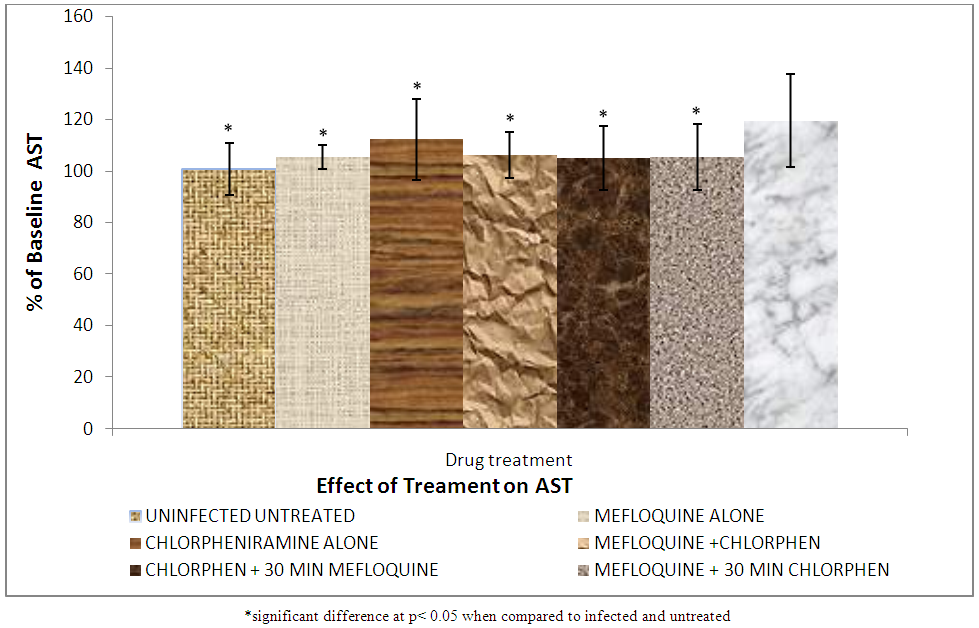 | Figure 10. Effect of treatment on serum aspartate aminotransferase (AST) level |
3.7. Histopathological Effects on the Liver
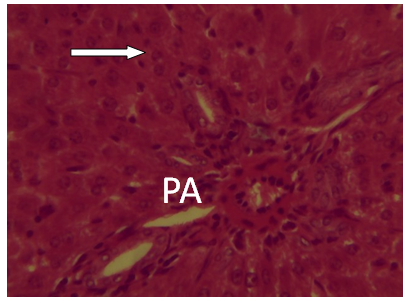
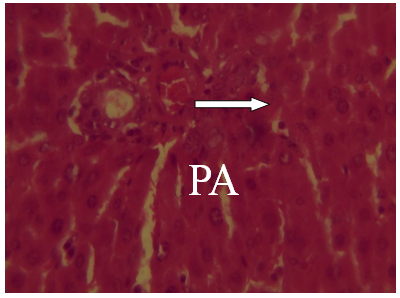
The results of the histopathological effects on the liver are shown in Figures 11-16. Figs. 14, 15 and 16 Photomicrographs of liver section from experimental animal groups 4, 5 and 6 (MQ + CPM together), (CPM + MQ 30mins) and (MQ + CPM 30mins) respectively showing red pulp, white pulp and the central arteriole portal arrow (PA) H and E (x 40).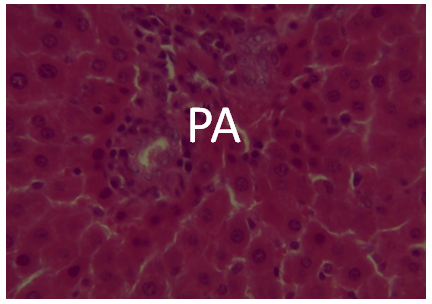 | Figure 11. A photomicrograph of liver Section from experimental animal Group 1 uninfected showing the portal area (PA) H and E (x 40) |
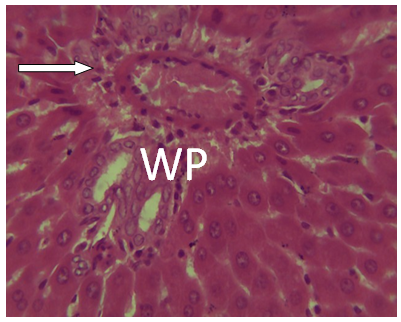 | Figure 12. Photomicrograph of liver section from experimental animal group 2 (MQ) alone showing white pulp and the central arteriole. H and E (x 40) |
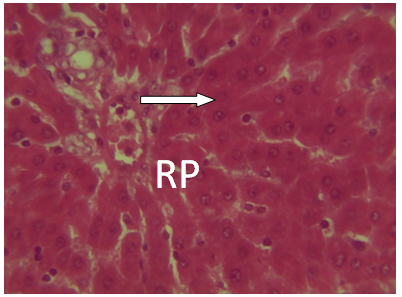 | Figure 13. Photomicrograph of liver section from experimental animal group 3 (CPM) alone showing red pulp (RP). H and E(x 40) |
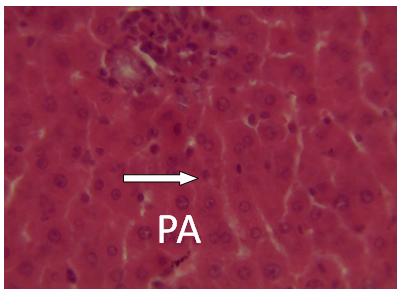 | Figure 14. Photomicrographs of liver section from experimental animal groups 4 i. e. (MQ + CPM together) showing red pulp, white pulp and the central arteriole portal arrow (PA) H and E (x 40) |
 | Figure 15. A Photomicrograph of liver section from experimental animal group 7 infected untreated showing portal area damaged (PA) H and E (x 40) |
 | Figure 16. Photomicrographs of liver section from experimental animal groups 6 (MQ + CPM 30mins) showing red pulp, white pulp and the central arteriole portal arrow (PA) H and E (x 40) |
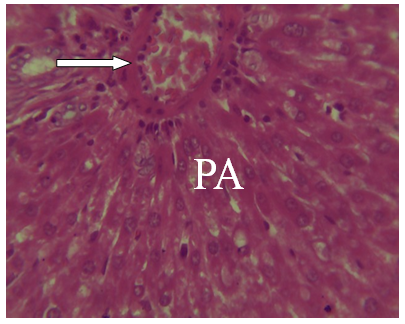 | Figure 17. A Photomicrograph of liver section from experimental animal group 7 infected untreated showing portal area damaged (PA) H and E (x 40) |
3.8. Pharmacokinetics
The results of the pharmacokinetic profile are shown in Figures 18-23.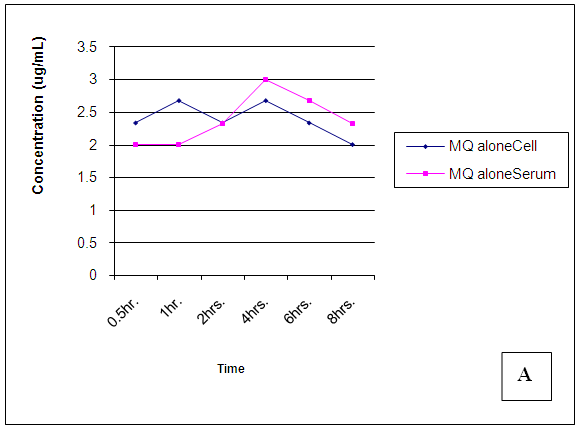 | Figure 18. Trendsof Mefloquine (MQ) concentrations in cell and serum when administered alone |
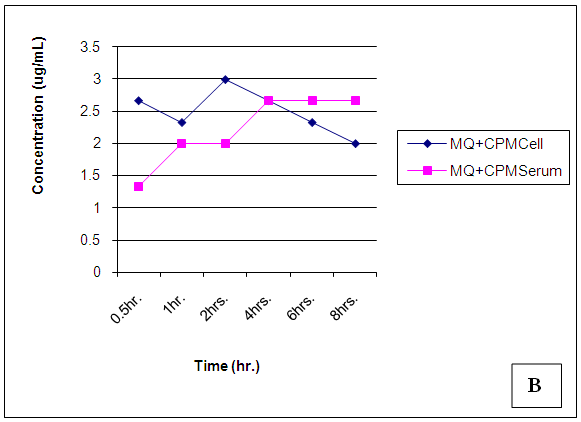 | Figure 19. Trendsof Mefloquine (MQ) concentrations in cell and serum when administered concomitantly with Chlorpheniramine (CPM) |
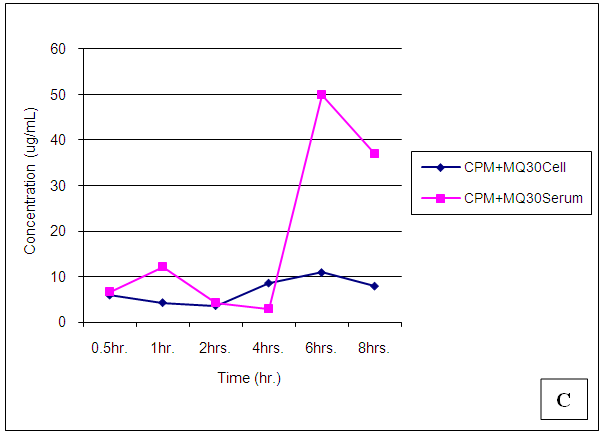
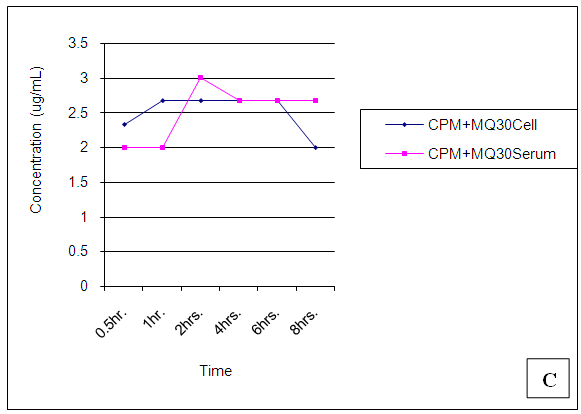 | Figure 20. Trendsof Mefloquine (MQ) concentrations in cell and serum when administered 30min. after Chlorpheniramine (CPM) |
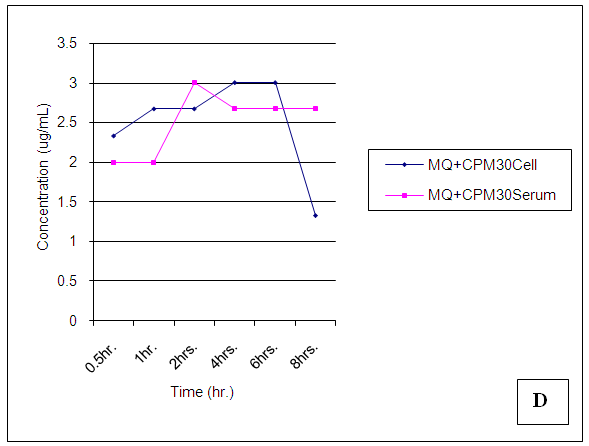 | Figure 21. Trendsof Mefloquine (MQ) concentrations in cell and serum when administered 30 min. before Chlorpheniramine (CPM) |
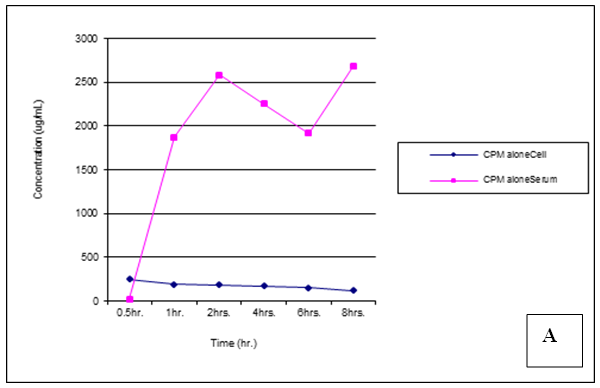 | Figure 22. Trends of Chlorpheniramine (CPM) concentrations in cell and serum when administered alone |
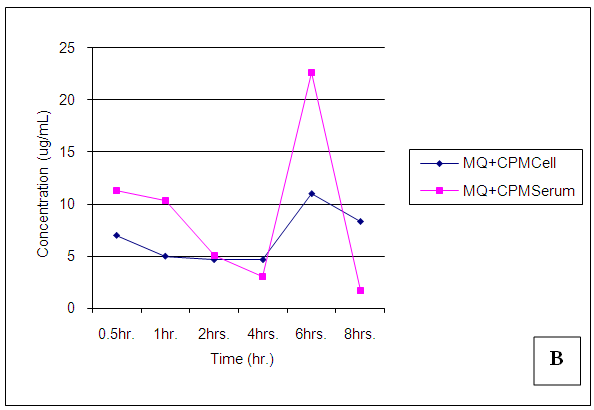 | Figure 23. Trends of Chlorpheniramine (CPM) concentrations in cell and serum when administered concomitantly with Mefloquine (MQ) |
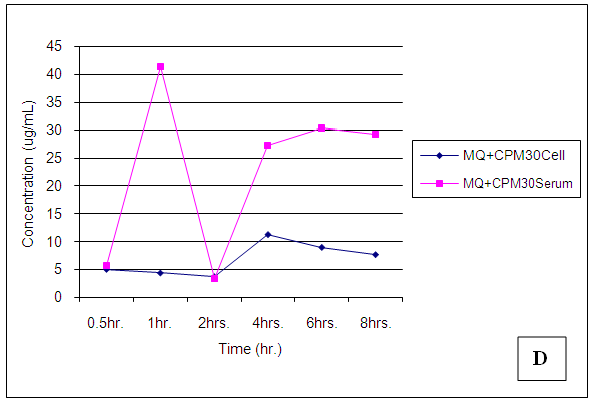
 | Figure 24. Trendsof Chlorpheniramine (CPM) concentrations in cell and serum when administered 30 min. before Mefloquine (MQ) |
 | Figure 25. Trendsof Chlorpheniramine (CPM) concentrations in cell and serum when administered 30 min. after Mefloquine (MQ) |
4. Discussion
4.1. Antiplasmodial Testing
Figure 3 shows the baseline parasitaemia in experimental treatment groups, including the negative control, prior to treatment. The various groups before the commencement of treatment had comparable baseline levels of parasite count (p > 0.05) as shown in Figure 3. Figure 4 depicts the overall trend in percent parasite reduction from baseline parasitaemia for the various treatment groups, including the control, from Day 1 to Day 3. The Dunnett post hoc test on the treatment groups against the negative control group revealed statistically significant reduction in the levels of parasite in the treatment groups from Day1 to Day 3 (p < 0.05). When post hoc Tukey test was conducted on the treatment groups, excluding the negative control group, the results revealed that on Day 1, experimental group to which mefloquine was administered concomitantly with chlorpheniramine demonstrated the most significant parasite reduction from baseline parasitaemia compared with the group to which mefloquine was administered alone (p=0.000), CPM administered alone (p=0.006) and when mefloquine administered 30 min later than chlorpheniramine (p=0.001). But the percent parasite reduction in the group to which chlorpheniramine 30 min later than mefloquine was found to be statistically insignificantly different (p = 0.804).On Day 2, the residual parasite count in the group to which mefloquine and chlorpheniramine were administered concomitantly also demonstrated significantly the highest reduction in parasite levels from baseline parasitaemia compared with the group to which chlorpheniramine was administered alone (p = 0.033) and that to which mefloquine was administered 30 min later than chlorpheniramine (p=0.000). Compared with the group to which mefloquine was administered alone and that to which chlorpheniramine was administered 30 min later, the percent parasite reductions were insignificantly different (p > 0.05). By Day 3, the results revealed that the percent reduction of parasites in all treatment group were averagely 90%, which were statistically (p > 0.05) the same when compared.
4.2. Haematology
Merck manual defines haematology as the study of the numbers and morphology of the cellular elements of the blood. The red cells (erythrocytes) white cells (leucocytes) and the platelets (thrombocytes) and the use of these result in the diagnosis and monitoring of disease. Haematological parameters are indicators of the physiological status of animals acting as a pathological reflector of the status of exposed animals to toxicant disease and other conditions [23]. The data on percentage red blood cell, haemoglobin and packed cell volume before treatment shows no significant difference (p > 0.05) in all the groups of the animals. This means that all the animals were of the same health status before treatment. Figure 5 shows that percentage red blood cells were significantly higher in group 1 (uninfected and untreated compare to groups (II, III, IV, V, VI and VII). The high RBC in group I is a result of being free from malarial infections or complete absence of malaria parasite. It also shows in Fig 5 that group VII has a significant (p < 0.05) decrease in RBC, as a result of malarial parasite. This group was infected but not treated in other words this group is sick when compared to other groups. The observed decrease in RBC may be due to multiple causes of which repeated haemohysis of infected red cells may be one of them.The haemolysis may be due to non immune destruction of parasitized red cells in case of high parasitaemia or immune mediated destruction of parasitized as well non parasitized red cells because the changes in the red cell antigen structure brought about by the parasitic invasion stimulate the production of antibodies against the red cell. This triggers immune mediated red cell lysis [24]. There was a significant (p > 0.05) increase in percentage red blood cell in groups (II, III, IV, V and VI) when compared to group VII (infected and untreated). The reason is that the antimalarial destroyed the parasite from circulation and the cells begin to gradually divided and replenish the blood. It was also observed that groups (II, IV, V and VI) did not show significant (p < 0.05) difference in percentage red blood cell. This means that combination of mefloquine with chlorpheniramine.Figure 6 shows that the percentage haemoglobin for rats in group VII (infected untreated) were significantly (p < 0.05) lower than that for group I (uninfected and untreated). This actually confirms the work of Quintero et al., [25] which states that malaria is associated with severe anemia especially in children and pregnant mothers.
4.3. Packed Cell Volume
Packed cell volume (PCV) is the hematocrit value expressed as the percentage of cellular elements with that of whole blood. This is the value of red cell packed at the bottom of a hematocrit tube when the blood is centrifuged, it is important in determining anemia, extent of dehydration and recovery from dehydration after treatment [27]. This means that the malaria parasite actually attacked the red blood cells and reduced their PCV but on treatment, blood cells regenerate leading to improved % PCV. There was no significant (p < 0.05) difference in PCV between groups II, IV, V, and VI treated with mefloquine alone, mefloquine + chlorpheniramine together, chlorpheniramine first + mefloquine 30mins later and mefloquine first + chlorpheniramine 30mins later respectively.
4.4. White Blood Cell
White blood cell (WBC) counts during malaria are generally characterized as being low to normal, a phenomenon that is widely thought to reflect localization of leukocytes away from the peripheral circulation or limb where blood is usually taken from during the test to the spleen and other marginal pools rather than actual depletion or stasis [28].Leukocytosis is typically reported in a fraction of cases and may be associated with concurrent infections and or poor prognosis [28]. Figure 8 shows that group VII (infected untreated) has the lowest white blood cell (WBC) count. This is so because some of the WBC must have migrated to the spleen and other organs to fight the infections thereby reducing the quantity of WBC in the limb or periphery where the blood sample is collected for analysis. Group I (uninfected untreated) has a significantly (p < 0.05) higher WBC which shows that there are enough WBC in the periphery. There was no significant difference between groups (II, IV, V and VI) because of the treatment given which reduced the parasite load and then encouraged the WBC in the periphery.
4.5. Biochemical Parameters
Alanine aminotransferase (ALT) is normally found in the blood, but when the liver is damaged or diseased, it releases ALT into the blood stream which makes ALT levels go up [29]. The observed increase in ALT in group VII is as a result of liver injury and altered hepatocyte integrity caused by the malaria parasite infection.Group I (uninfected untreated) has a level of ALT which serves as a control. The level of ALT in groups (II, IV, V, and VI) shows no significance difference (p < 0.05) compared to group I. The reason is that the animals were infected but later treated thereby reducing the level of the ALT in their blood stream. This also shows that combination of mefloquine and chlorpheniramine does not induce a change in ALT level and it is safe for the liver.In group III (chlorpheniramine alone) there was an elevated level of ALT but significantly lower (p < 0.05) than group VII (infected untreated). The reason could be that chlorpheniramine alone is not really a good antimalarial because of this it was unable to clear the liver of the disease and normalize the liver.Aspartate aminotransferase (AST) is found in high concentration in the liver, heart, skeletal muscle and kidney, and in conjunction with ALT to detect liver disorders [30].Figure 10 shows that group VII (infected untreated) is significantly higher than all other groups. This is as a result of untreated malaria infection which induces injury to the liver thereby causing increase in the level of AST. But groups II, IV, V, and VI treated with mefloquine alone, mefloquine + chlorpheniramine together, chlorpheniramine first + mefloquine 30mins later, mefloquine first + chlorpheniramine 30mins later respectively showed no significant difference (P > 0.05) in AST compared to group I (uninfected and untreated) it shows that the combination of mefloquine and chlorpheniramine does not induce further liver enzymes changes.
4.6. Histopathology
It was observed from photomicrograph that the group I (uninfected and untreated) shows no sign of liver damage because the portal area is intact but when compared to group VII (infected and untreated) which shows clearly portal damage. This is as a result of the malaria parasite infections. Group II (mefloquine alone) shows white pulp and central arteriole and group III (chlopheniramine alone) shows red pulp. Then group IV, V and VI shows red pulp, white pulp and central arteriole. There is no liver damage in these groups, the liver is intact. This shows that combination of mefloquine + chlorpheniramine has no damaging effect on the liver.Red pulp is made up of venous sinuses (blood filled cavities) and spleenic cords. The function is to filter the blood of antigens, defective or worn out red blood cells while the white pulp is lymphatic tissue (which is part of the immune system) mainly made up of white blood cells [31].
4.7. Pharmacokinetics Studies
All concentrations obtained from HPLC output in milligram (mg) were converted to microgram (μg), checked and entered into SPSS V. 20 spreadsheet for inferential statistics. Independent samples-t-test was conducted to see if the interactions between mefloquine and chlorpheniramine in cell and serum compartments were significantly different at 95% confidence. Four scenarios were considered for both mefloquine and chlorpheniramine: Administered alone, concomitantly; 30min before and 30min after.
4.7.1. Mefloquine (MQ)
At 30 mins post administration, the mean concentrations of mefloquine administered alone in cell and serum compartments were insignificantly different (p = 0.374). When administered concomitantly with chlorpheniramine, cell and serum concentrations were also found to be statistically insignificantly (p = 0.148) different even though there was an observable slight increase in the cell. When mefloquine was administered 30min succeeding chlorpheniramine, its concentration in the cell was slightly above that found in the serum but these concentrations were found to be statistically insignificantly different (p = 0.374). In the fourth scenario, mefloquine was administered 30min preceding chlorpheniramine and its concentration in the serum was insignificantly slightly above that in the cell (p = 0.374). At 1,2,4,6 and 8 hours post administration, mefloquine concentrations in the cell and serum compartments were found to be comparable (p > 0.05) (Figs 18-21). From the foregoing, chlorpheniramine interaction with mefloquine did not significantly affect mefloquine concentrations in cell and serum.
4.7.2. Chlorpheniramine (CPM)
Chlorpheniramine concentrations in cell and serum were significantly (p < 0.05) reduced in the presence of mefloquine 30min post administration, a higher concentration was found in cell when administered alone (p = 0.001). After 1,2,4,6 and 8 hours post administration, chlorpheniramine concentrations became significantly (p < 0.001) higher in serum than in cell (Figures 21 – 24).Malaria is an acute and chronic mosquito-borne disease of man characterized by chills, fever, anaemia, splenomegaly and damage to other organs such as liver and brain. It is an ancient disease and it is still leading Africa’s health problem. The emergence of multidrug resistant strain of P. falciparium has made the treatment of malaria difficult. P. falciparium is resistant to chloroquine, mefloquine, amodiaquine leading to introduction of artemisinin based combination therapy (ACT).According to WHO report in 2015, artemisinin combination therapy resistance was observed mainly in Cambodia, attributing to the resistance of the malaria parasite to the partner drugs like piperaquine and mefloquine leading to the failure of artemisinin. Mefloquine is a drug of choice in the treatment of malaria because of its long half life leading to short duration of the therapy. But increasing resistance to mefloquine has led to suspension of mefloquine as a drug of choice. Combination of chlorpheniramine with mefloquine has showed an improvement in the activity of mefloquine in treating chloroquine resistant Plasmodium falciparum malaria. This is believed to be as a result of chlorpheniramine reversing or inhibiting the efflux system in the plasmodium parasite. This work also confirms the work by Osonwa et al., [32] 2015 in which they observed the increase in efficacy of chloroquine when combined with chlorpheniramine. The efficacy of mefloquine and chlorpheniramine combination was compared with that of mefloquine alone. The time of administration of the mefloquine like; mefloquine + chlorpheniramine together, chlorpheniramine given first + mefloquine 30mins later and mefloquine given first + chlorpheniramine 30mins later was also considered to ascertain the best time for the combination that will give the best result when compared to mefloquine alone. The effect of the combination on haematological, biochemical and histopathological changes in the liver was assessed in treated and untreated rats The pharmacokinetics studies was also carried out to ascertain the bioavailability of the various combination in comparison to mefloquine alone.
5. Conclusions
The results showed that chlorpheniramine enhances the antiplasmodial activity of mefloquine. Chlorpheniramine is safe and affordable, combining chlorpheniramine with mefloquine will give an affordable and highly effective antimalarial combination.
6. Recommendations
More work needs to be done on this topic especially on the effect of the combination in a transgenic rat infected with P.falciparum. This will be followed by the formulation of the drug in a fixed dose form and also carry out the stability studies. The in vitro and in vivo studies of the formulated drug should also be carried out to determine the efficacy, toxicity and pharmacokinetics of the formulation.
Abbreviations as Used in the Text
MQ: Mefloquine; CPM: Chlorpheniramine maleate; RBC: Red Blood Cells; PCV: Packed Cell Volume; ALT: Alanine aminotransferase; CDC: Centre for Disease Control; WRAIR: Walter Reed Army Institute of Research; PRBC: Parasitized Red Blood Cells; EDTA: Ethylene diamine tetraacetic acid; WBC: White Blood Cells; AST: Aspartate aminotransferase; USP: United States Pharmacopoeia.
ACKNOWLEDGEMENTS
We would like to acknowledge the cooperation and steadfastness of the study population and local staff.
References
| [1] | Aguwa CN (2004). Therapeutics basis of clinical pharmacy in the tropics (3rdEdition) Enugu, SNAAP Press Ltd. |
| [2] | Rich SM., Ayala FJ (2006). Evolutionary origins of human malaria parasites, Eds. 2006; New York: Springer. |
| [3] | Cox-Singh J, Singh B (2008). Knowelsi malaria; newly emergent and public health importance. Clinical microbiology reviews. 24(9): 406-410. |
| [4] | Cater R, Mendis KN (2002). Evolutionary and historical aspects of the burden of malaria. Clinical microbiology reviews. 15(4): 564-594. |
| [5] | Martin SK, Oduola AMJ, Milhous WK (1987). Reversal of chloroquine resistance in Plasmodium falciparum by verapamil Science. 235: 899–910. |
| [6] | Kyle DE, Oduola AMJ, Martin SK, Milhous WK (1990). Plasmodium falciparum: modulation by calcium antagonists of resistance to chloro-quine, desethylchloroquine, quinine and quinidine invitro. Trans R Soc Trop Med Hyg. 84: 474–8. |
| [7] | Shao BR, Huang ZS, Shi XH & Meng FA (1991). 5-year surveillance of sensitivity in vivo of Plasmodium falciparum to pyronaridine/sulfadoxine/pyrimethamine in Diaoluo area, Hainan province. Southeast Asian Journal of Tropical Medicine and Public Health. 22: 65–67. |
| [8] | Aaron LB and Hill DR (2002). Antiparasitic agent Atovaquine. Antimicrob Agents Chemother. 46(5): 1163-73. |
| [9] | Looareesuwan S (1994). Overview of clinical studies on artemisinin derivatives in Thailand. Trans Roy Soc Trop Med Hyg. 88: Suppl.1, 88-90. |
| [10] | Looaresuwan S, Vanijanonta S, Viravan C, et al (1994b). Randomised trial of mefloquine-tetracycline and quinine-tetracycline for acute complicated falciparum malaria. Acta Tropica. 57: 47-53. |
| [11] | Duarte EC, Fontes CJF, Gyorkos TW and Abrahamowicz M (1996). Randomized controlled trial of artesunate plus Tetracycline versus standard treatment (quinine plus Tetracycline) for uncomplicated Plasmodium falciparum Malaria in Brazil. Am. J. Trop. Med. Hyg. 54(2): 197-202. |
| [12] | Peters W, Ekong R, Robinson BL, Warhurst DC, Pan XO (1989). Antihistaminic drugs that reverse chloroquine resistance in Plasmodium falciparum. Lancet 2: 334–5. |
| [13] | Peters W, Ekong R, Robinson BL, Warhurst DC (1990). The chemotherapy of rodent malaria. XLV. Reversal of chloroquine resistance in rodent and human plasmodium by antihistaminic agents. Ann Trop Med Parasitol. 84:541–51. |
| [14] | Ashley MC (2010). A lesson learnt: the rise and fall of Lariam and Halfan. Journal of the royal society of medicine. 100(4): 170-4. |
| [15] | Lee SJ, Kuile FO, Price RN, Luxemburger C and Nosten F (2016). Adverse effects of mefloquine for the treatment of uncomplicated malaria in Thailand: A pooled analysis of 19, 850individual patients. Plos one. 12(2): 1-16. |
| [16] | Alagarsamy V (2012). Textbook of medicinal chemistry. USA: Elsevier health sciences. |
| [17] | Ogungbamigbe TO, Ojurongbe O, Ogunro PS, Okanlawon BM, Kolawole SO (2008). Chloroquine resistant Plasmodium falciparum malaria in Osogbo Nigeria: efficacy of amodiaquine + sulfadoxine-pyrimethamine and chloroquine + chlorpheniramine for treatment. Mem. Inst. Oswaldo Cruz. Vol.103no.1. |
| [18] | Omitowoju GO, Ogundahunsi OAT, Milhous WK, Gerena L, Sowunmi A, Schuster BG, Oduola AMJ (1992). Chlorpheniramine: A resistance reversing agent with potential clinical application. The 41st annual meeting of The American Society of Tropical Medicine and Hygeine ,Seattle, Washington, November15–19, Abstractno.204.Supplement to Am J Trop Med Hyg. 47(4) suppl: 175. |
| [19] | Basco LK, LeBras J (1994). In vitro reversal of chloroquine resistance with chlorpheniramine in African isolates of Plasmodium falciparum. Jpn J Med Sci Biol. 45:59–63. |
| [20] | Sowunmi A, Oduola AMJ, Ogundahunsi OAT, Falade CO, Gbotosho GO, Salako LA (1997). Enhanced efficacy of chloroquine–chlorpheniramine combi- nation in acute uncomplicated falciparum malaria in children. Trans R Soc Trop Med Hyg. 91:63–67. |
| [21] | Narkornchai S, Konthiang P (2006). Potentiation of antimalarial drug action by chlorpheniramine against multidrug-resistant plasmodium falciparum. Parasitology International. 55(3): 195-199. |
| [22] | Reitman S, Frankel SA (1957). Acolorimetric method for the determination of serum glutamic oxaloacetic and pyruvic transaminases. Am J Clin Pathol. 28(1): 56- 63. |
| [23] | Nse-Abasi NE, Enyenihi GE, Akpabio U, Offiong EEA (2014). Effects of nutrition on haematology of rabbits: A review. Eur Sci J. 10(3):1857 – 7881. |
| [24] | Rajesh S, Nidhi B, Gaijjar M (2013). Autoimmune hemolytic anemia in a patient with malaria. Asian J Transfus Sci. 7(2):151-2. |
| [25] | Quintero JP, Siqueira AM, Tobón A, Blair S, Moreno A, Herrera MA, Lacerda MVG, Valencia SH (2011). Malaria-related anaemia: a Latin American perspective. Mem. Inst. Oswaldo Cruz. vol.106supl.1. |
| [26] | Gavigan CS, Dalton JP, Bell A (2001). The role of aminopeptidases in haemoglobin degradation in Plasmodium falciparum-infected erythrocytes. Mol Biochem Parasitol. 117(1): 37-48. |
| [27] | Brian SB, Karen LH (2001). Laboratory Hematology. UK: (Eds). Garden Jennings Publishing Co. Ltd. |
| [28] | Mckenzie EF, Prodhomme WA, Magill AJ, Russ FJ, Permpanich B, Lucas C, Gasser RA, Wongrichanalai C (2008). White blood cell counts and malaria. Journal of infectious diseases. 192(2): 323-338. |
| [29] | Carey W (2009). Approach to the Patient with Liver Disease: A Guide to Commonly Used Liver Tests, Cleveland Clinic. Available online at http://0x9.me/KuL3p. |
| [30] | Carey WD, Murali AR (2014). Liver tests. Interpretation- Approach to patient with liver disease. A guide to commonly used liver tests. Retrieved from http://www.clevelandclinicmeded/livertests.com. |
| [31] | Mukonka V (2008). Ministry of Health Zambia. Action Plan: Actions for Scale Up for Impact on Malaria in Zambia in Support of the National Malaria Strategic Plan 2006–2011. Joint Action Plan. Lusaka: National Malaria Control Centre, RBM Task Force. |
| [32] | Osonwa UE, Adikwu MU, Eluu SC, Anagu LO, Esimone CO (2015). Potentiation of antimalarial activity of chloroquine by chlorpheniramine in plasmodium Berghei infected mice. Afr j pharm Res Dev. 7(2):77-86. |

 Abstract
 Reference
 Full-Text PDF
 Full-text HTML