-
Paper Information
- Next Paper
- Paper Submission
-
Journal Information
- About This Journal
- Editorial Board
- Current Issue
- Archive
- Author Guidelines
- Contact Us
American Journal of Medicine and Medical Sciences
p-ISSN: 2165-901X e-ISSN: 2165-9036
2017; 7(4): 189-195
doi:10.5923/j.ajmms.20170704.06

Determining the Relationship between Urine Creatinine and Urine Osmolality; And a Probable Correction Factor for Hypothetical Ratios for Estimating 24-Hour Urine Protein
 Abstract
 Reference
 Full-Text PDF
 Full-text HTML
Ernest Ndukaife Anyabolu1, 2, 3, Innocent Ijezie Chukwuonye4, Ejikeme Benneth Arodiwe5, Chinwuba K. Ijoma5, Arthur Ebelenna Anyabolu6, Innocent Chukwuemeka Okoye3, Oguamanam Okezie Enwere1
1Imo State University Teaching Hospital, Orlu, Nigeria
2Federal Medical Centre, Owerri, Nigeria
3Chukwuemeka Odumegwu Ojukwu University Teaching Hospital, Awka, Nigeria
4Federal Medical Centre, Umuahia, Nigeria
5University of Nigeria Teaching Hospital, Enugu, Nigeria
6Nnamdi Azikiwe University Teaching Hospital, Nnewi, Nigeria
Correspondence to: Ernest Ndukaife Anyabolu, Imo State University Teaching Hospital, Orlu, Nigeria.
| Email: |  |
Copyright © 2017 Scientific & Academic Publishing. All Rights Reserved.
This work is licensed under the Creative Commons Attribution International License (CC BY).
http://creativecommons.org/licenses/by/4.0/

Aims and Objectives: The aim of this study was to determine the relationship between urine creatinine and osmolality, and the probable correction factor for spot urine protein/creatinine ratio (SUPCR) and spot urine protein/osmolality ratio (SUPOR) for estimating 24-hour urine protein. Methodology: Creatinine and osmolality were evaluated in both spot and 24-hour urine samples. SUPCR, SUPOR, creatinine clearance (ClCr) and 24-hour urine protein (24HUP) were determined. The association between spot urine creatinine (SUCr) and spot urine osmolality (SUOsm) was determined. Spot urine creatinine (SUCr)/SUOsm ratio (SUCOR) was compared in 4 different groups with different levels of proteinuria (defined as 24HUP≥0.3g) and renal function (renal impairment defined as ClCr<90mls/min). A correlation scatter plot linear line of fit of SUPCR versus SUPOR was analyzed with the SUCOR. A correction factor was extrapolated for SUPCR and SUPOR. Results: The mean SUCr (137.21 ± 98.47mg/dl) was about twice mean 24HUCr (77.87 ± 39.62mg/dl), p<0.001, in HIV subjects. Mean SUOsm (464 ± 271mOsm/kgH2O) was about twice mean 24HUOsm (284 ± 216mOsm/kgH2O), p<0.001, in HIV subjects. The mean SUCOR (0.423±0.493) and mean 24-hour urine creatinine/osmolality ratio (24HUCOR) (0.461±0.426) in HIV subjects did not differ significantly, p=0.236. Similar values for the ratio were obtained in all the groups. Spot urine osmolality predicted SUCr, p<0.001. Scatter plot showed SUPCR = 3.33 x SUPOR + 0. SUCOR was 0.423 ± 0.493 in HIV, 0.590 ± 0.630 in Group 1 and 0.371±0.601 in Group 3.SUCOR ≡ 24HUCOR ≡ 0.423 (0.371-0.590). SUPOR ≡ SUPCR x Constant (0.423 ± 0.493). Conclusion: Spot urine contained about twice the concentration of creatinine and osmolality as in 24-hour urine. SUCr was a predictor of SUOsm. The ratio of creatinine to osmolality in both spot urine and 24-hour urine samples appeared to be constant. The correction factor for SUPOR was SUPCR x SUCOR (Constant 0.423±0.493). Future researches would be required to validate this correction factor.
Keywords: Correction factor, Spot urine protein/creatinine ratio, Spot urine protein/osmolality ratio, Relationship, Urine creatinine and urine osmolality
Cite this paper: Ernest Ndukaife Anyabolu, Innocent Ijezie Chukwuonye, Ejikeme Benneth Arodiwe, Chinwuba K. Ijoma, Arthur Ebelenna Anyabolu, Innocent Chukwuemeka Okoye, Oguamanam Okezie Enwere, Determining the Relationship between Urine Creatinine and Urine Osmolality; And a Probable Correction Factor for Hypothetical Ratios for Estimating 24-Hour Urine Protein, American Journal of Medicine and Medical Sciences, Vol. 7 No. 4, 2017, pp. 189-195. doi: 10.5923/j.ajmms.20170704.06.
Article Outline
1. Introduction
- The utility of urine osmolality for the calculation of 24-hour urine protein has been evaluated by some studies using a hypothetical ratio, spot urine protein/osmolality ratio (SUPOR). [1-5] Another independent hypothetical ratio, spot urine protein/creatinine ratio (SUPCR), has also been established for the estimation of 24-hour urine protein (24HUP). [1, 6, 7]Urine protein excretion exhibits variations during the day. [8] As a result, a single random or spot urine protein value may not reflect the actual total excretion of protein in 24 hours. [9] Protein excretion in urine may result from damage to glomerular filtration barrier, abnormality in the mechanism of proximal tubular reabsorption of protein, local tubular production of Tam Horsfall protein during challenges from urinary tract infection. [10] The first two processes denote evident damage in the kidney. Serum creatinine is fairly constant as creatinine excretion in urine is maintained in relation to creatinine production in the body as well as creatinine from exogenous sources in normal healthy states. Renal creatinine excretion is mainly from tubular secretion in normal renal functional states, [11] and tends to decrease with renal function impairment. [12]Urine osmolality varies over a wide range of values. [13] In normal clinical states, urine osmolality is regulated by vasopressin and aquaporin receptors activities in the collecting ducts in response to plasma osmolality. [14] Abnormalities of tubular function may impact on the osmolality of urine. [13] The determinants of the osmolality of urine include sodium, urea, protein, glucose and water. [15]The relationship between urine creatinine and urine osmolality is not completely known. It has been demonstrated that urine creatinine has a linear relationship with urine osmolality. [16] Furthermore, studies on the hypothetical ratios, SUPCR and SUPOR, also established that 24-hour urine protein excretion could be assayed by these ratios, [1-5] but would require correction factors to highly predict measured 24-hour urine protein, the hitherto gold standard for measuring daily urine protein excretion. [1] Nonetheless, complete explanation has not been advanced on the relationship between urine creatinine, urine osmolality and urine protein to account for these ratios. This study was undertaken to further evaluate the relationship between urine creatinine and urine osmolality and the probable correction factor for the hypothetical ratios, SUPCR and SUPOR, for the estimation of 24-hour urine protein excretion.
2. Materials and Methods
- This was a cross sectional study involving 393 human immunodeficiency virus (HIV) subjects (in the age range of 18–65 years) and 136 age- and sex-matched non-HIV Control in Federal Medical Centre (FMC), Owerri, Nigeria. The subjects were consecutively recruited from the HIV clinic and Out-patient clinic of the hospital. The survey was carried out between March and August 2011 in Federal Medical Centre, Owerri, Nigeria.Ethical clearance was obtained from the Ethics and Research Committee of the hospital. Informed consent was obtained from all the subjects. Demographic, anthropometric and other relevant data were obtained with the aid of a questionnaire.Clear instructions were given to all the subjects on how to collect 24-hour urine sample. A day-time random spot urine sample and blood samples were collected at the end of the 24-hour urine sample collection. [1]From the random spot urine samples collected, spot urine protein (SUP), spot urine creatinine (SUCr) and spot urine osmolality (SUOsm) were performed. Also from the 24-hour urine samples collected, 24-hour urine protein (24HUP), 24-hour urine creatinine (24HUCr) and 24-hour urine osmolality (24HUOsm) were performed. Serum creatinine was performed on the blood samples collected. Osmolality was determined by freezing point depression method using Precision Osmette 5002 osmometer, creatinine by modified Jeff’s method and protein by photometric method. Creatinine Clearance (ClCr), SUPCR, SUPOR, spot urine creatinine/ osmolality ratio (SUCOR) and 24-hour urine creatinine/ osmolality ratio (24HUCOR) were determined. [1]The subjects were grouped into 4 according to their ClCr and proteinuria. Group 1 were subjects in the study population without renal impairment and without proteinuria; Group 2 were subjects in the study population without renal impairment but with proteinuria; Group 3 were subjects in the study population with renal impairment and proteinuria; Group 4 were subjects in the study population with renal impairment without proteinuria. Renal impairment was defined as ClCr < 90mls/min, and proteinuria as 24HUP ≥ 0.300g.
3. Statistical Analysis
- SPSS version 17.0 (SPSS Inc., Chicago, Il, USA) statistical software was used to analyze the data.The association of SUOsm with SUCr was determined using correlation statistics. The strength of SUOsm to predict SUCr was determined using bivariate linear regression. The ratio of creatinine to osmolality in spot and 24-hour urine samples was determined. The ratios were compared in all HIV subjects, Group 1, Group 3 and non-HIV Control, and the strength of association determined using paired sample t-test. A correlation scatter plot linear line of fit of SUPCR versus SUPOR was generated and a linear equation derived to determine the direct linear relationship between SUPCR and SUPOR. The ratios of creatinine/osmolality in the spot urine samples (SUCOR) as well as in the 24-hour urine samples (24HUCOR) were substituted in the SUPCR and SUPOR equations to produce a linear relationship. P≤0.05 was taken as statistically significant.
4. Results
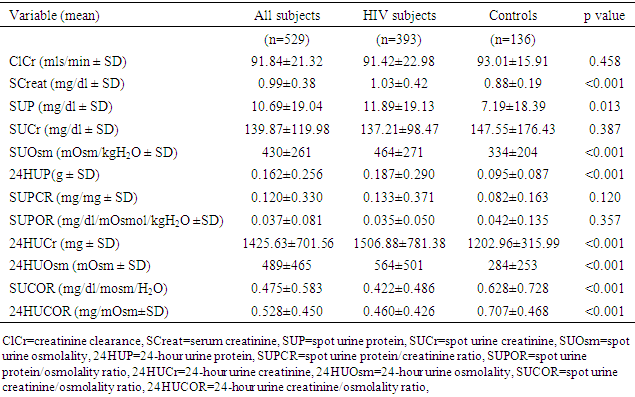
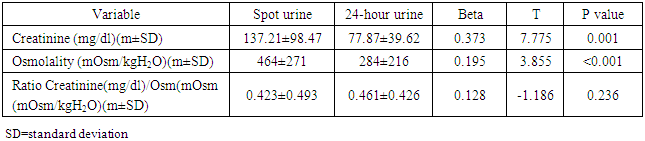
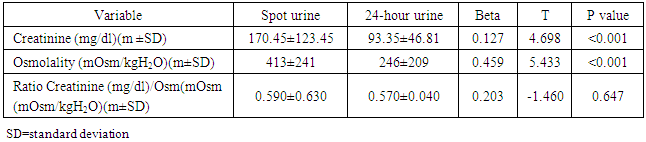
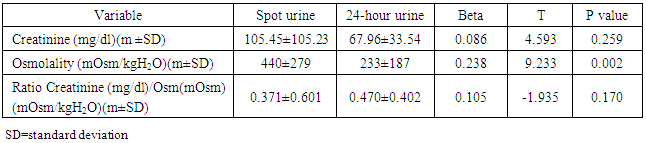
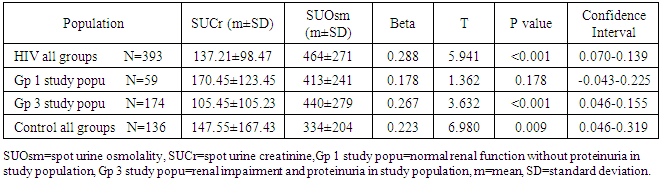
- The mean age of the HIV subjects was 39 ± 11 years and the non-HIV Control 39 ± 12 years. The mean values of other variables are shown in Table 1. The mean SUCr (137.21 ± 98.47mg/dl) was significantly higher than the mean 24HUCr (77.87 ± 39.62mg/dl), p<0.001, in HIV subjects. Similarly, the mean SUOsm (464 ± 271 mOsm/kgH2O) was significantly higher than the mean 24HUOsm (284 ± 216mOsm/kgH2O), p<0.001, in HIV subjects. Both the mean creatinine concentration and the mean osmolality in spot urine samples have about twice their values in 24-hour urine samples. Similar results were found in all the groups. (Tables 2-4).
|
|
|
|
|
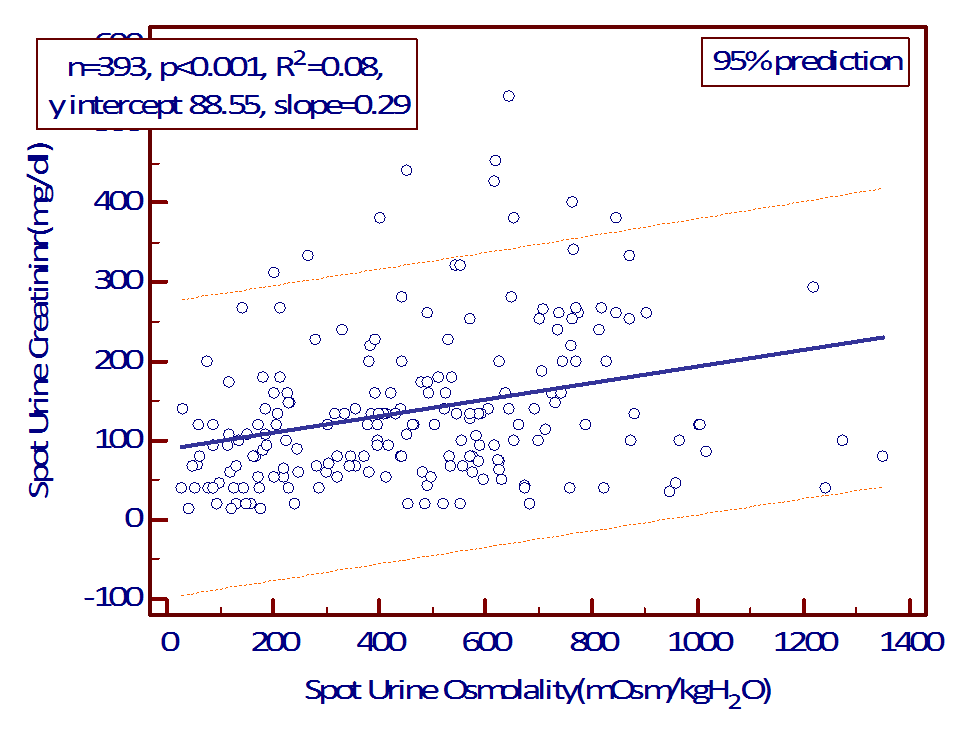 | Figure 1A. Linear regression plot of SUOsm versus SUCr in HIV subjects |
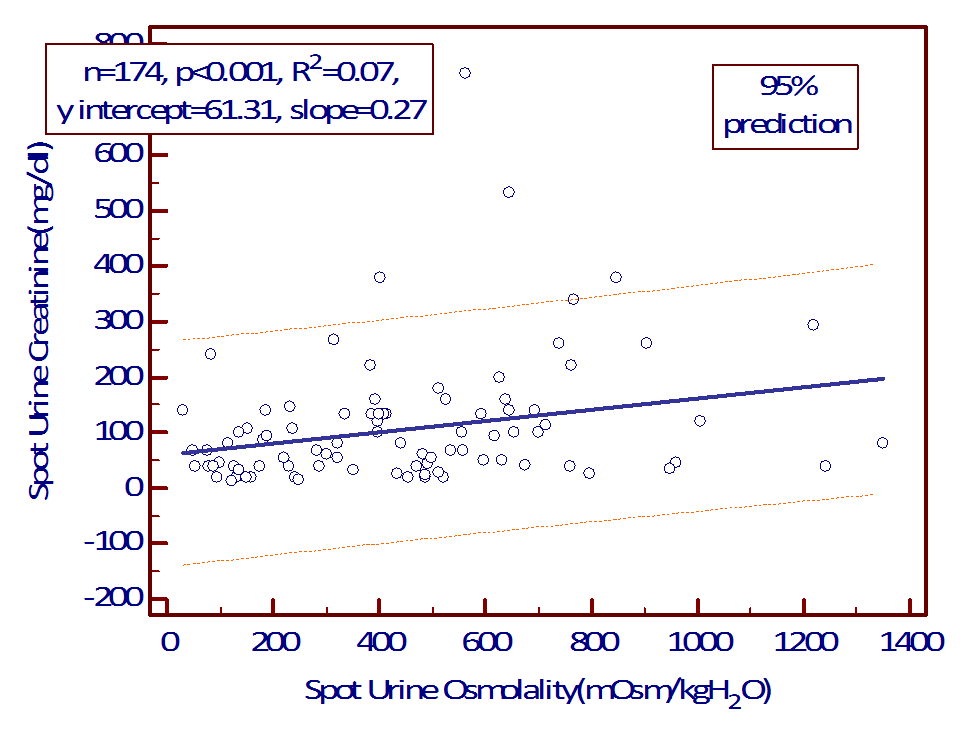 | Figure 1B. Linear regression plot of SUOsm versus SUCr in Group 3 of study population |
 SUOsm predicted SUCr in Group 3 of study population. The linear equation is
 SUOsm predicted SUCr in the Control. The linear equation is
 SUPCR correlated with SUPOR, p<0.001, but the scatter plot showed a linear relationship with equation SUPCR = 3.33 * SUPOR + 0. (Figure 2). Simply put, SUPCR ≠ SUPOR. (SUPCR was not equal to SUPOR).
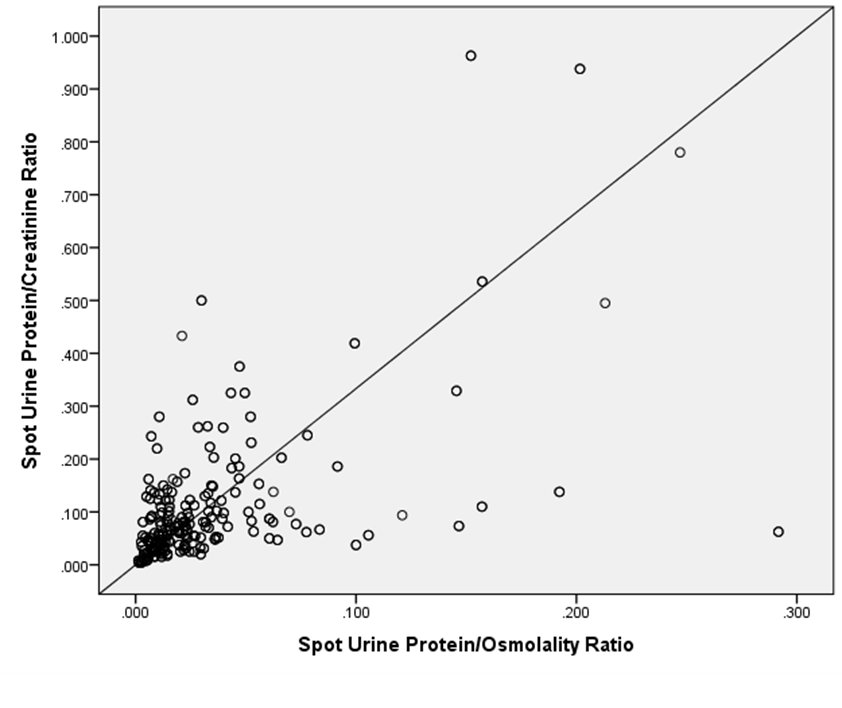 | Figure 2. Correlation (scatter plot) of SUPCr versus SUPOR y= 3.33*x + 0 |
5. Discussion
- Our study showed there was significant correlation between SUCr and SUOsm in HIV subjects and in the Control, not influenced by renal function and level of proteinuria. There was a linear relationship between urine creatinine and urine osmolality in both spot sample and 24-h collection. In addition, SUOsm is a predictor of SUCr. This study showed that SUOsm predicted SUCr. This is in agreement with a study that reported a similar observation. [16]The finding of SUCOR that was fairly constant in the study subjects is similar to the report of Godevithanage et al [16] in which they found that spot urine osmolality/creatinine ratio of healthy humans was consistent in the steady state. In their study, spot urine osmolality/creatinine ratio was about 65.69mOsm/mmol (25.01), 66.63 (5.38), 65.88 (4.8), 66.30 (3.8), 63.96 (4.2) documented over 4 consecutive days in the same study population. These compared to our findings in which we observed SUCOR of 0.423 ± 0.493 in HIV, 0.590±0.630 in Group 1 and 0.371 ± 0.601 in Group 3. The spot urine osmolality/creatinine ratio is an inverse of SUCOR. Expressed either way, it was constant. We also observed that the SUCOR was constant irrespective of level of proteinuria and state of renal filtration function. This was similar to the report by Godevithanage et al mentioned above. [16] Although there was a difference in their study design, they also noted that in a subset of the subjects who were given organophosphates to induce renal malfunction the spot urine osmolality/creatinine ratio remained constant. In that subset, they established evident renal malfunction assayed by rising serum creatinine. Similarly, our study demonstrated that SUCOR was contant in subjects with normal renal function and in those with renal impairment. Age, gender, weight and height were found not to influence spot urine osmolality/creatinine ratio in individuals older than 5 years. [16] We did not, however, evaluate the effects of these factors on SUCOR in our study. We also observed in our study 24HUCOR that was fairly constant. Expectedly, 24HUCOR would reflect SUCOR. From literature search, we could not find any study on 24HUCOR.Our study showed that the creatinine concentration in spot urine sample was about twice the creatinine concentration in 24-hour urine sample. Furthermore, we noted that the osmolality of spot urine sample was about twice the osmolality of 24-h urine sample. These were observed for creatinine concentration (mg/dl) and osmolality (mOsm/KgH2O) in the 24-hour urine samples, not absolute amount of creatinine in 24-h urine collection. In this study, the correlation scatter plot linear line of fit showed that SUPCR has a linear relationship with SUPOR but the two ratios were not equal. From the SUCOR and 24HUCOR, the Constant 0.423 (0.371 - 0.590) could transform SUPCR from SUPOR, and vice versa. The Constant suggests that SUPOR would give the same value as SUPCR x Constant, (ie. SUPOR = SUPCR x Constant). Literature search did not reveal any study on the use of any Constant to derive a correction factor for the hypothethical ratio, SUPOR, to impressively predict 24HUP; an assertion that would make both SUPCR and SUPOR to be used interchangeably with measured 24HUP, for the estimation of 24-hour urine protein excretion. [1]
6. Conclusions
- Spot urine contains about twice the concentration of creatinine and osmolality as in 24-hour urine. SUCr was a predictor of SUOsm. The ratio of creatinine to osmolality in both spot urine and 24-hour urine samples appeared to be constant, not influenced by degree of proteinuria or state of renal filtration function. The probable correction factor for SUPOR tending to SUPCR was SUPCR x 0.423(0.371 to 0.590). Further validation studies should evaluate this correction factor for SUPCR, SUPOR.