-
Paper Information
- Paper Submission
-
Journal Information
- About This Journal
- Editorial Board
- Current Issue
- Archive
- Author Guidelines
- Contact Us
American Journal of Medicine and Medical Sciences
p-ISSN: 2165-901X e-ISSN: 2165-9036
2016; 6(5): 152-159
doi:10.5923/j.ajmms.20160605.02

Visual Acuity Status amongst Secondary School Students in South East, Nigeria
 Abstract
 Reference
 Full-Text PDF
 Full-text HTML
Chika F. Ubajaka1, Uzochukwu E. Ebenebe1, Lilian O. Nwankwo1, Nonye B. Egenti2, Prosper O. Adogu1, Obiorah S. Ejiofor3
1Department of Community Medicine, Nnamdi Azikiwe University Teaching Hospital, Nnewi, Nigeria
2Department of Community Medicine, University of Abuja, Nigeria
3Department of Paediatrics, Anambra State University Teaching Hospital, Awka, Nigeria
Correspondence to: Chika F. Ubajaka, Department of Community Medicine, Nnamdi Azikiwe University Teaching Hospital, Nnewi, Nigeria.
| Email: |  |
Copyright © 2016 Scientific & Academic Publishing. All Rights Reserved.
This work is licensed under the Creative Commons Attribution International License (CC BY).
http://creativecommons.org/licenses/by/4.0/

Visual acuity is the acuteness or clarity of vision which is dependent on the shortness of the retinal focus within the eye, and the sensitivity of the interpretative faculty of the brain. Visual impairment has good prognosis if it is detected early as it is amenable to treatment, both through the use of proper eyeglasses and lifestyle modification. The aim of this study is to determine the visual acuity status amongst secondary school students in Nnewi, Anambra State, south east Nigeria. A descriptive cross-sectional study was conducted using the multi- stage sampling technique amongst 134 secondary school students in Nnewi. The mean age of the respondents was 12.9± 3.1 years. More of the respondents were females 78(58.2%) while 56(41.8) were males. The prevalence of visual acuity impairment was 26.1%. There was a translational relationship between impaired visual acuity and academic performance (P < 0.05). Majority of the respondents 129(96.3%), studied at night, and a good number, 59 (45.8%) used rechargeable lantern while 47(36.4%), used electric bulb. However, 16(12.4%) used kerosene lanterns and 7(5.4%), used candle light. Only 3.7% of the students underwent pre-medical fitness examination eye-check as a prerequisite for secondary school admission. The prevalence of visual acuity status below 6/6 amongst the students was high, and this is not good for school children in their formative years. Proper health education, early detection and appropriate management of impaired vision are recommended.
Keywords: Visual acuity, Vision, School students
Cite this paper: Chika F. Ubajaka, Uzochukwu E. Ebenebe, Lilian O. Nwankwo, Nonye B. Egenti, Prosper O. Adogu, Obiorah S. Ejiofor, Visual Acuity Status amongst Secondary School Students in South East, Nigeria, American Journal of Medicine and Medical Sciences, Vol. 6 No. 5, 2016, pp. 152-159. doi: 10.5923/j.ajmms.20160605.02.
Article Outline
1. Introduction
- The eyes play vital roles in our lives, and are perhaps the most important gift we have from God. Human beings, biologically, possess five major sense organs which enable them to adapt to the environment where they live and operate. Vision is the ability to interpret information in the surroundings, from the effects of visible light reaching the eye from any source [1]. For a normal eye, light is focused to a spot on the retina [1]. This message would then be sent to the brain, to be interpreted as a message.Vision is expressed in a fraction-like form [2]. The numerator is the distance at which the client reads the Snellen’s chart; the denominator is the distance at which someone with normal vision reads the same line of the chart. Vision is said to be impaired, when visual acuity is less than 6/6. Refractive error has been known to be the most common cause of impaired vision, hence, the need for lens correction [2]. Visual acuity is a measure of the spatial resolution of the visual processing system. It is tested by requiring the person whose vision is being measured to identity characters like letters or numbers from a set distance using a Snellen’s chart [2]. The distance between the person’s eyes and the test chart, is set at a sufficient distance to approximate infinity in the way the lens attempts to focus. Twenty feet or six meters is essential infinity from an optical perspective. [2] Using a Snellen’s chart, the client reads this chart from a distance of 6m with the left eye occluded first, after which he does the same, now with the right eye occluded. If the child could only see or read the top letter of the chart, his vision is 6/60. This means that, at a distance of 6m, he could see a letter that a normal eye can see at a distance of 60m. If he could see as far as the second line, his vision is 6/36, and so on. If vision was below 6/60 and the child could not even see the top letter on the Snellen’s chart, he will be asked to go nearer the chart until he is able to see it. If he saw it at two meters, then his vision will be 2/60. And if, he could only see it at one meter, his vision will be 1/60. Another method used for testing the children with poor vision less than 6/60, was to ask them, to count the fingers (CF) held up in front of their eyes by the examiner [2]. The human finger is about the same size as the top letter on the chart, and so counting fingers at six meters was about equal to 6/60 vision. Counting fingers at one meter distance, was therefore same as 1/60. If vision is below 1/60, and the child is able to detect the movement of the hand in front of his eye, a hand movement (HM) will be recorded. If the subject can’t even see HM, the final test will be to shine a light into his eye and see if he can perceive the light, this is referred to as light perception (LP). If there was LP, then test if the child can identify the direction that the light was coming from, this is termed projection of light. The light is shone from all 4 quadrants of the child’s vision. Good projection indicates that the retina and optic nerve are functioning normally, and therefore, the defect was probably opacity in the cornea, lens, and or vitreous body, and regarded as probably treatable. The measurements are usually taken by trained medical personnel, and the results documented immediately after the test. Improvements on a visual acuity less than 6/6 using spectacles may be guaranteed by a further examination using a pinhole lens [2].Visual impairment presents a major area that requires intervention, such that if detected early is amenable to treatment, both through the use of proper eyeglasses, and lifestyle modification. Some surveys have demonstrated the importance of early diagnoses of visual problems, as an essential means of minimizing and preventing severe problems in the future: in developing countries likes Nigeria, the scenario is even more worrisome. Data showed that 80% of blindness worldwide occur in developing countries and two-thirds of each case are either preventable or durable. [3] It is estimated that 2.3 billion people worldwide suffer from refractive errors. The vast majority of these people could have their sight restored by spectacles, but only 800 million people have access to eye examinations and affordable correction. Children compose about 1/3 of the majority, who cannot access or afford eye examination. Children constitute about 45% of the population of Nigeria with about 15-20% within the age of 10-18years. School children are a captive population and are relatively accessible to intervention. This facilitates easy and early assistance to any child with visual problems [3].Undetected or under corrected disorder of visual acuity are known to affect the learning abilities of school children who have difficulty to read off what is written on the blackboard [4]. This can adversely affect a child’s learning, health, education needs and socio-economic status for life. Impairment in vision, if not corrected gets worsened with time, and might result in blindness. The rising cases of visual impairment, and its’ related complications can be attributable to improper use of eyeglasses, and inadequate knowledge of its risk factors [4]. Through the process of visual acuity testing, defective school children can be identified, and necessary adjustments effected in such areas, as their sitting arrangements in the classroom, teaching methods, instructional materials in use, and health care services offered to them [4]. Lifestyle interventions such as reading with a good light source, good nutrition, proper and early treatment of ailments, reduction of exposure to smoke, have the potential to reduce the risk of visual impairment [4]. Therefore, it is pertinent, to determine the visual acuity status of school children, for early detection and treatment of visual impairment.The general objective of this study includes determining the visual acuity status of secondary school students in Nnewi, Anambra state, Nigeria. Specifically, to determine the proportion of the students with a good visual acuity of 6/6, risk factors associated with poor visual acuity and the relationship between visual acuity and academic performance.
2. Materials and Methods
- Area of study: This study was carried out in Nnewi North L.G.A., which has Nnewi as its only town. Nnewi is the second largest city in Anambra State, in South-Eastern Nigeria [5]. A metropolitan city with an estimated total population of 391,217 citizens, and a population density of 2,800/km2 [6]. It is made up of 4 villages namely: Otolo, Uruagu, Umudim, and Nnewichi [6]. The town is located east of the Niger River, and about 22 kilometers south-east of Onitsha, Anambra State, Nigeria. The city hosts a large market (Nkwo Nnewi). Nnewi is also referred to as the Japan of Africa, as it is home to many major indigenous manufacturing industries. Religion occupies a central place in the heart of Nnewi people. This accounts for the huge churches & religious practices in the city. 96% are Christians, 2% traditionalist, 0.2% Jews, 0.3% Muslims and 1.5% others [6].Nnewi also hosts a number of institutions and places of learning and healing, which include Nnamdi Azikiwe University Teaching Hospital (NAUTH) and a number of international agencies. NAUTH is in the forefront of providing excellent healthcare services to the nation. Also found within the town are a number of traditional and formal learning institutions, with a total of 51 registered secondary schools; 8 public, 43 private, 102 primary schools, and higher institutions [6].Study population: The study population consisted of students, males and females in the junior classes among the selected secondary schools in Nnewi North LGA.Study design: The study was a descriptive cross-sectional study among junior secondary school students in Nnewi.Sample size determination: The minimum sample size for the study was calculated using the formula [7],
 where n= minimum sample size, z = 99% confidence level which is 2.58 was used for the study, p = the proportion of the target population, q = 1- p, d = degree of accuracy used was = 0.04.From the literatures reviewed, p = prevalence rate of 97.47% of normal VA 6/6 among students, based on a work previously done by Okosa in Enugu State. In applying this, P= 0.97, q= 1-0.97 =0.03 Therefore,
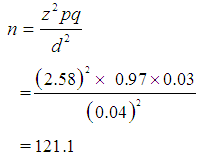 A minimum sample size for the study was 122. In compensation for errors associated with human based study, and also to compensate for attrition, a sample size of 140 was used.Sampling technique: A multi-stage sampling technique was used to select the participants for the study. In Stage 1, a sampling frame was obtained of registered secondary schools in Nnewi, from the Nnewi-North Local Government Area Education Board. Out of these schools, 4 were selected from the co-educational schools, using simple random sampling technique. In Stage 2, the sample size among the selected schools was shared out. In each selected school, the sample size allotted to each school was divided among its 3 junior classes. In stage 3, within each class, the students were selected by systematic sampling technique and the sampling interval was dependent on the total number of students in that class and the proportion of total sample allotted to it.Inclusion criteria: These included students in the junior classes of the selected secondary schools in Nnewi North L.G.A, and who were present on the days the study was conducted.Ethical considerations: Consent was obtained in writing from the principals of the selected schools. Verbal consent was also obtained from the class teachers, and the students. Ethical clearance was obtained from the Ethics Committee of NAUTH through the study supervisor.Data collection: Data for this study was collected among the selected students using a combination of self-administered and interviewer-administered questionnaires. The questionnaire was structured in four sections: Section A, determined the bio-data of the students, Section B, determined some of the risk factors that could be associated with impaired visual acuity. Section C, ascertained the relationship between impaired visual acuity & academic performance (got from the class examination records, and included students’ average grades). Section D, was a record of the visual acuity measurements of the students (as determined using the Snellen’s chart).Other study materials and measurement procedure: An alphabet Snellen’s chart was hung on a wall at a distance of 6 metres from the students in a well-lit room/ classroom, and at a height of 2 meters. Visual acuity was measured one eye at a time (monocularly) with each student standing and facing the chart, and then reading out the letters on the chart starting from the biggest one to the smallest readable letter. The eye not being measured was covered with an occluder that was held in place by the examiner. For the purpose of this study, the following operational definitions of the various visual acuities were used: Normal visual acuity = 6/6 and better; Poor/Impaired visual acuity = 6/9 and below. Data analysis: The data collected was analyzed by means of SPSS and presented in tables. The accepted level of significance is 5%.
3. Results
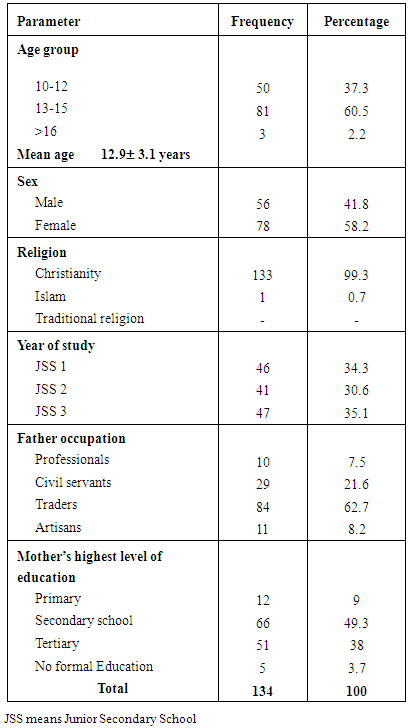
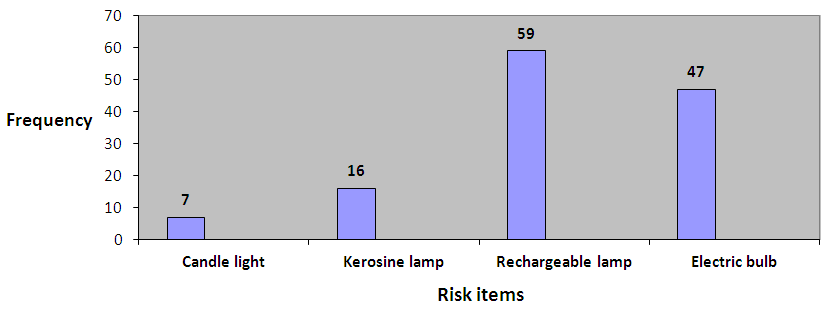
- A total of 140 semi-structured, closed-ended interviewer- and self-administered questionnaires were distributed and 136 were recovered, however only 134 were completed satisfactorily. The socio-demographic data are presented in Table 1: The mean age of the respondents was 12.9± 3.1 years. More of the respondents 78 (58.2%) were females, while 56(41.8%) were males. The predominant religion was Christianity 133 (99.3%). More of the respondents 47 (35.1%) were in Junior Secondary School level 3 (JSS3), followed by 46(34.3%) respondents in JSS1, whilst 41(30.6%) respondents were in JSS 2.
|
|
|
|
|
 | Figure 1. Type of light as risk factor to visual acuity |
 | Figure 2. Type of cooking fuel as risk factor of visual acuity |
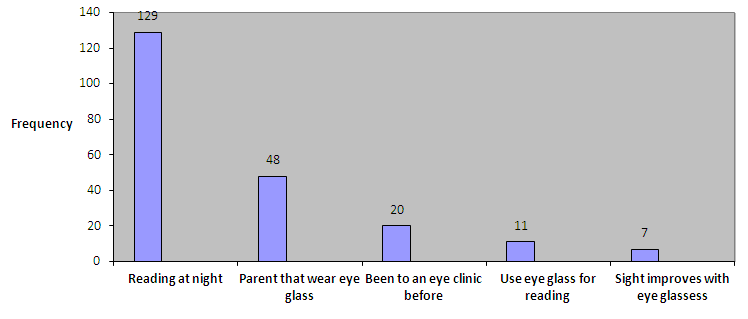 | Figure 3. Other Risk Factors of Visual Acuity |
4. Discussion
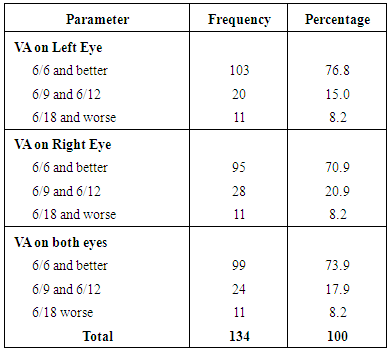
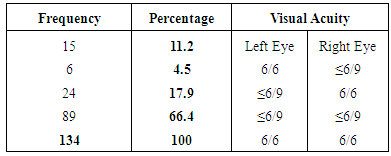
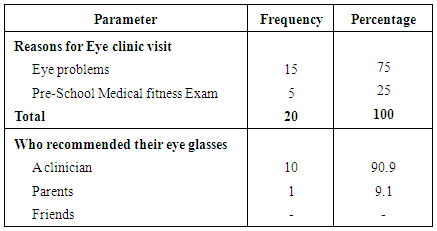
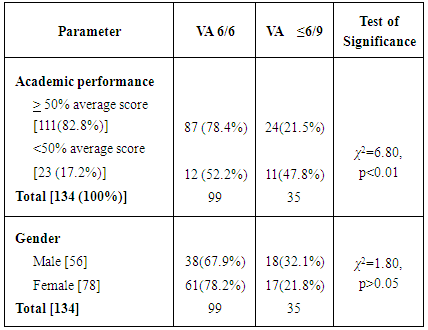
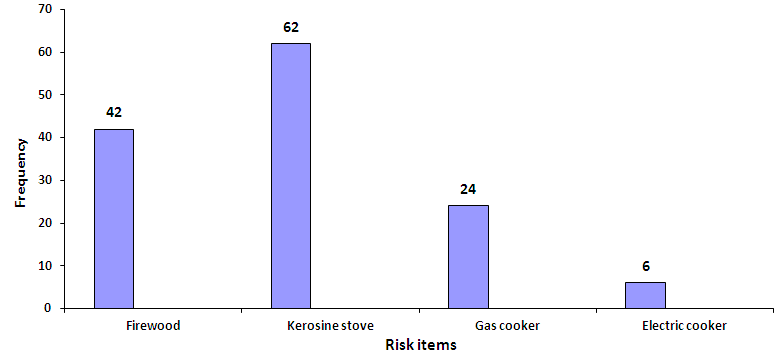
- The visual experience of a child plays a significant role in his psychological, physical and intellectual development. [8] Many of the causes of visual impairment in childhood are avoidable, either being preventable or treatable. [9] This study revealed that the prevalence of good visual acuity at 6/6 and above was 73.9%. This value is relatively low when compared to a similar cross-sectional study conducted by Chuka-Okosa in Enugu state which found 97.47% students with good vision [3]. The higher figure recorded by Chuka-Okosa et al could be attributed to the fact that VA of less than 6/18 were also classified as good in their study. On the other hand, the current study however has a similar finding with studies done by Kotingo in Rivers state and Okoro in Lagos state, where good visual acuity prevalence of 72% and 78.1% respectively were recorded [4, 10]. This could be explained by the cosmopolitan nature of the states. A study done in Ghana and another done in Tanzania, showed that 88% and 90.5% of school children respectively had good visual acuity in the range 6/6 and better [11, 12] . This could be as a result of vision screening that is routinely done in these countries [11, 12]. However study done at India [13], showed a much lower prevalence of good VA, with a value of 68.9%, this could be explained by the increasing occurrence of poor vision in the developing countries.The current study has revealed prevalence of impaired visual acuity, (VA of 6/9 and less) of 26.1%. This is also in keeping with the afore-mentioned studies by Kotingo and Okoro [4, 10], with a percentage of 28.3 and 22.4 respectively. In contrast, Okosa [3] in Enugu state, found this to be low with a value of 2.53%. Studies by Ayanniyi [20] in Ilorin and Ajaiyeoba [22] in Osun state, south west, prevalence of low vision was markedly low, 1.9% and 1.4% respectively. This could be as a result of consideration of persons with VA of less than 6/18 as good vision. In Gabon [16], the prevalence of low vision is high at 16.2% and this could be due to the developing nature of the country.With regards to the risk factors identified that can impair visual acuity, which ranges from: type of light used for reading, familial disposition, types of fuel used for cooking. The reading culture of the students at night was high, with 129(96.3%) of them engaging in this. Amongst this number, 106(82.2%) used good light (rechargeable lantern and electric bulb), while (16(12.4%) and 7(5.4%) used poor sources of light from kerosene lamps, and candles respectively. Of the 35 respondents with at least a visual impairment in one or both eyes, a careful evaluation revealed that the use of kerosene lamps for reading ranked most; 40% (14 students) as the possible etiology of their visual impairment, followed by candles at 20% (7 students). A combined 10 accounting for 28.6% identified both reading with candle and cooking with firewood as possible etiologies of their visual impairment. In India, it was found that diet and physical factors like adequate light present in study room, had no role to play in visual acuity, this was according to a study by Kakali [13]. Only 4 students (11.4%) agreed to their parent wearing eye glasses for eye impairment. There was a translational relationship between visual impairment and academic performance as evidenced by the current study. Out of 134 students whose visual acuity were tested, 111(82.8%) had academic performance greater than 50%, whilst 23(17.2%) have academic performance below 50%. Among students with normal VA, 87.9% had satisfactory performance, while among those with a poor VA, only 68.6% had satisfactory performance (p <0.05). This was also found by Kotingo [10] in River State, where he revealed that students with visual impairment have poor academic performance than students with normal vision, according to him, 57.58% of students with visual impairment had scores below 50%. In Brazil, Toledo [17] confirmed this association in his study, with 89.5% of his students with normal VA had grades above 50%, while only 75% of his students with poor VA had grades above 50%.The difference in ratio of impaired visual acuity between males and female as analyzed by the present study revealed that, out of 134 students, 78 were girls (58.2%) while 56 (41.8%) were boys. Of the 78 girls, 17(21.8%) of them have impaired visual acuity compared to 18 boys (32.1%) out of 56 boys with visual impairment. However, (P = > 0.05), showing that there is no statistical evidence that boys have a higher frequency of presenting with visual impairment than girls. This study is in keeping with a similar study done by Ibeinmo [18] in Bayelsa state, which showed that both sexes were almost equally affected. In Edo state, Isara [19] declared in his study that there was no statistically significant association between VA and sex. However, study done by Entekume et al [20] in the six geopolitical zones in Nigeria revealed that the prevalence of functional low vision was slightly higher in males than in females (3.7% versus 3.35%). On the contrary, studies outside Nigeria have shown females to have poorer vision than males. In Tanzania, Kingo [12] attested the prevalence of low vision in females (68%) to be statistically higher than in males (32%). In Iran, Akbar [21] stated that there’s a statistical difference between genders, saying that girls are more likely to have a visual acuity of 6/12 or worse. Also, in Brazil, Gianini [22] revealed that there is a statistically significant lower prevalence of poor vision in males (11.5%) compared to females. Reason for this could not be explained. A further evaluation revealed that the rate of detection of visual impairment is really low, as more than half of the visually impaired 20(57.1%) have never been to an eye clinic and more worrisome is that only 11(31.4%) wear glasses compared to the 24(68.6%). This percentage is enormous and efforts should be made to see it corrected.
5. Conclusions
- This study showed that the prevalence of impaired visual acuity amongst Junior Secondary School students in Nnewi North L.G.A is high, and this doesn’t spell well as these school children are in their captive years. As this study has shown, visual impairment has a translational relationship with academic performance as it interferes with learning abilities of school children who have difficulty to read off what is written on the black board. In adverse, this affects a child’s learning, health, educational needs and socio-economic status for life. Much as the reading culture/ behaviors of the students is laudable, emphasis should be made on the type of light source they use. This is due to the facts, that amongst students with visual impairments, reading at night with kerosene lamps and candles ranked most, as the probable etiology of their visual impairment. Other risk factors outlined are cooking with firewood and the non-modifiable familial disposition. Health education will play a pivotal role in reducing the modifiable risk factors. More so, the identification rate of these eye impairments is quite low, in the face of a high visual impairment prevalence, this will culminate in the deterioration of academic standards and high failure in achieving academic potentials for the students. As was found in this study, only a few students underwent a pre-school medical fitness examination. This is worrisome as pre-school medical examination should be a pre-requisite for secondary school admission, so that eye-impairments would be detected early and appropriate measures would be undertaken for the school child.
6. Recommendations
- 1. The researchers intend to re-visit the different schools used for this study, and meet with the school authorities with a view to discussing the result of this work and the need for further examination.2. The government should ensure that some foods like salt are fortified with vitamin A.3. The students should be encouraged to undergo a pre-admission and periodic medical fitness examination, which will include visual acuity, color vision and hearing tests. This will ensure proper placement of the students in the classroom in terms of sitting positions and will also ensure that the required attention is given to those students who have a defect. 4. An appeal be made to the government, to uphold the goals of the vision 2020 agenda tagged “Right to sight” for the elimination of avoidable visual problems, especially blindness.5. The school authorities should be encouraged to organize a health care program sessions in their schools, inviting the medical doctors to screen the students thoroughly. Positive responders will either be effectively treated or appropriately referred.
ACKNOWLEDGEMENTS
- We are very grateful to all the secondary school students who participated in this research project. We also thank the principals and teachers for their permission and co- operation, during the period of this work.