-
Paper Information
- Paper Submission
-
Journal Information
- About This Journal
- Editorial Board
- Current Issue
- Archive
- Author Guidelines
- Contact Us
American Journal of Medicine and Medical Sciences
p-ISSN: 2165-901X e-ISSN: 2165-9036
2016; 6(5): 145-151
doi:10.5923/j.ajmms.20160605.01

Urine Osmolality in Adults Attending a General out-Patient Clinic: Clinical Implications
 Abstract
 Reference
 Full-Text PDF
 Full-text HTML
Ernest Ndukaife Anyabolu1, 2, 3, Innocent Ijezie Chukwuonye2, 4
1Department of Internal Medicine, Imo State University Teaching Hospital, Orlu, Nigeria
2Department of Internal Medicine, Federal Medical Centre, Owerri, Nigeria
3Chukwuemeka Odumegwu Ojukwu University Teaching Hospital, Awka, Nigeria
4Department of Internal Medicine, Federal Medical Centre, Umuahia, Nigeria
Correspondence to: Ernest Ndukaife Anyabolu, Department of Internal Medicine, Imo State University Teaching Hospital, Orlu, Nigeria.
| Email: |  |
Copyright © 2016 Scientific & Academic Publishing. All Rights Reserved.
This work is licensed under the Creative Commons Attribution International License (CC BY).
http://creativecommons.org/licenses/by/4.0/

Background and objectives: Significant urine osmolality changes are usually found in many environmental, physiologic and disease states. However, urine osmolality is observed to vary over a wide range of values. The aim of this study was to determine urine osmolality and factors that influence dilute and concentrated urine in adults attending the general out-patient clinic of Federal Medical Centre (FMC), Owerri, Southeast Nigeria. Methodology: This was a cross-sectional study conducted in FMC, Owerri, Nigeria. Demographic and anthropometric data were obtained. Urine osmolality and other relevant investigations were performed. Normal urine osmolality was defined as 24-hour urine osmolality (24HUOsm) 300 - 750mOsm/kgH2O, dilute urine 24HUOsm <300mOsm/kgH2O and concentrated urine 24HUOsm >750mOsm/kgH2O. The association of variables with dilute and concentrated urine was determined. Results: The mean 24HUOsm was 160 ± 133mOsm/kgH2O and spot urine osmolality (SUOsm) 334±204mOsm/kgH2O. The range of values observed for SUOsm (30 - 855mOsm/kgH2O) and 24HUOsm (29 - 628mOsm/kgH2O) was wide. Normal urine osmolality was observed in 14(10.3%) and dilute urine in 122(89.7%) of the subjects. None of the subjects has concentrated urine. Body mass index and serum low density lipoprotein cholesterol (LDL) were significantly associated with dilute urine. There was correlation between 24HUOsm and hemoglobin, spot urine protein, SUOsm, 24-hour urine volume (24HUV), as well as spot urine creatinine osmolality ratio (SUCOR). Low SUCOR, low 24HUV and low serum triglyceride predicted dilute urine. Conclusions: The prevalence of dilute urine (89.7%) was high but there was absence of concentrated urine in the study subjects. Abnormalities of urine volume, serum lipids and weight changes were common in subjects with dilute urine. There is need for clinicians to routinely conduct urine osmolality assessment and to further search for abnormalities of urine volume, serum lipids and weight changes in adults with dilute urine attending the general out-patient clinics.
Keywords: Urine osmolality, Dilute and concentrated urine, Body mass index, Serum lipids, General out patients, Associated factors, Nigeria
Cite this paper: Ernest Ndukaife Anyabolu, Innocent Ijezie Chukwuonye, Urine Osmolality in Adults Attending a General out-Patient Clinic: Clinical Implications, American Journal of Medicine and Medical Sciences, Vol. 6 No. 5, 2016, pp. 145-151. doi: 10.5923/j.ajmms.20160605.01.
1. Introduction
- Specific gravity, a ratio of weight of urine to an equal volume of water, is often employed in determining the capability of the kidneys to concentrate urine. Recently, the utility of urine osmolality in clinical practice, has superseded that of specific gravity, principally due to the high reliability of the former. [1] Nonetheless, urine osmolality is not routinely assessed in subjects attending the general out-patients clinics in Nigeria. In different individuals in normal healthy state, urine osmolality varies over a wide range of values. Many factors influence this variability. They include the levels of secretion of vasopressin, tendency to concentrate urine, thirst threshold, among others. [2-5]Abnormal renal tubular function may influence urine osmolality. [2] Vasopressin and aquaporin receptors in the collecting tubules modulate urine osmolality in response to plasma osmolality in normal states. [6]The body maintains high water conservation by the renal ability to concentrate urine in the course of excreting solute waste materials. [3, 7] Exogenous substances and endogenous waste products which determine urine osmolality include urea, protein, glucose and water. [8] Some of these exogenous substances could derive from environmental pollutants such as arsenic. [9, 10]Poor renal outcome has been associated with low urine volume, low water intake and a high serum copeptin as shown in a study. [3, 11] A study also demonstrated that baseline urine osmolality was useful in monitoring renal patients. [3, 12] Progression of kidney disease is influenced by urine osmolality. [3] Dilute urine is often associated with inability of the kidney to concentrate urine during early stages of chronic kidney disease.Age, female gender, race, BMI, hypertension, water intake and plasma osmolality were documented factors associated with dilute urine. [13] Studies were sparse on urine osmolality and factors that influence dilute urine or concentrated urine in the general population in Sub-Saharan Africa. This paucity of studies informed our decision to carry out this study in patients attending the general out-patient clinic of Federal Medical Centre (FMC), Owerri, Nigeria. This study was conducted in this population because the prevalence of kidney disease is high, here, in Southeast Nigeria. [14] The study will help in identification of patients with dilute and concentrated urine and the factors which influence dilute and concentrated urine in the general out-patient clinics with a view to effecting early interventions to prevent or whittle down adverse outcomes, especially those related to renal disease and serum sodium abnormalities.
2. Materials and Methods
- This was a cross-sectional study, comprising of 136 subjects, consecutively recruited from the general out-patients clinic of FMC, Owerri, Southeast Nigeria. It was a three-month study conducted in 2011. Inclusion criterion was subjects within the age range of 16-65 years. Subjects who had known renal, adrenal, pituitary, or terminal illness, and those who were pregnant were excluded from the study. Informed consent was obtained from all the subjects who participated in this study. The Ethical Research Committee of the hospital approved the study. Demographic and anthropometric data were obtained from each of the subjects with the aid of a questionnaire. The questionnaire was administered by our laboratory technicians, who collected all the relevant data. It was not, however, pre-tested, as it was a hospital-based study; there was no difficulty encountered in the process of collecting the data. The objective for the study was explained to the subjects in English language, and in our local language for those that could not communicate in the former. The gender, age, place of domicile and origin were obtained. Height was taken with the subject in light dress, without shoes, cap or head gear, and recorded in meter (m). Weight was measured using a weighing scale and recorded in kilogram (kg). BMI was taken as the ratio of weight/height2 (km/m2). Clear instructions were given to all the subjects on how to collect 24-hour urine sample. A day-time random spot urine sample and blood samples were collected at the end of the 24-hour urine sample collection. [15]From the random spot urine samples collected, spot urine protein (SUP), spot urine creatinine (SUCr) and spot urine osmolality (SUOsm) were performed. Also from the 24-hour urine samples collected, 24-hour urine protein (24HUP), 24-hour urine creatinine (24HUCr) and 24-hour urine osmolality (24HUOsm) were performed. Hemoglobin (Hb) and serum creatinine were performed on the blood samples collected. Other tests done from the blood samples were HIV screening test, fasting serum lipid profile (FSLP) (total cholesterol, triglyceride, high density lipoprotein cholesterol (HDL), low density lipoprotein cholesterol (LDL). Osmolality was determined by freezing point depression method using Precision Osmette 5002 osmometer, creatinine by modified Jeff’s method and protein by photometric method. Spot urine creatinine/ osmolality ratio (SUCOR), and creatinine clearance (ClCr) were determined. [15]Statistical Analysis: SPSS version 17.0 (SPSS Int. Chicago, II, USA) was used in analyzing the data. The distribution and characterization of clinical and laboratory features among subjects with different levels of 24HUOsm were analyzed using cross-tabulation, while statistical significance of association of these variables with 24HUOsm changes was determined using student t-test. Multivariate linear regression analyses were used to determine the strength of variables to predict dilute urine and concentrated urine. P≤0.05 was taken as statistically significant. Definition of terms: There is no actual reference range for urine osmolality as interpretation depends on whether the urine is appropriately concentrated or dilute for the clinical state of the patient at the time of assessing urine osmolality. Some researchers have suggested variable values for dilute urine and concentrated urine. We have adopted the values by Yeh et al [13] derived from their study in which dilute urine was defined by urine osmolality and urine creatinine. Similarly, they defined concentrated urine by urine osmolality and urine creatinine. From these the following terms were used: [13]Normal urine osmolality: 24HUOsm 300 - 750mOsm/kgH2ODilute urine: 24HUOsm <300mOsm/kgH2O Concentrated urine: 24HUOsm >750mOsm/kgH2O
3. Results
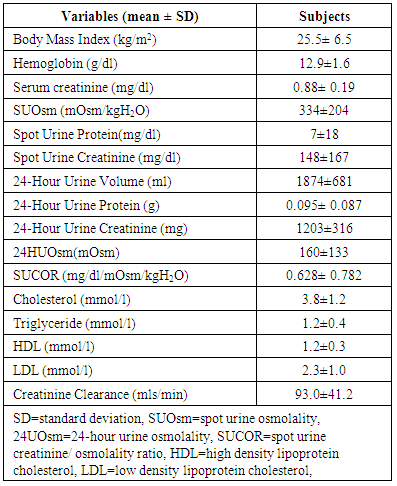
- One hundred and thirty-six subjects were studied. Males were 38(27.9%) and females 98 (72.1%). The mean age of the subjects was 39±12 years. The mean 24HUOsm was 160±133mOsm/kgH2O. The minimum 24HUOsm value obtained was 29mOsm/kgH2O, maximum value 628mOsm/kgH2O, and range 599mOsm/kgH2O. Similarly, for SUOsm, minimum value obtained was 30mOsm/kgH2O, maximum value 855mOsm/kgH2O and range 825mOsm/kgH2O. The mean values of other variables are shown in Table 1. Dilute urine was observed in 122(89.7%) of the subjects and normal urine osmolality in 14(10.3%). None of the subjects has concentrated urine.
|
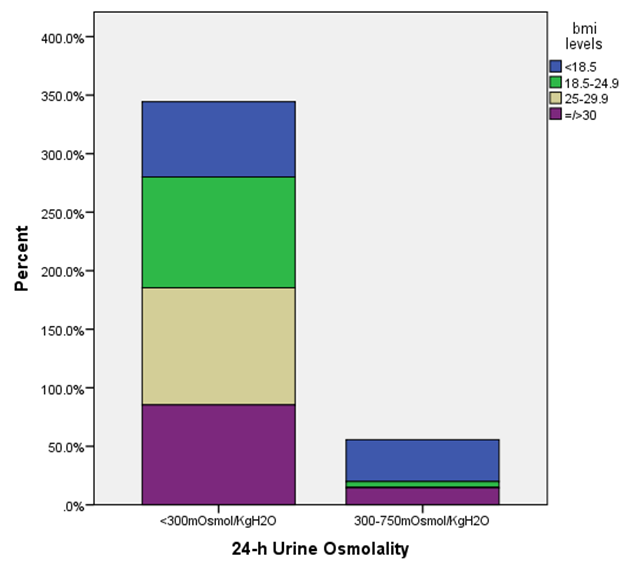 | Figure 1. Relationship between 24-hour urine osmolality and body mass index in study subjects (n=136) |
|
|
|
4. Discussion
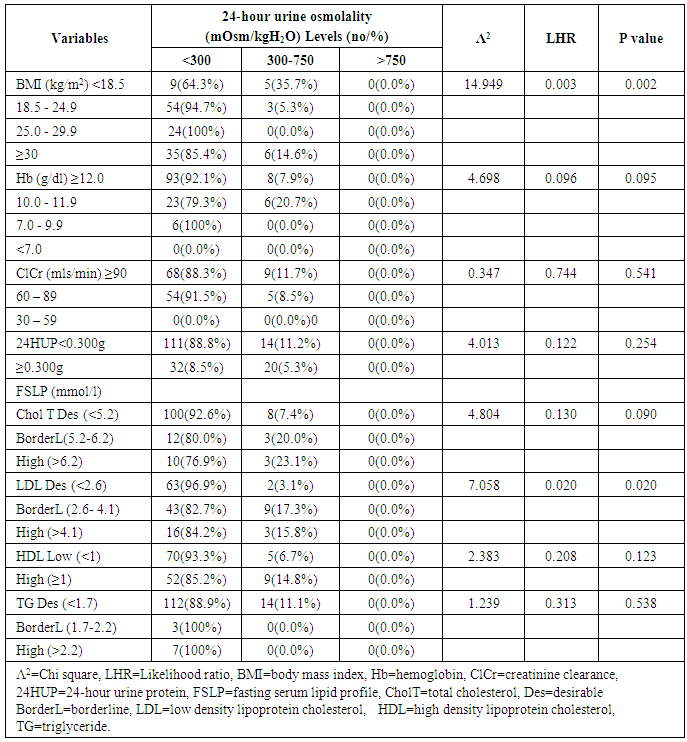
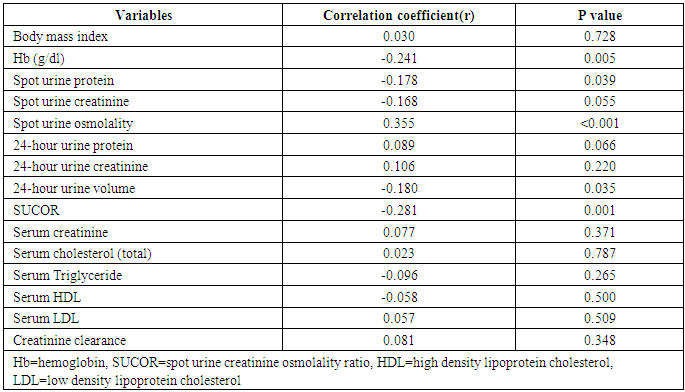
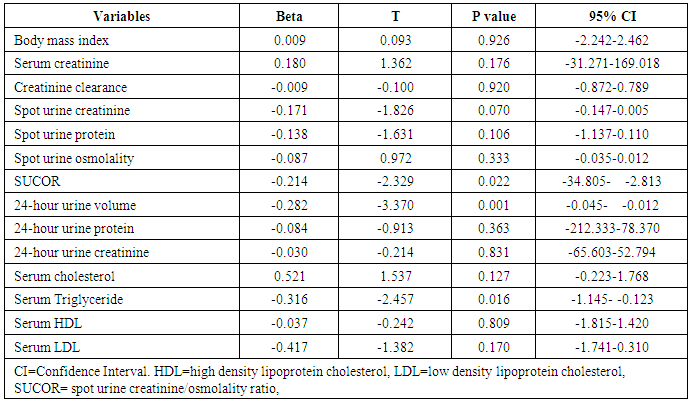
- This study showed that the prevalence of dilute urine was 89.7% while concentrated urine was absent among subjects attending the general out-patient clinic in FMC, Owerri, Southeast Nigeria. The range of values of both SUOsm (825mOsm/kgH2O) and 24HUOsm (599mOsm/kgH2O) was wide. Factors significantly associated with dilute urine were BMI, p=0.002 and serum LDL, p=0.020. Significant correlation was found between 24HUOsm and hemoglobin, SUP, SUOsm, 24HUV, SUCOR. Low SUCOR, low 24HUV and low serum triglyceride were predictors of dilute urine. Our study showed a high prevalence of dilute urine, 89.7%, compared to 8.1% reported by Yeh et al. [13] This observed difference might be attributed to different study designs used in the two studies. Our study population was very much smaller than theirs. Their study was carried out in a general population in USA, whereas ours was in an out-patient clinic in Nigeria. This very high prevalence of dilute urine found in our study seemingly exerts that subjects attending out-patients clinic were apt to progress slowly were they chronic renal disease subjects. This derived from a study which demonstrated that baseline urine osmolality could impact negatively on kidney disease progression. [3]This study demonstrated that SUOsm and 24HUOsm vary over a wide range of values, similar to the observations made in a study. [16]We found, in our study, that there was absence of concentrated urine in the study population, in sharp contrast to a prevalence of 3.1% shown in one study. [13] This could be explained by differences in background climate, race and levels of industrialization of the study group. [13]This study demonstrated that BMI has significant association with dilute urine. This observation is similar to that in one study. [13] We noted that the prevalence of dilute urine was highest among patients with normal BMI, but decreased with underweight, as well as with obesity.Our study observed that serum LDL has significant association with dilute urine. We demonstrated that the prevalence of dilute urine declined as serum LDL increased. From literature search, we could not find any study that evaluated the potential association of dilute urine and serum LDL.We did not find any significant association between dilute urine and anemia, ClCr, 24HUP, serum cholesterol, serum HDL, serum triglyceride. Nonetheless, this study showed that ClCr has no correlation with 24HUOsm. One study demonstrated high correlation between urine osmolality and ClCr, (r = 0.60, p < 0.01), [3] that increased hydration with resultant dilute urine which lowers vasopressin secretion significantly lowers ClCr. [3, 17, 18, 19] Our study did not explore the impact of concentrated urine on these parameters [3] but noted that ClCr has no significant association with dilute urine, contrary to the report which found that the prevalence of dilute urine would decline as ClCr declined. [3] Significant correlation was found between 24HUOsm and hemoglobin, SUP, SUOsm, 24HUV, SUCOR. However, these correlation coefficient values were poor.This study showed that low SUCOR was a predictor of dilute. Literature search did not reveal any study that assessed the influence of dilute urine on SUCOR. It was observed in this study that low 24HUV was a predictor of dilute urine. This means that passage of small urine volume is a risk factor for dilute urine. However, this differs from a study which observed high urine volume in dilute urine, [20] but agrees with another that showed low urine volume in dilute urine. [21]Low serum triglyceride was found to be a predictor of dilute urine in this study. We could not find, from literature search, any report that studied the effects of serum triglyceride on dilute urine.
5. Conclusions
- The prevalence of dilute urine of 89.7% was high but there was absence of concentrated urine among adults attending the out-patients clinic. Abnormalities of urine volume, serum lipids and weight changes were common in subjects with dilute urine. There is need for clinicians to routinely conduct urine osmolality assessment and to further search for abnormalities of urine volume, serum lipids and weight changes in adults with dilute urine attending the general out-patient clinics.Limitations: Assessment of plasma osmolality and urine sodium would have contributed in categorizing dilute urine. A larger sample size would have been better as it would have made room for evaluating the potential predictors of concentrated urine. Assessment of vasopressin or copeptin in relation to urine osmolality would have contributed to making the study more elaborate.What is already known about this topic:A. Urine osmolality is not commonly evaluated in routine clinical practice;B. Many environmental, physiologic and disease conditions affect urine osmolality,C. Some associated factors of dilute urine and concentrated urine have been identified; concentrated urine is associated with progression of chronic kidney disease.What this study adds to knowledge:A. The prevalence of dilute urine is high while concentrated urine is absent in patients attending the out-patient clinic in Owerri, Southeast Nigeria;B. The prevalence of dilute urine declines with underweight and obesity. In addition, the prevalence of dilute urine declines as serum LDL increases in these subjects.C. Low SUCOR, low 24HUV and low serum triglyceride are predictors of dilute urine in these subjects, and should be evaluated in the general out patients with dilute urine.