-
Paper Information
- Next Paper
- Previous Paper
- Paper Submission
-
Journal Information
- About This Journal
- Editorial Board
- Current Issue
- Archive
- Author Guidelines
- Contact Us
American Journal of Medicine and Medical Sciences
p-ISSN: 2165-901X e-ISSN: 2165-9036
2016; 6(3): 98-116
doi:10.5923/j.ajmms.20160603.07

Histological and Immunohistochemical Study on the Possible Protective Effect of Olive Leaves Extract on Mitochondrial Changes of the Proximal Convoluted Tubule in Diabetic Male Albino Rats
 Abstract
 Reference
 Full-Text PDF
 Full-text HTML
Mervat Shaker Mehanna, Fatma Sayed Abdel Aal, Dina Allam Abdel Maksod, Marwa Kamal Taha
Histology Department, Faculty of Medicine (for girls), Al-Azhar University, Egypt
Correspondence to: Fatma Sayed Abdel Aal, Histology Department, Faculty of Medicine (for girls), Al-Azhar University, Egypt.
| Email: |  |
Copyright © 2016 Scientific & Academic Publishing. All Rights Reserved.
This work is licensed under the Creative Commons Attribution International License (CC BY).
http://creativecommons.org/licenses/by/4.0/

Damaged or dysfunctional mitochondria by hyperglycemia generate excessive reactive oxygen species (ROS) such as superoxide anion, O−2 and hydrogen peroxide, H2O2- which is the primary initiating all other pathways of tissue damage. This study aims to investigate the histologicalchanges in the mitochondria of the proximal convoluted tubules of the kidney in diabetic and treated adult male albino rat with insulin, olive leave extract (OLE), and combined therapy of both of them.In this workfive groups of rats (n=6 in each group) was used.GI (Control group): received sodium citrate buffer pH4.5 once. GII (Diabetic group): the animal received STZsingle dose. GIII (Diabetic, insulin treated group): diabetic rats of this group were daily treated with insulin for 9 weeks. GIV (Diabetic, aqueous OLE treated group): diabetic rats of this group were daily treated with aqueous OLE for 9 weeks. GV (Diabetic, insulin and aqueous OLE treated group): diabetic rats of this group were daily treated with insulin and aqueous OLE for 9 weeks: Fasting plasma glucose level, serum creatinine, and blood urea nitrogen were evaluated in blood samples from all rats of all groups and statistically analysed. At the end of the experiment both kidney processed for light and electron microscopic examination. The results revealed, examination of the proximal convoluted tubules of GII demonstrated that the cells lining convoluted tubules revealed thick basement membranes, disorganization of basal infolding, and mitochondrial changes. The area% of positive Bax immunoreactions was significantly increased in GII as compared with GI. These changes were relatively reduced in treated groups. We concolude that combined therapy of insulin and OLE provide better glycaemic control and protection for the ultrastructure of PCT with better kidney function glycemic control and protection for the ultrastructure of PCT with better kidney function tests.
Keywords: Diabetes mellitus, Structure kidney, Mitochondria, Olive leave extract
Cite this paper: Mervat Shaker Mehanna, Fatma Sayed Abdel Aal, Dina Allam Abdel Maksod, Marwa Kamal Taha, Histological and Immunohistochemical Study on the Possible Protective Effect of Olive Leaves Extract on Mitochondrial Changes of the Proximal Convoluted Tubule in Diabetic Male Albino Rats, American Journal of Medicine and Medical Sciences, Vol. 6 No. 3, 2016, pp. 98-116. doi: 10.5923/j.ajmms.20160603.07.
1. Introduction
- Diabetes mellitus (DM) is a metabolic disorder which arises from complex interactions between multiple genetic and environmental or lifestyle factors. This chronic disease is characterized by the presence of hyperglycemia due to defective insulin secretion, insulin receptors, or both. The two major forms of the diabetic syndrome are, type I diabetes (TID), and, type II diabetes (TIID). The majorities (90% of patients) with diabetes have TIID [1].Diabetic nephropathy (DN) develops in a large number of TID and TIID patients after a variable latency period [2]. The pathogenesis of DN is clearly multi-factorial as several genes, proteins and environmental factors are likely to contribute to the onset of the disease [3]. Previously, DN was described as a glomerulopathy associated with diffuse or nodular glomerulosclerosis, although less than one-third of diabetic patients have this type of glomerulopathy, while, tubular functional and structural changes correlate better with DN progression, and may be the key to development of kidney dysfunction in diabetes [4]; [5].Damaged or dysfunctional mitochondria by hyperglycemia generate excessive reactive oxygen species (ROS)-e.g. superoxide anion, O−2 andhydrogen peroxide, H2O2- which is the primary initiating event that activates all other pathways of tissue damage [6] Interestingly, according to one estimate the steady state concentration of O2− in the mitochondrial matrix is about 5 to 10 fold higher than that in the cytosol or nucleus [7]. [8]; [9] added that ROS nowadays believed to be second messenger supported by the important role they mediate in several biologic responses such as proliferation, extracellular matrix deposition (ECM) deposition, and apoptosis. Hyperglycemia provokes overproduction of superoxide and ROS, which contribute to impair insulin signaling, β-cell failure, and other pathologies associated with diabetes [10]. Olive tree leaves have been widely used in traditional remedies in European and Mediterranean countries. They have been used in the human diet as extracts, herbal teas, and powder. They contain several potent bioactive compounds that may have antioxidant, antihypertensive, anti-inflammatory, hypoglycaemic, and hypocholestremic properties [11].[12] suggested that hypoglycaemic effect of olive leave is patented by its antioxidant property supported by the fact that treatment with crude olive leave protects the proteins of antioxidant enzymes from non-enzymatic glycosylation and peroxidation via neutralization of free radicals and it may even enhance their synthesis evidenced by the increase in antioxidant enzyme activity, as well as significant improvement in the level of other antioxidants such as glutathione, β-carotene and vitamin E and C. The attention has been recently drawn towards the oleanolic acid component of olive leaves, oleanolic acid believed to increase energy expenditure via activation of mitochondrial function thus decreasing the incidence of obesity and insulin resistance as well as induce production of glucagon like peptide-1 that in turn increases insulin secretion and β-cell regeneration [13].
2. Material and Methods
- (I) AnimalsThirty adult male Rattus norvogicus albino rats weighting (150-200 GM) was used in the present study. The experimental animals were handled according to the guidelines and ethics of animal protocol of the faculty of Medicine, Al-Azhar University, Cairo, Egypt. They were kept individually in well ventilated cages, at room temperature, and 12hours light/dark cycle with strict care and hygienic measures and free access to water and commercial rat food in addition to bread and vegetables as carrot and lettuce, in the animal house of the Research Institute of Ophthalmology.(II) Chemicalsa) Streptozotocin was obtained in the form of white powder from Sigma Chemicals Company, St. Louis, Mo, USA. Immediately before use, STZ was dissolved in 10 mm sodium citrate buffer, pH 4-4.5, made isotonic by the addition of an appropriate volume of 0.25 M NaCl [14]. b) Drug: insulin treatment was used in the form of neutral protamine hagedon (NPH) (Novo Nordisk, Bagesvaerd, Denmark) insulin 5 U/day subcutaneously, 1 U being applied at 13O’clock, and the remaining 4 U at 19O’clock, in order to keep the glycaemic control of these groups as close as possible to the normoglycaemia (from 60 to 150 mg/dL) throughout the 24hours day [15].c) Olive leaves extract: In the present study leaves of the olive tree; Olea europaea L., Oleaceae, (variety Manzanillo cultivar) were collected in October 2013, from the garden of the faculty of Agriculture, Ain-Shams University, Egypt. Preparation of extract:For each freshly prepared leaf extract, 100 gm of fine powdered leaves were dissolved in 500 ml distilled water [16]. The mixture was left for 24hours with a magnetic stirrer at room temperature. The next day the mixture was strained out in a fine sieve, followed by filtration through filter paper (wattman-5), the crude extract was then evaporated at 400C and the aqueous reparation of the residue was kept in the refrigerator 40Cuntil used [17]; [18]. The concentrated leaf extract of each plant was then given orally by gastric gavage in a dose of (200 mg/kg body weight) [18].(III) Group design The animals were left two weeks for adaptation prior to the experiment [19], and then they were divided into five groups, six animals each: GI: (Control group): received a corresponding volume of sodium citrate buffer pH 4.5 once [19] in a dose of (1 mL/kg) I.P. [20].GII: (Diabetic group): the animal received STZ once in a dose of 55mg/kg I.P.to induces diabetes.GIII: (Diabetic, insulin treated group): the animal received STZ once in a dose of 55 mg/kg I.P.to induce diabetes and treated with insulin only in a dose of 5 U/day.GIV: (Diabetic, aqueous olive leave extract treated group): the animal received STZ once in a dose of 55 mg/kg I.P.to induce diabetes and treated with aqueous OLE only in a dose of 200mg/kg/day by gastric gavage.GV: (Diabetic, insulin and aqueous OLE treated group): the animal received STZ once in a dose of 55 mg/kg I.P.to induce diabetes sand treated with insulin in a dose of 5 U/day and aqueous OLE in a dose of 200mg/kg/day by gastric gavage.The duration of the present study was 12 weeks, 3 weeks till diabetic nephropathy develops, followed by 9 weeks of treatment with insulin, aqueous OLE, and combined therapy of both of them.(IV) Serological studyFor standardization of the results the animals were fasted 16 hours [21] before collecting blood samples, they were gently handled; to minimize excitation which might affect plasma glucose level; under light ether anaesthesia, blood samples were collected from the retro-orbital venous sinus using glass capillary [22]. FBS level and serum creatinine and blood urea nitrogen were measured just before administration of STZ, after the 3rd week [23], and at the end of the experiment (12th week) of treatment. At the end of the 12th week, after 16 hours fast, the rats of all groups were anaesthetized via ether inhalation, the abdomen was opened by median incision and both kidneys were carefully dissected out and divided into two parts; one was processed for light and the other for electron microscopic examination [24].(V) Histological study1. Light microscopic study: The specimen was fixed in 10% formalin for 2 days and processed to prepare a 5µm thick paraffin sections for stained with periodic acid Schiff (PAS) stain [25].2. Immunohistochemical study: used for detection of Bax expression in PCT cells of the kidney tissue Bax is a cytosolic protein [26] that controls cell death. Upon apoptosis induction, Bax inserts into the outer membrane forming supramolecular opening resulting in disruption of mitochondria with the subsequent release of cytochrome c [27]. Cytochrome c release in turn activates casp-9 and casp3 [28]. Immunohistochemistry was performed at Cancer Institute-Cairo University. Brown cytoplasmic staining was scored as a positive reaction.3. Electron microscope study the specimens (1x1mm) were immediately fixed in5%glutaraldehyde in0.1M sodium cacodylate buffer, at 0-4°C and pH7.3. The specimens were washed off for 1.5 hour with 3 changes of the same buffer and then fixed in 1% Osmium tetra oxide in the same cacodylate buffer for 2 hours. The semi thin sections stained with toluidine blue. The ultrathin sections were stained with uranyl acetate [29] for 30 min. followed by lead citrate [30] for 15 minute, ultrathin sections were examined under a JEOL 100s transmission electron microscope at 60 kV accelerating voltage, at Histology Department, Faculty of Medicine for Girls, Al-Azhar University.Quantitative morphometric study: Morphometric measures were carried out at the pathology department, Faculty of Dentistry, Cairo University. Bax stained sections were examined for area percent of Bax +ve cells. PAS stained sections were examined for area percent of tubular basement membrane (TBM) thickness of the standard measuring frame in six non-overlapping high power field readings from randomly chosen five animals per group, using Leica Qwin plus analyser computer system that is calibrated automatically to convert the measurement unit (pixels) into the actual micrometre unit. Mean value and standard deviation were obtained from each specimen for statistical analysis.Statistical analysis:Data was statistically analysed using statistical package for social science (SPSS), Version 21. Quantitative data results were expressed as mean ± standard error (SE) and mean standard deviation (SD). The different results were analysed statistically using ANOVA (Analysis of Variance) for comparison of quantitative data of more than two groups. P-value: is significant if < 0.01.
3. Results
- Histological result:Light microscopic ExaminationControl group (Group I): Light microscopic Examination of the sections from a control adult male albino rat (GI) stained with periodic acid Schiff (PAS) stain revealed positive (+ve) reaction in the apical brush border of proximal convoluted tubule and the basement membrane surrounding the renal tubules, renal corpuscles as well as glomerular capillaries (fig. 1-A). Toluidine blue stained semithin section showed the normal architecture of the renal cortex; the proximal convoluted tubules lined by cubical epithelium with apical brush border giving the lumen a fuzz-filled appearance; the cytoplasm contained basal rounded vesicular nuclei with prominent nucleoli and basal striation. The Distal convoluted tubules lined by cubical epithelium and the loop of Helen lined with simple squamous epithelium with its nuclei bulging into the lumen (figure 2-A).Diabetic group (Group II):Light microscopic Examination of the periodic acid Schiff (PAS) stained sections from this group revealed increased PAS positive (+ve) reaction. Some cells of proximal convoluted tubule showed focal interruption of the apical brush border and cytoplasmic vacuoles were also noticed. Some tubules appeared dilated with partial tubular epithelial cell destruction as well as PAS +ve material. The tubular basement membrane showed thickening and even interruption. (Fig.1-B).Toluidine blue stained sections showed the proximal convoluted tubule lined by cubical epithelium with apical brush border appeared to be preserved in some tubules; while interrupted in others. Basal striations could not be demonstrated as compared to control groups. Some cells had deeply stained nuclei, while others showed vacuolation of cytoplasm. Some of the PCT showed overcrowding of cells with subsequent narrowing of the lumen, such changes were absent in control groups. (Fig.2-B).Diabetic group treated with insulin (Group III):Examination of the periodic acid Schiff (PAS) of the kidney stained sections from diabetic animals treated with insulin revealed positive (+ve) reaction appeared in the renal corpuscle, proximal convoluted tubules and distal convoluted tubules. The tubular basement membrane showed relative thickening as compared to control, and diabetic groups. (Fig.1-C). Toluidine blue stained sections showed some cells of the renal tubules contained basal rounded vesicular nuclei others showed deeply stained nuclei. Less vacuolation of cytoplasm as compared to diabetic group. No dilated tubules, areas of epithelial erosion, or degenerated cells were observed as compared to diabetic group (fig. 2-C).Diabetic group treated with aqueous OLE (GIV):Examination of kidney sections stained with PAS stain revealed positive (+ve) reaction appeared in the RC, PCT and DCT. The TBM showed relatively reduced thickening in some tubules as compared to diabetic group. (Fig.1-D). Toluidine blue stained sections of this group showed no dilated tubules, areas of epithelial erosion, or degenerated cells were observed as compared to diabetic groups. On the other hand vacuolation in the cytoplasm of some cells were observed. (Fig.2-D).Diabetic group treated with insulin and aqueous olive leave extract (GV): L/M examination of kidney sections of diabetic animals treated with insulin and aqueous olive leaf extract stained with PAS stain revealed positive (+ve) reaction appeared in the RC, PCT and DCT. The TBM showed relatively reduced thickening in some tubules as compared to diabetic group. (Fig.1-E). Toluidine blue stained sections showed the tubular cells more or less return to their normal structure. Markedly reduced vacuolation in the cytoplasm of the tubular cells as compared to diabetic group. No dilated tubules, areas of epithelial erosion, or degenerated cells (fig. 2-E).Immunohistochemical reaction:Control group (Group I):Immunohistochemical reaction for Bax of the sections from a control adult male albino rat (GI) showed negative (-ve) reaction in the cytoplasm of the tubular cells. (fig. 3-A).Diabetic group (Group II):Immunohistochemical for Bax of the sections of the diabetic group (Group II) revealed strong positive (+ve) immunoreaction for Bax in the cytoplasm of most tubular cells. (fig .3-B).Diabetic group treated with insulin (Group III):Immunohistochemical staining for Bax of the sections from this group revealed relatively strong positive (+ve) immunoreactions for Bax in the cytoplasm of the most renal tubular cells; few cells show strong reaction (fig. 3-C). Diabetic group treated with aqueous OLE (GIV):Immunohistochemical staining for Bax of the sections from Diabetic group treated with aqueous OLE (GIV) revealed relative strong positive (+ve) immunoreaction for Bax in the cytoplasm of the cells lining renal tubules (fig. 3-D)E/M examination revealed Diabetic group treated with insulin and aqueous OLE (GV):In Immunohistochemical staining for Bax of the sections from Diabetic group treated with insulin and aqueous OLE (GV) most of the tubular cells revealed markedly reduced cytoplasmic immunoreactivity for Bax. (fig. 3-E). Electron microscopic results: Control group (Group I):Ultra structurally, ultrathin sections from a control adult male albino rat (GI) revealed that the cells of the PCT rested on well-defined basement membrane and had apical closely packed microvilli, and rounded euchromatic nuclei (fig.4-A). The cytoplasm of PCT cells revealed ovoid, rounded, and rod-shaped elongated mitochondria arranged along deep basal infoldings and regularly distributed parallel to the longitudinal axis of the cell (fig. 4-B). The mitochondria were bounded by intact two membranes separated by intramembranous space. The outer membrane was smooth and the inner membrane was folded due to presence of cristae that project within the mitochondrial matrix (fig. 4-C).Diabetic group (Group II):Ultra structurally: sections from the kidney of diabetic animals proximal convoluted tubules were seen with apical sticky and profoundly thin microvilli with focal loss. Some of the cells appeared disrupted with extrusion of their content into the lumen. There were distorted basal infoldings and thick basement membrane. (fig. 10). The cytoplasm revealed extensive vacuolation and numerous sticky mitochondria dissociated from the disarranged basal infoldings (fig. 4-D, E). Some mitochondria showed increased electron density of the matrix, others appeared swollen with disruption of mitochondrial cristae (fig. 4-.E).Diabetic group treated with insulin (Group III):Electron microscopic examination revealed that the PCT had preserved apical long, thin closely packed microvilli, few preserved longitudinal basal infolding and well-defined basement membrane as compared to diabetic group. The cytoplasm of PCT cells revealed numerous mitochondria some of them were arranged along the basal infoldings; others were sticky and dissociated from it. The discrimination between outer and inner mitochondrial membranes was lost as compared to control groups. Some mitochondria showed increased electron density of the matrix. (fig. 4- F, G)Diabetic group treated with aqueous OLE (GIV):Electron microscopic examination of this group revealed that PCT had apical long thin closely packed microvilli. Well-defined basement membrane was observed (fig.20). The cytoplasm revealed mitochondria with variable shape and size were arranged longitudinally along the basal infolding. The discrimination between outer and inner mitochondrial membrane was preserved separated by intramembranous space compared to diabetic group, (fig. 4-H).Diabetic group treated with insulin and aqueous OLE (GV):Ultra structurally, this group showed more or less normal ultrastructure of the proximal convoluted tubules. The cells regained their normal structure with few vacuoles. The tall, packed microvilli and the mitochondria regained their normal architecture of basal arrangement and intermingled with the basal membrane infolding's. The discrimination between outer and inner mitochondrial membranes was preserved compared to the diabetic group with prominent crest that project within the mitochondrial matrix. All nuclei show chromatic chromatin (fig. 4-I and J).
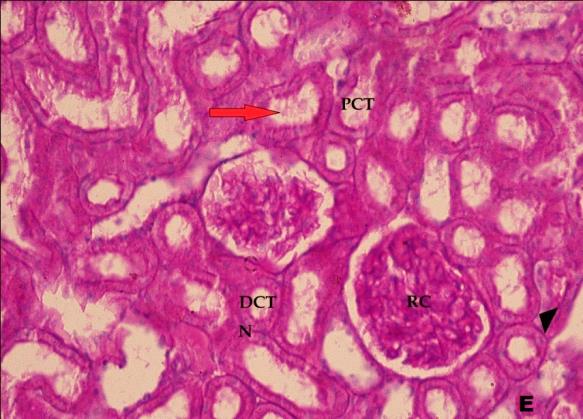
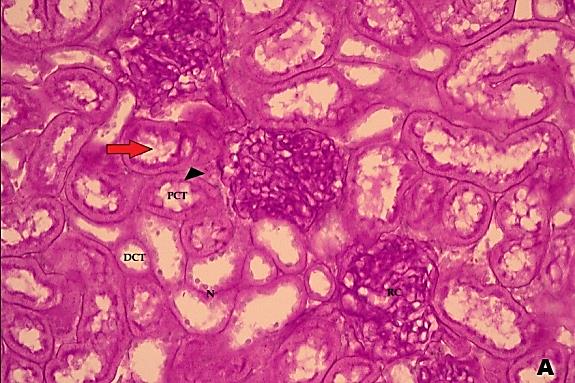 | Figure 1A. Showing PAS positive (+ve) reaction in the tubules. Notice, the PAS +ve reaction along the apical brush border (red arrow) of proximal convoluted tubules (PCT) and along the basement membrane (black arrowhead). PAS - (X400) |
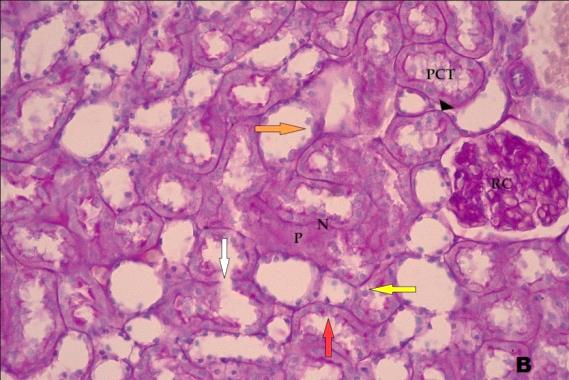 | Figure 1B. Revealing a marked increase in PAS +ve reaction in the proximal convoluted tubules (PCT) with focal interruption of the brush border (red arrow), thickening of the basement membrane (black arrowhead) and even interruption (white arrow). Notice, some tubules show partial tubular epithelial cells destruction (orange arrow), cytoplasmic vacuoles (yellow arrow) as well as PAS +ve material (P). PAS -(X400) |
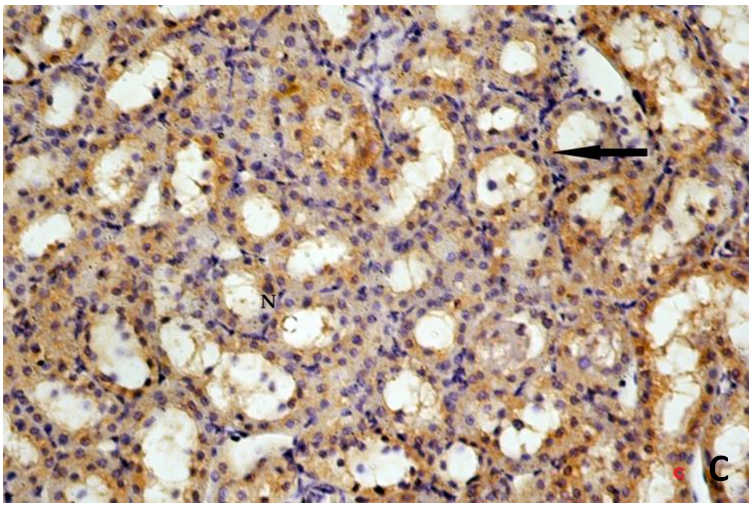
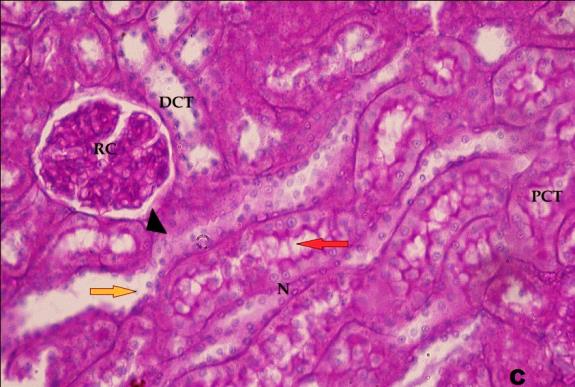 | Figure 1C. Showing PAS +ve reaction in renal the tubules. Notice, the PAS +ve reaction along the apical brush border (red arrow) of proximal convoluted tubules (PCT), and relatively thick basement membrane (black arrowhead). Some tubules appear dilated with partial tubular epithelial cell destruction (orange arrow). PAS -(X400) |
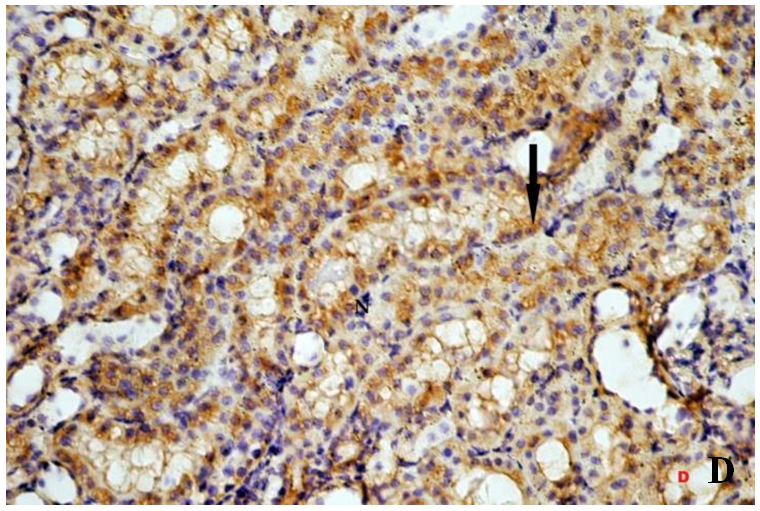
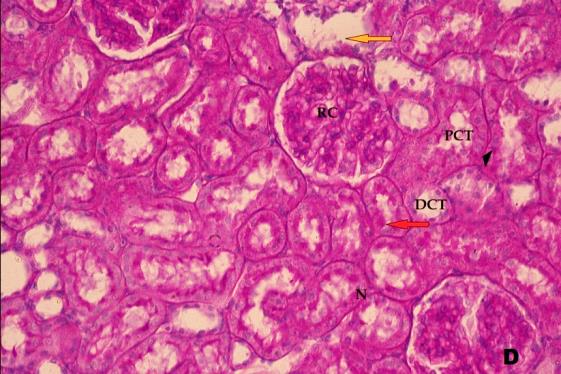 | Figure 1D. Revealing: PAS +ve reaction in the tubules. Notice, the PAS +ve reaction along the apical brush border (red arrow) of proximal convoluted tubules (PCT), and relatively reduced PAS +ve reaction along the basement membrane (black arrowhead) of some PCT. Some tubules appear dilated with partial tubular epithelial cell destruction (orange arrow). PAS -(X400) |
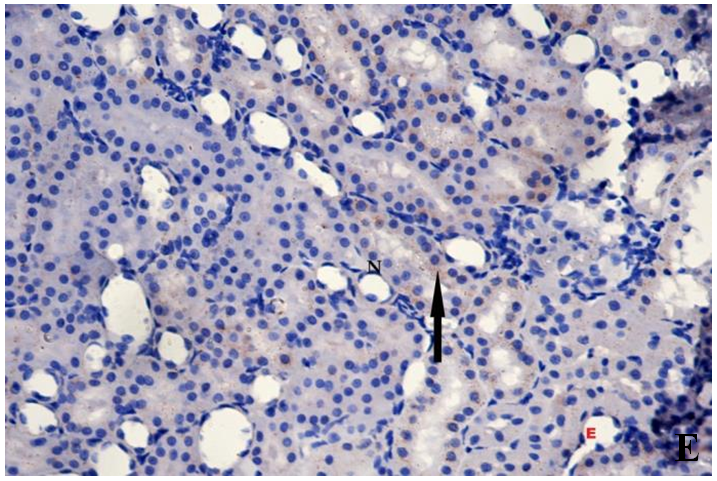
 | Figure 1E. Revealing PAS positive (+ve) reaction in the tubules. Notice the PAS +ve reaction along the apical brush border (red arrow) of proximal convoluted tubules (PCT). Relatively reduced PAS +ve reaction along the basement membrane (blackarrowhead) of tubules. PAS -(X400) |
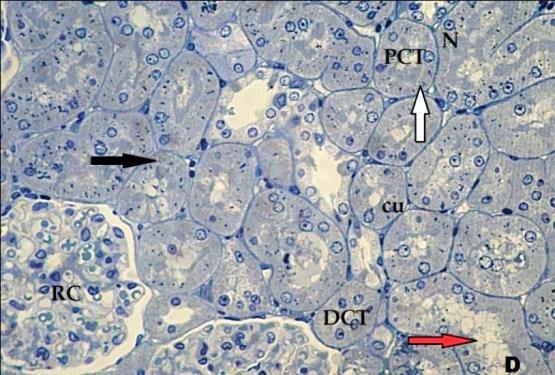
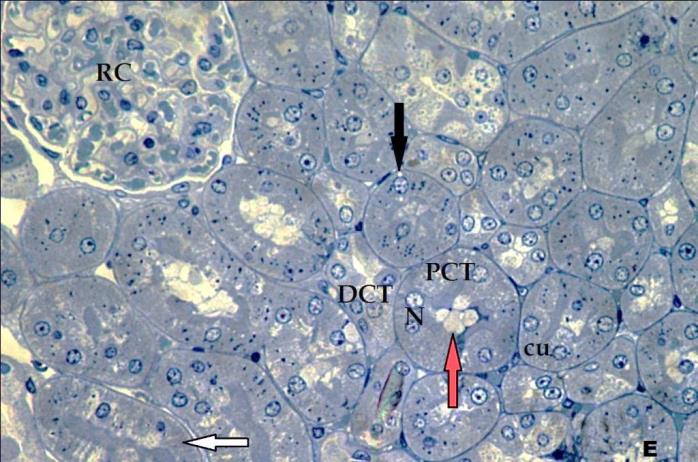
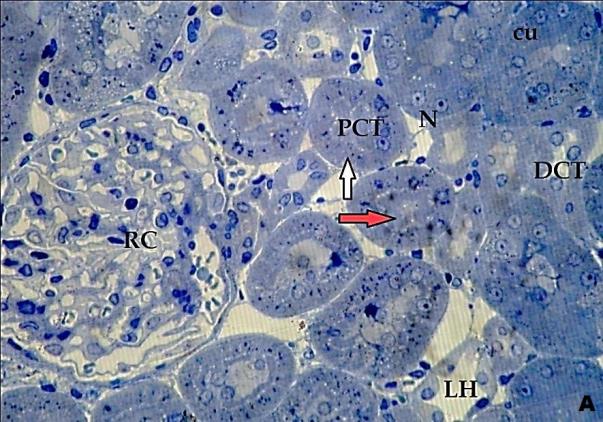 | Figure 2A. Revealing: renal corpuscle (RC), proximal convoluted tubules (PCT), distal convoluted tubules (DCT) and loop of Henle (LH). DCT is lined with cubical epithelium (cu) and the cytoplasm contains vesicular nucleus (N) with prominent nucleolus. Notice, the apical brush border (red arrow), basal striations (white arrow). Toluidine blue-(X400) |
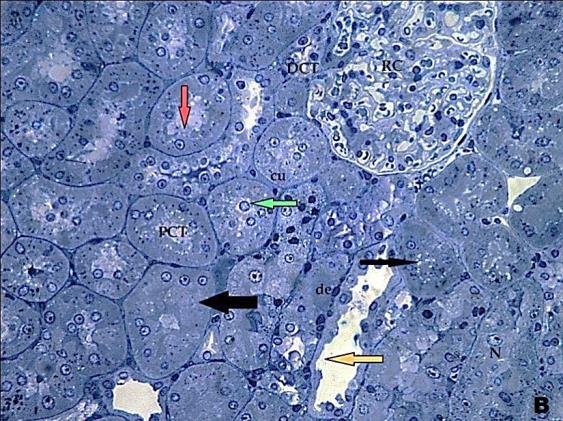 | Figure 2B. Revealing renal corpuscle (RC), proximal convoluted tubules (PCT), and distal convoluted tubules (DCT). DCT is lined with cubical epithelium (cu), some PCT show overcrowding of cells (thick arrow). The cytoplasm of some cells show vacuolation (thin arrow), nucleus with eccentric nucleolus (N) and some cells are disrupted with the nucleus extruded into the lumen (green arrow). Notice, the apical brush border is interrupted in some tubules (red arrow), others show erosion of epithelium (orange arrow) and areas of degenerated cells (de) are also illustrated. Toluidine blue-(X400) |
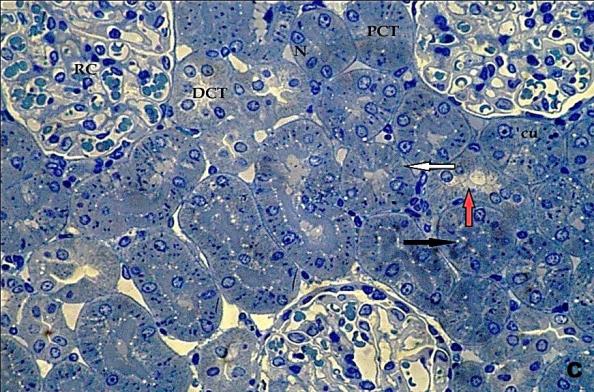 | Figure 2C. Showing the cytoplasm of proximal convoluted tubules have less vacuolation (black arrow), and vesicular nucleus (N) with prominent nucleolus. Notice, apical brush border (red arrow), basal striations (white arrow) are also illustrated Toluidine blue-(X400) |
 | Figure 2D. Showing proximal convoluted tubules (PCT) Both PCT and DCT is lined by cubical epithelium (cu); the cytoplasm show less vacuolation (thin arrow), and vesicular nucleus (N) with prominent nucleolus. Notice, apical brush border (red arrow) and basal striation (white arrow), are also illustrated. Toluidine blue(X400) |
 | Figure 2E. Revealed the cytoplasm of proximal convoluted tubules with markedly reduced vacuolation (thin arrow), and vesicular nucleus (N) with prominent nucleolus. Notice, apical brush border (red arrow) and basal striation (white arrow) are also illustrated. Toluidine blue(X400) |
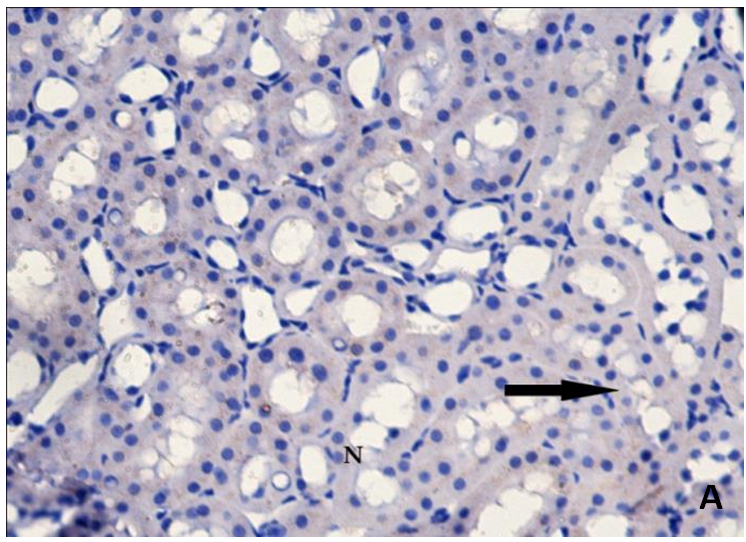 | Figure 3A. Revealing negative cytoplasmic immunoreactivity for Bax in tubular cells (arrow). Bax(X400) |
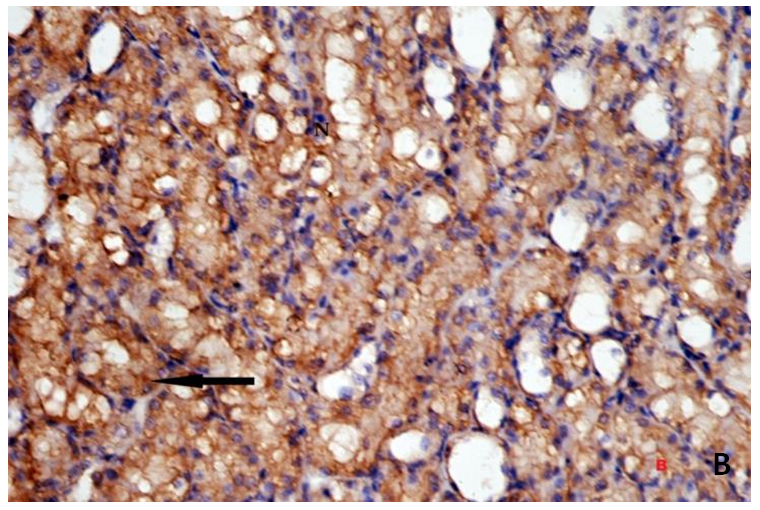 | Figure 3B. Showing strong positive (+ve) immunostaining reaction for Bax in the form of dark brown granules within the cytoplasm. Bax(X400) |
 | Figure 3C. Revealing tubular cells with moderate cytoplasmic immunoreaction for Bax in the form of dark brown granules (arrow). Bax(X400) |
 | Figure 3D. Revealing: some tubular cells with relatively positive cytoplasmic immunoreactivity for Bax in the form of dark brown granules (arrow). Bax(X400) |
 | Figure 3E. Showing markedly reduced cytoplasmic immunoreactivity for Bax in tubular cells (arrow). Bax(X400) |
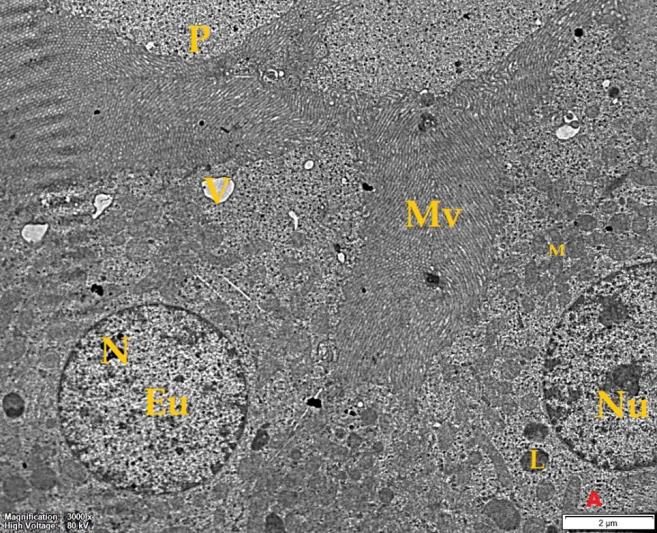 | Figure 4A. Revealing proximal convoluted tubule cells (P) with apical long thin closely packed microvilli (Mv), and two nuclei (N) with prominent nucleolus (Nu). The nuclear chromatin is mainly euchromatic (Eu). Notice, the cytoplasm also contains numerous mitochondria (M), lysosomes (L), and apical pinocytotic vesicles (V). Uranyl acetate &Lead citrate(X3000) |
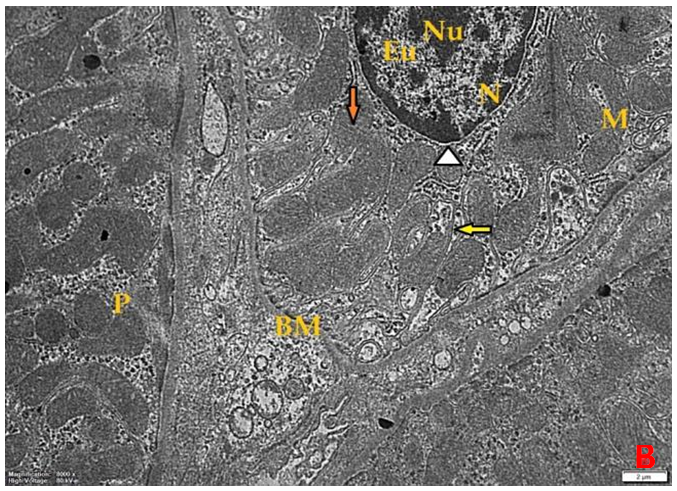 | Figure 4B. Revealing the basal part of three adjacent proximal convoluted tubules (P). The cytoplasm is rich in rod-shaped elongated mitochondria (M), with prominent cristae (orange arrow) along with deep basal infoldings (yellow arrow). Notice, well-defined basement membrane (BM), Nucleus (N) with prominent nucleolus (Nu), well-defined nuclear envelope (white arrowhead), the nuclear chromatin which is mainly euchromatic (Eu). (X8000) |
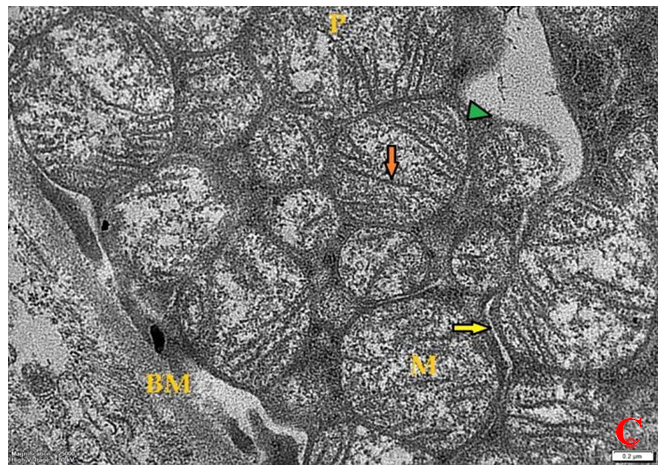 | Figure 4C. Revealing: the basal part of a proximal convoluted tubule (P) containing numerous mitochondria (M) with deep basal infolding in between (yellow arrow). Well-defined outer smooth membrane and inner membrane (green arrowhead) with prominent cristae within the matrix (orange arrow) are observed. Well-defined basement membrane (BM) is also illustrated. (X25000) |
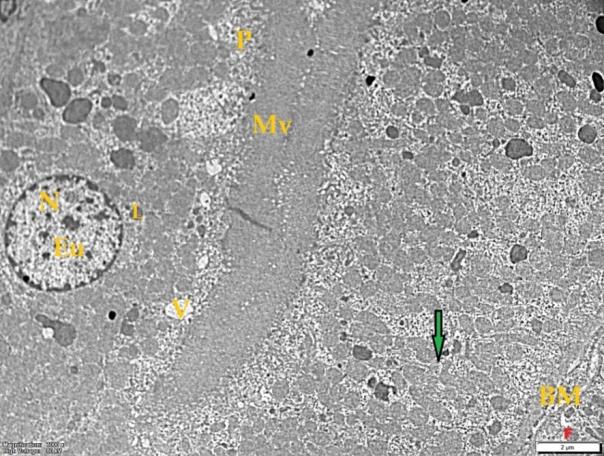
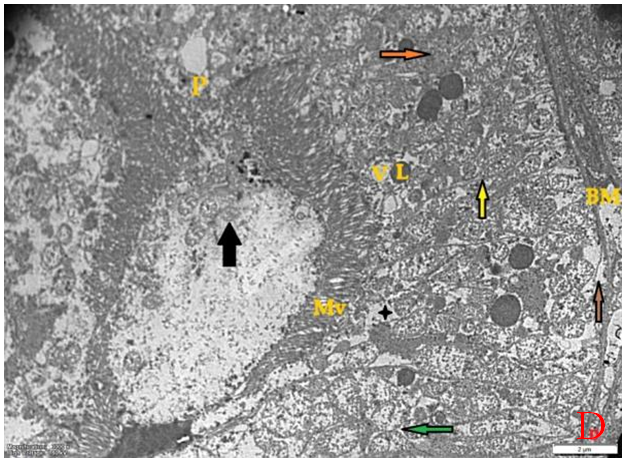 | Figure 4D. Revealing: proximal convoluted tubule cells (P) with apical sticky, profoundly thin microvilli with focal loss (Mv). Some of mitochondria are swollen with disruption of cristae (green arrow), others show increased electron density (orange arrow). The basal infoldings are few (yellow arrow) and appear to be lost in some areas (brown arrow). Notice, some of the cells appear disrupted with extrusion of their content into the lumen (thick arrow), extensive vacuolated coarse poorly defined cytoplasm (black star), lysosomes (L), pinocytotic vesicles (V), and well-defined basement membrane (BM). (X3000) |
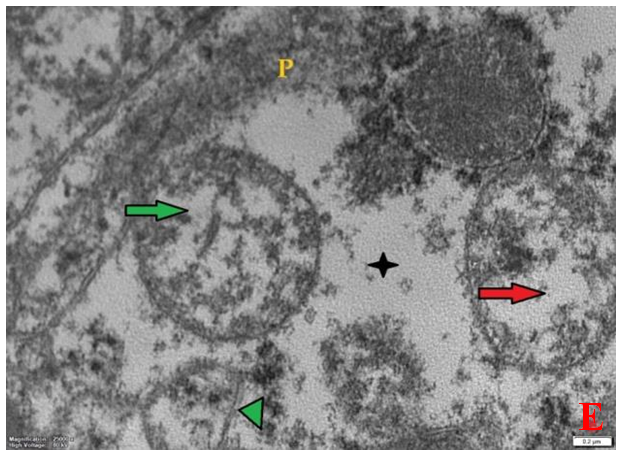 | Figure 4E. Revealing: part of proximal convoluted tubule cell (P). The cytoplasm contains swollen mitochondria with disruption of cristae (green arrow), and even cristalysis (red arrow). The discrimination between outer and inner membrane is lost (green arrowhead). Notice, extensive vacuolated coarse poorly defined cytoplasm (black star) is also illustrated. (X25000) |
 | Figure 4F. Revealing: proximal convoluted tubule cells (P) with the long thin closely packed microvilli (Mv) of opposite cells meeting at the lumen, nucleus (N), the nuclear chromatin which is mainly euchromatic (Eu). The cytoplasm contains numerous mitochondria with variable shape and size (green arrow). Notice, apical pinocytotic vesicles (V) and lysosomes (L).Well-developed basement membrane (BM) is also illustrated. (X3000) |
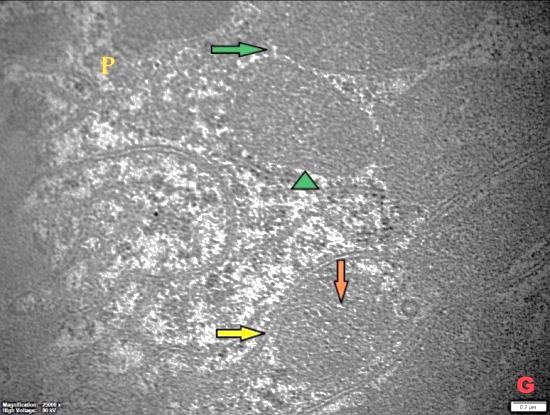 | Figure 4G. Revealing: part of proximal convoluted tubule cell (P). Some of mitochondria are arranged along the basal infoldings (yellow arrow), with increased electron density of the matrix and the cristae are hardly seen (orange arrow). The discrimination between the outer and inner membrane is lost (green arrowhead). (X25000) |
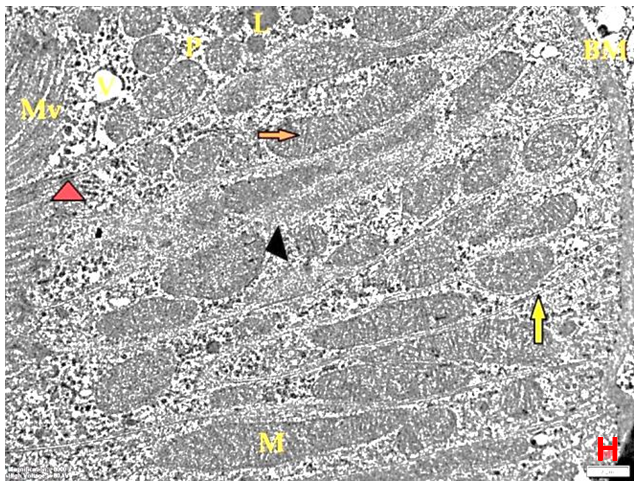 | Figure 4H. Revealing: revealing: The cytoplasm of PCT contains numerous (M) arranged longitudinally along the basal infoldings that extend deep into the cell (yellow arrow), with prominent cristae within the mitochondrial matrix (orange arrow). Notice, closely packed microvilli (Mv), the cytoplasm contains apical pinocytotic vesicles (V), lysosomes (L), and the site of tight junction between the adjacent two cells (red arrowhead). Well-defined basement membrane (BM) is also illustrated. (X8000) |
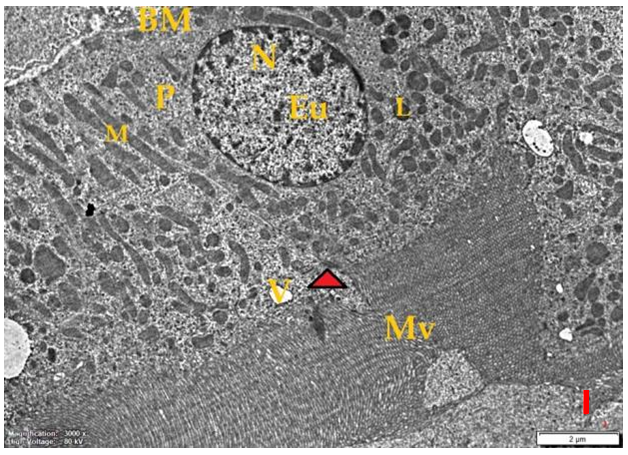 | Figure 4I. Revealing: proximal convoluted tubule cells (P) with apical long thin closely packed microvilli (Mv), nucleus (N), the nuclear chromatin which is mainly euchromatic (Eu). Notice, the cytoplasm also contains numerous mitochondria (M), lysosomes (L), apical pinocytotic vesicles (V), and the site of tight junction between the adjacent two cells (red arrowhead).Well-defined basement membrane (BM) is also illustrated. (X8000) |
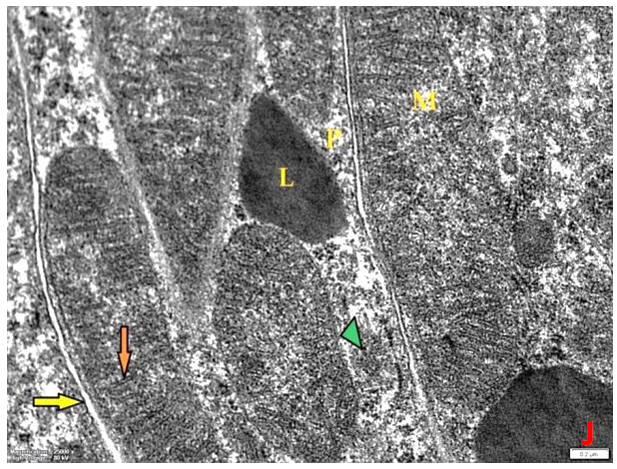 | Figure 4J. Revealing: part of proximal convoluted tubule cell (P). The cytoplasm contains rod-shaped elongated mitochondria (M) arranged along the basal infoldings that tend to extend deep into the cell (yellow arrow), with prominent cristae within the mitochondrial matrix (orange arrow). The discrimination between the outer and inner membrane is preserved (green arrowhead). Notice, lysosomes (L) are also illustrated. (X25000) |
|
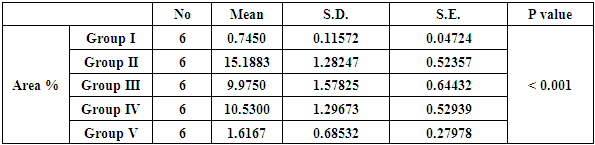
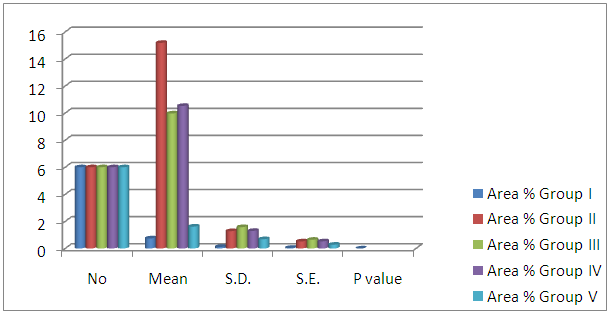 | Histogram 1. Showing comparison between control, diabetic group (GII) and treated groups regarding area percent of Bax expression in PCT cells |
|
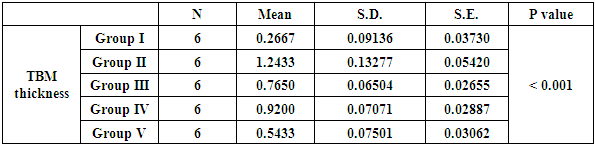
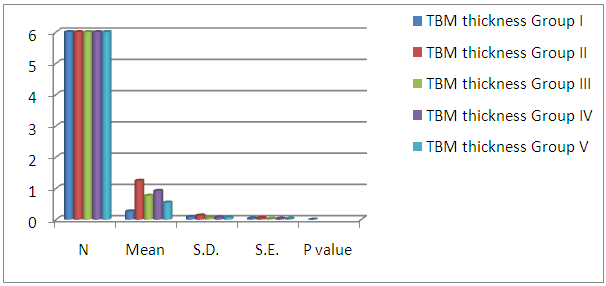 | Histogram 2. Showing comparison between diabetic group (GIII), control and treated groups regarding proximal convoluted TBM thickness |
|
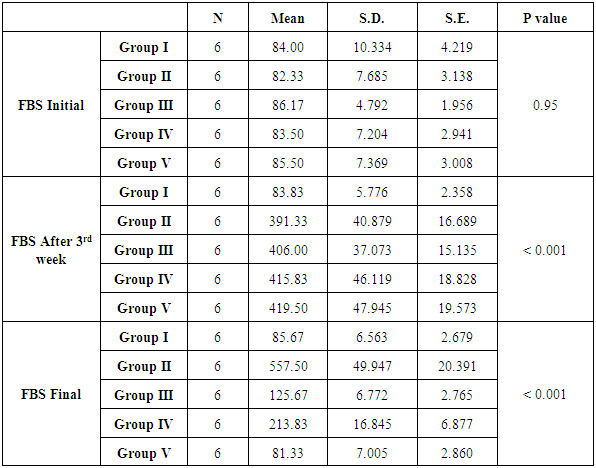
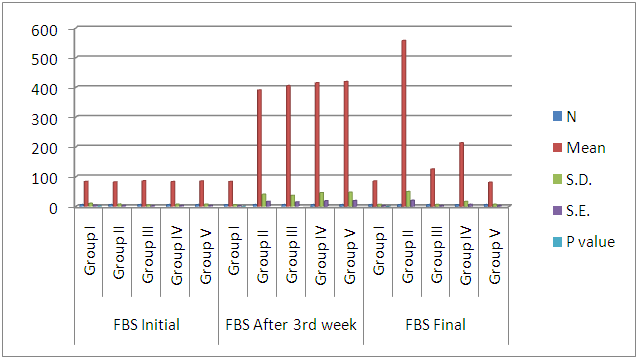 | Histogram 3. Showing comparison of initial, after 3rd week, and final FBS among the six groups |
|
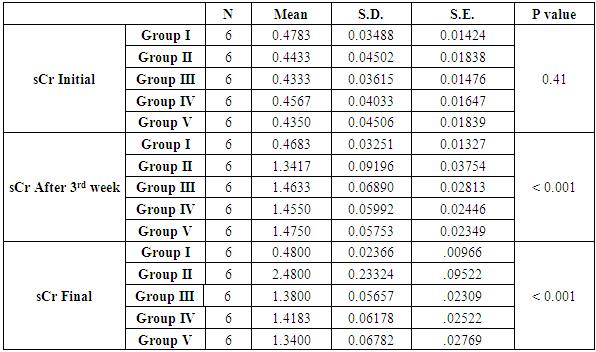
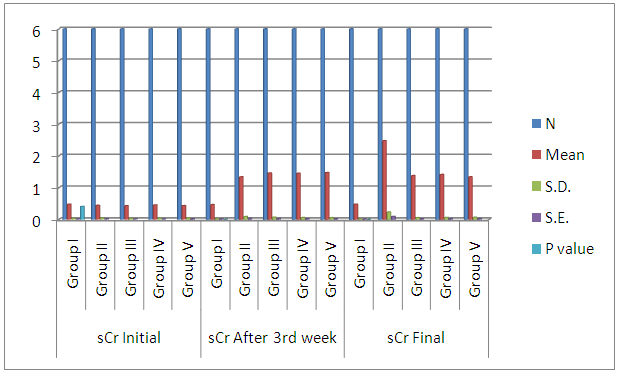 | Histogram 4. Showing comparison of initial, after 3rd week, and final sCr among the six groups |
|
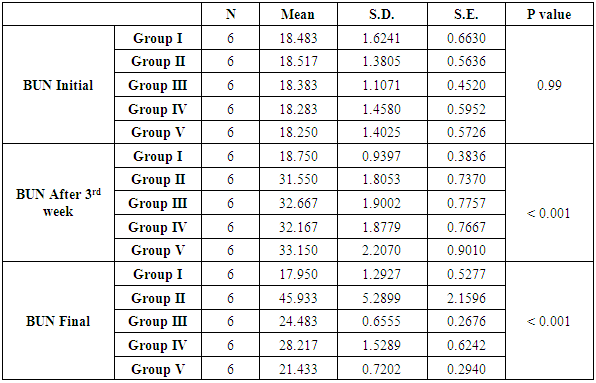
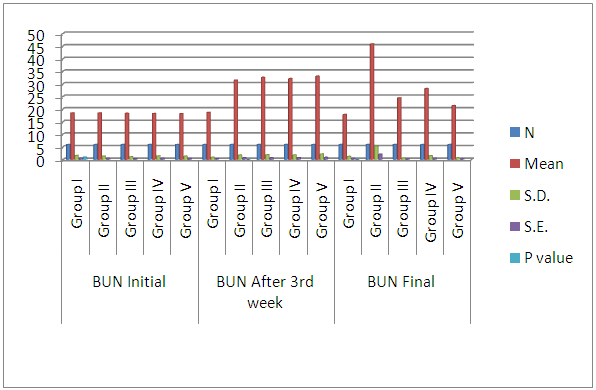 | Histogram 5. Showing comparison of initial, after 3rdweek, and final BUN among the six groups |
4. Discussion
- Diabetic nephropathy develops in a large number of patients with TID and TIID after a variable latency period [2].[31] Noted that kidney mitochondria are readily exposed to the damaging effect of exacerbated hyperglycemia. According to [32] damage to renal mitochondria may contribute to worsening of nephropathy and even renal failure. The use of olive leaf extract has increased rapidly in the pharmaceutical due to its hypoglycaemic antioxidant properties of its content mainly oleuropein and hydroxyl tyrosol [33] and triterpenoids such as oleanolic acid [34].In the current work, fasting blood sugar reduced in treating a group with marked improvement in diabetic group received combined treatment with insulin and aqueous olive leaf extract. This was in agreement with the result of some researchers [35] who interestingly showed that supplementation with olive leaf polyphenols significantly improved insulin sensitivity and hence glucose concentration in middle-aged, overweight men, he also observed increased plasma concentrations of insulin-like growth factor binding protein, insulin-like growth factor binding protein-I (IGFBP-1) associated with lower insulin levels.In the current study, the blood urea and creatinine reduced in the treating a group with marked improvement in diabetic group received combined treatment with insulin and aqueous olive leave extract. Our results were supported by the findings of [36] who noticed significant improvement in sCr and BUN in rats with gentamicin-induced nephrotoxicity treated simultaneously with OLE and suggested that this improvement was due to increased renal antioxidant enzymes thanks to the antioxidant properties of the natural occurring olive polyphenols [37] and oleanolic acid [10] and enhance cytoprotective antioxidant defence mechanism e.g. enhances transcription of GSH, SOD and CAT [38]; [39].In this study, The observed thickening of the basement membrane of proximal convoluted tubules in GII was explained by [40]; [41] who mentioned that reactive oxygen species (ROS) generated from damaged mitochondria in proximal convolute tubule cells exposed to high glucose enhances angiotensin converting enzyme (AGEs) production which in turn activates the major key implicated in TBM thickening.In the current study, Examination of area percent representing proapoptotic protein Bax expression in PCT cells of GII in comparison to control and treated groups explained by [42] who reported that hyperglycaemia directly mediates apoptosis in renal PCT in vitro, and [43] who detected apoptosis in human diabetic kidney. [44] added that oxidative stress OS associated with hyperglycaemia leads to insufficient cytoprotective response and redox imbalance resulting in apoptosis with subsequent renal injury and DN.The observed focal loss of microvilli and vaculation of cytoplasm in GII run parallel to the changes in the cytoskeleton due to ATP depletion as discussed by [45] and also in agreement with [46] who reported ATP depletion as sub-lethal or lethal renal PCT cell injury. In the present work the observed increase in electron density of matrix in some mitochondria explained by [47] who mentioned that the increased mitochondrial activity as a compensatory mechanism to meet the energy requirement of the cell due to increased glucose load in the glomerular filtrate, and in order to balance the lowered energy production resulting from damaged mitochondria.The detected swollen mitochondria with disruption of cristae were explained by [48] to be caused by the influx of water into the inner and outer mitochondrial membranes.In this study, diabetic adult male albino rats treated with aqueous OLE only was revealed relative improvement of histological changes in relation to diabetic group, markedly diminished of the TBM thickness when compared with that of diabetic group .Examination of area percent representing proapoptotic protein Bax expression in PCT cells revealed markedly reduced reaction.This explained by some researchers who probably attributed to the hypoglycaemic and antioxidant properties of OLE component namely Oleuropein and oleanolic acid that inhibit ROS production thus maintain biological membrane integrity and prevent lipid peroxidation [49]; [10].The marked diminution of morphological changes; in relation to diabetic group; in this group could be attributed to the hypoglycaemic properties of OLE component as well as its ability to increase insulin sensitivity via Controlling the postprandial glucose level via inhibition of carbohydrate digestive enzymes; α-amylase and α-glycosidase and sensitizing the cells to insulin action improving glucose uptake by the cells [50]; [51]. In this study electron microscopic examination of the PCT revealed improvement as the cytoplasm of PCT cells contained numerous mitochondria of normal shape and size arranged longitudinally along the intact basal infoldings and relatively normal microvilli in relation to diabetic group.This finding was in agreement with [35] who reported that olive polyphenols improved insulin sensitivity in middle-aged, overweight men, and [52]; [53] who suggested that reduction of oxidative stress (RO) by anti-oxidant enzyme activity following hyperglycemias injury could improve renal function due to reduction in tubular cell apoptosis.
5. Conclusions
- From this study, it could be concluded that used to olive leaf extract not as a substitution of insulin therapy, but as an additional hypoglycaemic antioxidant agent that might help alleviating the ROS effect on both mitochondria and PCT. The use of combined therapy of insulin and AOLE provides better glycaemic control and protection for the ultrastructure of PCT with better kidney function tests.