-
Paper Information
- Paper Submission
-
Journal Information
- About This Journal
- Editorial Board
- Current Issue
- Archive
- Author Guidelines
- Contact Us
American Journal of Medicine and Medical Sciences
p-ISSN: 2165-901X e-ISSN: 2165-9036
2016; 6(1): 29-33
doi:10.5923/j.ajmms.20160601.05

Comparison between Platelet Count, Spleen Diameter and Their Ratio with Esophageal Varices in Patients with Liver Cirrhosis
 Abstract
 Reference
 Full-Text PDF
 Full-text HTML
Dharmendra Tiwari, Sangeeth Kumar, Deepankar Lahariya, Jeby Jacob
Department of Medicine, G.R. Medical College, Gwalior, India
Correspondence to: Dharmendra Tiwari, Department of Medicine, G.R. Medical College, Gwalior, India.
| Email: |  |
Copyright © 2016 Scientific & Academic Publishing. All Rights Reserved.
This work is licensed under the Creative Commons Attribution International License (CC BY).
http://creativecommons.org/licenses/by/4.0/

Aims and Objectives: To access the diagnostic validity and correlation between platelet count, spleen diameter and their ratio with esophageal varices (EV) in patients with liver cirrhosis. Methods: The present study was done on 100 patients during August 2014 to November 2015. Patients with a diagnosis of hepatic cirrhosis were included and stratified using their Child-Pugh score. Biochemical parameters were evaluated, and ultrasound was used to measure the longest diameter of the spleen. The platelet count/spleen diameter (PC/SD) ratio was calculated and analyzed to determine whether it can predict the presence of EV. Upper gastrointestinal endoscopy was used as the gold standard. Sensitivity and specificity, positive and negative predictive values were determined, with the cutoff points. Results: The mean age was 45±13 years, 80% were males. Alcohol was the most common etiological factor (68%). EVs were present in 66% patients. The platelet count/spleen diameter ratio to detect EV independent of the grade showed using a cutoff value of ≤ 909, had 81.8% sensitivity, 100% specificity, and positive and negative predictive values of 100% and 73.91%, respectively. Conclusions: PC/SD ratio can be used to identify patients who are having risk factors for varix even in a primary health care set up and would avoid unnecessary endoscopy.
Keywords: Esophageal varices, Hepatic cirrhosis, Platelet count/spleen diameter ratio
Cite this paper: Dharmendra Tiwari, Sangeeth Kumar, Deepankar Lahariya, Jeby Jacob, Comparison between Platelet Count, Spleen Diameter and Their Ratio with Esophageal Varices in Patients with Liver Cirrhosis, American Journal of Medicine and Medical Sciences, Vol. 6 No. 1, 2016, pp. 29-33. doi: 10.5923/j.ajmms.20160601.05.
1. Introduction
- In cirrhosis normal functioning of liver is altered due to destruction and replacement of hepatocytes and liver parenchyma by scar tissue as a result of injury to them. According to WHO data published in May 2014, deaths due to liver diseases accounted for 2.31% of total deaths. [1] Liver disease is the tenth most common cause of death in India. [2]Portal hypertension usually accompanies cirrhosis. [3] It is a progressive complication of cirrhosis which leads to the formation of esophageal varices (EV). [4] Patients with Gastro Esopageal Varices (GEV) usually have hepatic vein pressure gradient (HVPG) of 10-12 mmHg. [5] GEV are the most relevant porto-systemic collaterals that develop in response to portal hypertension and their rupture leads to variceal haemorrhage which is one of the most lethal complication of cirrhosis.Esophageal varices are present in about 30% patients with compensated and 60% with decompensated cirrhosis. [4] Their presence usually correlates with the severity of liver disease. Only 40% of Child A (Child-Pugh Class) patients has varices whereas 85% of Child C patients have varices. [6] The rate of development of new varices is 8% per year and strongest predictor for development of varices is HVPG more than 10 mm Hg. The progression from small to large varices occurs at rate of 8-10% per year. [7]To reduce the burden on endoscopic units and to make it more cost–effective to patients by avoiding unnecessary endoscopy, lesser noninvasive alternative to endoscopy have been studied. Various clinical, biochemical and ultrasonography parameters were investigated for non-invasive diagnosis of EV and were found to have good predictive value. Among the parameters studied, the parameter that links EV to portal hypertension was found to have the highest predictive value. Platelet count, spleen diameter are directly or indirectly linked to the presence of EV. The platelet count/Spleen Diameter ratio (PC/SD), proposed by Giannini et al, is among the best non-invasive predictor of EVs that has been studied till date. [8]The current study has been done to find the correlation between platelet count, spleen diameter and its ratio with esophageal varices in patients with liver cirrhosis; to validate the diagnostic validity of PC/SD as a non-invasive predictor of varices so that unnecessary endoscopy can be avoided.
2. Materials and Methods
- It was a descriptive observational study including 100 patients of liver cirrhosis admitted in Deptt of Medicine, G R Medical College & J A Group of Hospitals, during August 2014 to November 2015.A written informed consent from all the patients and Institutional Ethics Committee approval was obtained before starting the study.Patients aged more than 18 years with liver cirrhosis due to any etiology were included in the study.Patients with present or previous history of variceal bleed, previous/current treatment with beta blockers, anti-platelet drugs, who have undergone sclerosis (or) band ligation of esophageal varices, TIPSS (or) surgery for portal hypertension, had hepatic encephalopathy, had hepato-renal syndrome and had thrombocytopenia due to any other cause were excluded from the study. In addition, patients with thrombocytosis due to iron deficiency anemia or any other cause were also excluded from the study.Diagnosis of liver cirrhosis was based on a combination of history, clinical findings, impaired liver function tests, deranged coagulation profile and abdominal ultrasound.A detailed history and clinical examination was done and recorded. The severity of disease was classified on basis of Child-Pugh-Turcotte score. [9]Investigations including complete blood count with peripheral smear to rule any other haematological cause of thrombocytopenia, liver function test (Serum Bilirubin, AST, ALT, SAP, serum albumin, PT), serum creatinine, USG abdomen (for liver architecture and nodularity, spleen bipolar diameter, presence of ascites), upper gastrointestinal endoscopy for the presence of esophageal and gastric varices and their grading was done. All patients with cirrhosis were subjected to endoscopy. If varices were present they were graded according Sharma et al PAQUET’s grading system as Grade I (Varices disappearing with insufflations), Grade II (Larger, clearly visible varices not disappearing with insufflations), Grade III (More prominent varices, locally coil-shaped & partly occupying the esophageal lumen) and Grade IV (Tortuous, sometimes grape-like varices occupying the esophageal lumen). [10]The physical, biochemical and radiological parameters were then evaluated for their role as non-invasive predictors of EV. The longitudinal diameter of spleen was calculated in millimeters, platelet count to spleen diameter ratio was calculated for all patients. The platelet count, spleen diameter and platelet count to spleen diameter ratio were compared between the two groups of patients, those with EV and without EVs. Then we tried to look whether PC/SD and Child class can predict grade of varices. Varices were divided into two groups- small varices which included Paquet’s Grade I & II and Large EV which included Grade III & IV. [10]Descriptive and inferential statistical analysis was done using IBM SPSS ver. 20. Results on continuous measurements are presented as Mean± SD (Min-Max) and results on categorical measurements are presented in number (%). Significance is assessed at 5% level of significance and P<0.05 was considered to be significant.
3. Results
- In the present study the age of patients range from 17-72 years. Most of the patients (31%) were from the age group of 40-50 years (Table 1).
|

|
4. Discussion
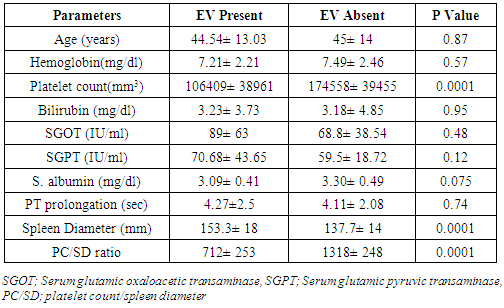
- The study analysed 100 patients with liver cirrhosis. The mean age of the study population was 45±13 years; range 17-72 years. The mean age of EV group was 44.5 years and NEV group was 45 years. The majority of subjects were of 40-50 year age group (31%). The incidence of EVs was similar in the young and elderly. Age had no correlation with EV (p=0.87). Legasto et al studied 150 patients, the mean age was 51 years in EV group and 57 in NEV group, which was slightly higher than mean of our study population. [11]There was a male preponderance in the study as evident by male to female ratio of 4:1. EV was present in 66% patients; 54 (67.5%) male and 12(60%) female similar to the findings of Sharma et al. [10]Alcohol was the most common aetiological factor, responsible for 68% of cirrhosis in study population. EV was present in 43 (63.2%) patients of alcohol related cirrhosis. In the study of 150 patients by Baig et al, alcohol was responsible in 48.6%; HBV in 26%; HCV in 9.3%; cryptogenic in remaining. [12]Abdominal distension (81%) was the most common symptom in the study population. Other symptoms were edema (66%) and jaundice (26%). Splenomegaly (86%) was the most common sign. Apart from splenomegaly none of the other signs or symptoms had statistically significant correlation with EVs (p>0.05). Sarangapani et al studied 106 patients of south India, with cirrhosis. Clinically detectable ascites was present in 50 patients, edema in 43 and jaundice in 53 patients. [13]The Child-Pugh score was found to be higher in patients with varices, but it was not statistically significant (p=0.46). Cherian et al did a study of 229 patients, and reported almost similar results. [14]The mean haemoglobin of cases with varices was 7.21±2.21 mg/dl and that without EV was 7.49±2.46 mg/dl. The mean platelet count of cases with EV was 106409±38961/mm3 and NEV group was 174558±39455/mm3. Thomopoulos et al had reported a low platelet count (< 118000/mm3), splenomegaly (>135 mm) and ascites to be an independent predictors of varices. [15] Chalasani et al found that a platelet count less than 88,000/mm3 and splenomegaly to be independent risk factor for the presence of large varices. [16]The mean haemoglobin, serum albumin (3.09±0.41-EV vs 3.30± 0.49 NEV) were lower and the serum bilirubin (3.23±3.73-EV vs 3.18±4.85-NEV) and liver enzymes (AST, ALT) were higher in the group with EV; however none of them assumed statistical significance (p>0.05). Makarem et al in their study on Egyptian patients with cirrhosis obtained low platelet count, low serum albumin, high serum bilirubin and liver enzymes in EV group. [17]USG documented ascites was present in 80 patients. In UGIE, EV was present in sixty-six patients (66%) with cirrhosis. Gonzalez-Ojeda et al reported presence of EV in 73 (80.2%) out of 91 patients. 21 (23%) had Grade I, 30 (32.9%) had Grade II and 22 (24.1%) had Grade III varices. [2]The mean spleen diameter in USG was 153.3±18mm (range 125-200 mm) of EV group and 137.73±14 (114-165 mm) of NEV group. Majority (7%) had spleen diameter in range 125-160 mm and 27 cases had spleen diameter more than 160 mm. Larger spleen diameter was observed in patients with EV. Splenomegaly was associated with varices and it was statistically significant (p=0.0001). In the study by Agha et al the mean spleen diameter of EV group was 147 (130-154) mm and NEV group was 109 (103-136) mm. [19]The PC/SD ratio was lower in patients with EV compared with no EV (p=0.0001).Present study also calculated the sensitivity and specificity keeping the PC/SD ratio cut-off 909(based on original study by Giannini et al); the values obtained were sensitivity and specificity of 81.8% and 100%, respectively. The positive and negative predictive values for PC/SD ratio were 100% and 73.91%, respectively which were comparable to the previous studies. [8]Splenomegaly and thrombocytopenia were predictors of EV but thrombocytopenia in cirrhosis can be due to several factors (shortened life span, decreases TPO production, increased splenic sequestration, bone marrow suppression dues to alcohol or hepatitis virus). On the other side splenomegaly in cirrhosis is likely the result of vascular disturbance that are mainly related to portal hypertension. Giannini et al in their study of 266 patients with cirrhosis (included alcoholic, HBV& HCV related) found that platelet count/spleen diameter ratio is the only parameter which is independently associated with presence of EV. The PC/SD of EV patients was 533 and NEV group 1638. Using cut off 909 for PC/SD ratio they found that it had a negative predictive value (NPV) of 100% and 71% positive predictive value (PPV). [8] Agha et al studied 114 patients with compensated HCV related cirrhosis. By using PC/SD ratio cut-off of 909 showed NPV of 100% and a PPV of 93.8% for the diagnosis of EV. [18, 19]The diagnostic accuracy of PC/SD was preserved across varying severity of liver disease, determined by Child Class. Giannini et al obtained a sensitivity of 78.9% in Class A, 96.4% in Class B and 100 % in Class C; and specificity was 72.6% in Class A, 50% in Class B and 37.1% in Class C. [20]The severity of liver disease (Child Class) had no relation with the grade of EV. However, low PC/SD was a predictor of large EV. Wang et al did a retrospective study of 104 patients with liver cirrhosis, of them 51.9% had large EV and 49.9% had small EV. They concluded that no single parameter can accurately predict the grade of varices. [21]The difference in the sensitivity of PC/SD ratio in various studies may be because of difference in sample size, aetiological difference of cirrhosis, human error in identifying EV during endoscopy, geographical & ethnical difference of sample population studied, inter-observer variation in documentation of spleen diameter and grading of varices.Chawla et al did a study to systematically review the diagnostic accuracy of cut-off 909 for PC/SD ratio. It yielded a pooled sensitivity of 89% and specificity of 74%. The quality of evidence as assessed by GRADE methodology was low and they recommended that PC/SD ratio cannot be a replacement for oesophago-gastroduodenoscopy (EGD). [22]All patients with cirrhosis should undergo USG routinely at 6 months for HCC screening. Also platelet count is easily obtainable. So by using PC/SD ratio we can identify patients who are having risk factors for varix even in a primary health care set up. By subjecting only those patients who are having low PC/SD preferably less than 909 would avoid unnecessary endoscopy, which is an unpleasant and costly procedure. Hence it would be cost-effective and reduce the burden on patient as well on the medical resources.The present study had few limitations. The cases were mainly alcohol related cirrhosis. Cases due to other etiology were few; hence validity of PC/SD ratio in cirrhosis due to other etiology is questionable. The diagnosis of cirrhosis was made mainly on clinical, biochemical and USG parameters rather than liver biopsy. The USG abdomen and EGD were not routinely done by single consultant, hence there may be intra-observer variability in measuring spleen diameter and varices grading.
5. Conclusions
- Esophagogastroduodenoscopy (EGD) is the gold standard for diagnosis of EV; however by using such non-invasive methods we can restrict the use of endoscopy to those cirrhotic patients who have high risk of EV (low PC/SD ratio < 909).