-
Paper Information
- Previous Paper
- Paper Submission
-
Journal Information
- About This Journal
- Editorial Board
- Current Issue
- Archive
- Author Guidelines
- Contact Us
American Journal of Medicine and Medical Sciences
p-ISSN: 2165-901X e-ISSN: 2165-9036
2015; 5(5): 208-219
doi:10.5923/j.ajmms.20150505.04
Dosimetric Comparison of 3DCRT Versus RapidArc in Terms of Iso-dose Distribution, Dose Volume Histogram (DVH) and Dosimetric Results for the PTV and Critical Organs for Glioblastoma (GBM)
 Abstract
 Reference
 Full-Text PDF
 Full-text HTML
H. A. Sharyan1, S. H. Allehyani1, A. R. Tolba1, 2
1Medical Physics Group, Physics Dept, College of Applied Science, Umm ALQura University, Makkah, Saudi Arabia
2Radiotherapy and Nuclear Medicine Department, National Cancer Institute, Cairo University, Cairo, Egypt
Correspondence to: S. H. Allehyani, Medical Physics Group, Physics Dept, College of Applied Science, Umm ALQura University, Makkah, Saudi Arabia.
| Email: |  |
Copyright © 2015 Scientific & Academic Publishing. All Rights Reserved.
Purpose: The aim of the present study is to compare (3D-CRT) to RapidArc planning using (LNAC of 6 MV, 15 MV and 18 MV) in terms of dosimetric outcomes of iso-dose distribution, dose volume histogram (DVH), PTV and at risk organs in 11 patients with glioblastoma (GBM). Methods: Plans were created for 11 patients with GBM who had received radical RapidArc treatment from 2012 to 2014 at KAMC (King Abdullah Medical City). Dosimetric evaluation metrics were used to compare the two plans in terms of mean, maximum and minimum doses to PTV, Homogeneity Index (HI), Conformity Index (CI), Target Coverage Index (TCI) and mean and maximum doses to critical organs and normal tissue. Dose to 95% of the PTV (D95%) was used to quantify PTV coverage. Results: RapidArc plan achieved lower mean and maximum doses to the PTV. PTV dose coverage, as measured by the minimum dose and the dose to 95% of the volume, was higher in the RapidArc plan. RapidArc plan also showed a more homogeneous dose distribution in PTV, achieving an HI of 1.0559 compared with 1.0853 in the 3D-CRT plan. However, RapidArc and 3D-CRT achieved similar CI values and improvement in TCI value. Additionally, regarding OARs, the mean and maximum dose in right optic nerve (RON) was lower in RapidArc with a low percentage of the volume receiving low doses. Optic chiasms were within tolerance in RapidArc and 3D-CRT. Although the mean dose was better in 3D-CRT, critical structure was better in the RapidArc plan. RON was lower in RapidArc, while LON was lower in 3D-CRT, and the optic chiasm was approximately equal for both techniques. For brain stem, the maximum dose was within tolerance criteria in RapidArc but exceeded the criteria in 3D-CRT at 60.97 Gy. For the spinal cord, the maximum dose was notably low and did not exceed 1.91 Gy in RapidArc, while it exceeded the acceptable limit in 3D-CRT. Conclusions: (VMAT) is superior to 3D-CRT in term of PTV, conformity and homogeneity and accepting the VMAT class solution over 3D-CRT treatment was preferred to be determined on a case by case basis.
Keywords: Planning Tumor Volume, Organs at Risk, Conformity Index, Heterogeneity Index, Head Cancer
Cite this paper: H. A. Sharyan, S. H. Allehyani, A. R. Tolba, Dosimetric Comparison of 3DCRT Versus RapidArc in Terms of Iso-dose Distribution, Dose Volume Histogram (DVH) and Dosimetric Results for the PTV and Critical Organs for Glioblastoma (GBM), American Journal of Medicine and Medical Sciences, Vol. 5 No. 5, 2015, pp. 208-219. doi: 10.5923/j.ajmms.20150505.04.
Article Outline
1. Introduction
1.1. Management of Patients with Cancer
- The optimal care of patients with malignant tumors is a multidisciplinary effort that combines classic modalities, surgery, radiation therapy, and chemotherapy. The role of the radiation oncologist is to assess all conditions relative to the patient and tumor, to systematically review the need for diagnostic and staging procedures, and, in consultation with other oncologists, determine the best therapeutic strategy. Radiation oncology includes the clinical and scientific discipline devoted to management of patients with cancer (and other diseases) with ionizing radiation (alone or combined with other modalities), investigation of the biologic and physical basis of radiation therapy, and training of professionals in the field. The aim of radiation therapy is to deliver a precisely measured dose of irradiation to a defined tumor volume with minimal damage to surrounding healthy tissue. This results in eradication of the tumor, increased quality of life, and prolongation of survival at a competitive cost, and allows for effective palliation or prevention of symptoms of cancer, including pain, restoring luminal patency, skeletal integrity, and organ function, with minimal morbidity [1, 2].
1.2. Process of Radiation Therapy
- The goal of therapy should be defined at the onset of therapeutic intervention: • Curative: There is a probability of long-term survival after adequate therapy. Some side effects of therapy, although undesirable, may be acceptable. • Palliative: There is no hope of survival for extended periods. Symptoms producing discomfort or an impending condition that may impair comfort or self-sufficiency require treatment. No major iatrogenic conditions should be observed. Relatively high doses of irradiation (sometimes 75% to 80% of the curative dose) are required to control the tumor for the survival period of the patient [3].
1.3. Basis for Prescription of Irradiation
- The basis for Prescription of Irradiation includes Evaluation of the extent of the tumor (staging), including diagnostic studies, knowledge of pathologic characteristics of the disease, definition of the goal of therapy (cure or palliation), selection of appropriate treatment modalities (irradiation alone or combined with surgery, chemotherapy, or both), determination of the optimal dose of irradiation and volume to be treated, according to anatomic location, histologic type, stage, potential regional nodal involvement (and other tumor characteristics), and normal structures in the region. It also includes evaluation of the patient's general condition, plus periodic assessment of tolerance to treatment, tumor response, and status of normal tissues treated and Ultimate responsibility for treatment decisions, technical execution of therapy, and consequences of therapy always rests with the radiation oncologist [1, 4].
1.4. Radiation Treatment Planning
- Different irradiation doses are required for various probabilities of tumor control, depending on the tumor type and the initial number of clonogenic cells present. Various radiation doses can be delivered to specific portions of the tumor periphery versus central portion) or to the tumor bed in cases in which the entire gross tumor has been surgically removed. The International Commission on Radiation Units and Measurements Reports Nos. 50 and 62 define the following treatment planning volumes [5, 6]: Gross tumor volume (GTV): all known gross disease, including abnormally enlarged regional lymph nodes. To determine GTV, appropriate computed tomography (CT) window and level settings that give the maximum dimension of what is considered potential gross disease must be used. Clinical target volume (CTV): Encompasses GTV plus regions considered to harbor potential microscopic disease. Planning target volume (PTV): provides margin around CTV to allow for internal target motion, other anatomic motion during treatment (e.g., respiration), and variations in treatment setup. PTV does not account for treatment machine beam characteristics [7]. Treatment portals must adequately cover all treatment volumes plus a margin to account for beam physical characteristics, such as penumbra. Simulation is used to accurately identify target volumes and sensitive structures and to document configuration of portals and the target volume to be irradiated. Treatment aids (e.g., shielding blocks, molds, masks, immobilization devices, compensators) are extremely important in treatment planning and delivery of optimal dose distribution. Repositioning and immobilization devices are critical because the only effective irradiation is that which strikes the clonogenic tumor cells [8]. Simpler treatment techniques that yield an acceptable dose distribution are preferred over more costly and complex ones, which may have a greater margin of error in day-to-day treatments. Accuracy is periodically assessed with portal (localization) films or on-line (electronic portal) imaging verification devices. Portal localization errors may be systematic or may occur at random [7].
1.5. Three-Dimensional Treatment Planning
- CT simulation allows for a more accurate definition of target volume and anatomy of critical normal structures, three-dimensional (3-D) treatment planning to optimize dose distribution, and radiographic verification of the treated volume [9]. Advances in computer technology have augmented accurate and timely computation, display of 3-D radiation dose distributions, and dose-volume histograms that yield relevant information for the evaluation of tumor extent, definition of target volume, delineation of normal tissues, virtual simulation of therapy, generation of digitally reconstructed radiographs, design of treatment portals and aids, calculation of 3-D dose distributions and dose optimization, and critical evaluation of the treatment plan [10]. Dose-volume histograms are useful in assessing several treatment plan dose distributions and providing a complete summary of the entire 3-D dose matrix, and showing the amount of target volume or critical structure receiving more than the specified dose. They do not provide spatial dose information and cannot replace other methods of dose display [11]. 3-D treatment planning systems play an important role in treatment verification. Digitally reconstructed radiographs based on sequential CT slice data generate a simulation film that can be used in portal localization and for comparison with the treatment portal film for verifying treatment geometry [12]. Increased sophistication in treatment planning requires parallel precision in patient repositioning and immobilization, as well as in portal verification techniques. Several real-time, on-line verification systems allow monitoring of the position of the area to be treated during radiation exposure. Computer-aided integration of data generated by 3-D radiation treatment planning with parameters used on the treatment machine, including gantry and couch position, may decrease localization errors and enhance the precision and efficiency of irradiation [13].
1.6. Intensity-Modulated Radiation Therapy
- Intensity-modulated radiation therapy (IMRT), a new approach to 3-D treatment planning and conformal therapy, optimizes delivery of irradiation to irregularly shaped volumes through complex forward or inverse treatment planning and dynamic delivery of irradiation that results in modulated fluency of multiple photon beam profiles. Inverse planning starts with an ideal dose distribution and identifies, through trial and error or multiple iterations (simulated annealing), the beam characteristics (fluence profiles). It then produces the best approximation of the ideal dose defined in a 3-D array of dose voxels organized in a stack of two-dimensional arrays [12]. Other approaches to achieve IMRT include the step-and-shoot method, with a linear accelerator and multileaf collimation (MLC), which uses a variety of portals at various angles. The MLC determines photon-modulated fluency and portal shape by the dynamic computer-controlled IMRT being delivered when the configuration of the portals with the MLC changes at the same time that the gantry or accelerator changes positions around the patient. In helical tomotherapy, a photon fan beam continually rotates around the patient as the couch transports the patient longitudinally through a ring gantry. The robotic arm IMRT system (Cyberknife) consists of a miniaturized MV photon linear accelerator mounted on a highly mobile arm and a set of ceiling-mounted x-ray cameras to provide near real time information on the patient’s position and target exposure during treatment [14]. The majority of IMRT systems use 6 MV x-rays, but energies of 8 to 10 MV may be more desirable in some anatomic sites to decrease skin and superficial subcutaneous tissue dose [15].
1.7. Quality Assurance
- A comprehensive quality assurance (QA) program is critical to ensure the best treatment for each patient and to establish and document all operating policies and procedures. QA procedures in radiation therapy vary, depending on whether standard treatment or a clinical trial is carried out, and if such treatments and trials occur at single or multiple institutions. In multi-institutional studies, it is important to provide all participants with clear instructions and standardized parameters in dosimetry procedures, treatment techniques, and treatment [16].
1.8. Principles of IMRT
- The concept of IMRT was not applied until the 1990s. The software and hardware were not available before that time [17]. IMRT is a more advanced mode of conformal radiotherapy and an extension of 3-dimensional conformal radiation therapy (3D-CRT) that includes the use a larger number of x-ray beam compared to 3D-CRT. Therefore, large volumes of healthy tissue are exposed to low levels of radiation [18, 19]. IMRT allows for appropriate conforming of the high and low doses to the target and healthy tissue, by creating non-uniform radiation beam intensities across the irradiation field. This creation can be performed in two ways: step and shoot (static technique) or sliding window (dynamic technique) [14, 19, 20]. Intensity modulated arc therapy (IMAT) is the next step in IMRT radiation delivery, whereby the gantry rotates around the patient and the radiation dose is delivered continuously in an arc [14]. It is possible to summarize the advantages of IMRT in good sparing to critical structures and fairly quick planning. However, the disadvantages include complex QA and longer treatment time.
1.9. Volumetric Modulated Arc Therapy (VMAT)
- Volumetric modulated arc therapy (VMAT) is a novel from of IMRT that allows the radiation to be delivered to the patient in a single 360◦ of gantry rotation that is accurately and efficiently with varying velocities and positions of the MLC, dose rate and gantry speed. This leads VMAT being an intensity-modulated dose distribution [21]. RapidArc (Varain medical system) is a form of VMAT [22]. RapidArc (RA) is intended to protect healthy tissue more than other techniques and to improve target coverage distribution and treatment time, and attain accurate dosimetric delivery to have the ideal dose distribution. VMAT has many different advantages over conventional modality 3D-CRT [20]. The fundamental feature is treatment time. VMAT treatment time was 1.3 minutes, IMRT treatment time was 8 minutes and 3D-CRT was 3 minutes [23]. Other studies have demonstrated a similar decline in treatment time between VMAT and 3D-CRT. Depending on decreased treatment time in the machine, patient comfort, compliance and throughput increased. The main disadvantage of VMAT is the increased optimization time compared to 3D-CRT. Shannon M. MacDonald et al. [24] compared 3D-CRT with IMRT for 20 patients treated for high – grade glioma. The prescribed dose was 59.4 Gy. The authors showed that IMRT was superior in target coverage compared with 3D-CRT plans, and effectively reduced radiation dose to the brain, brain stem and optic chiasm. David Palam et al. [21] compared three techniques: VMAT, IMRT and 3D-CRT for 10 patients with prostate cancer. The comparison showed lower doses to normal critical structure and achieved highly conformal treatment plans in VMAT and IMRT over 3D-CRT plans. Luca Cozzi et al. [25] used a treatment planning system to compare Volumetric Arc Modulation with RapidArc and IMRT for cervix uteri of 8 patients. Both RA and IMRT showed equivalent target coverage. RA improved CI, HI and OARs sparing. Wilko F.A.R Verbakel et al. [26] compared VMAT with conventional IMRT in 12 patients for head and neck cancer. The comparison showed that double arc plans provided at least similar sparing of OAR and better PTV dose homogeneity than single arc or IMRT. Bao–min Zheng et al. [27] compared VMAT with RA and fixed filed dynamic IMRT for 20 patients with nasopharyngeal carcinoma. The prescribed dose was 70 Gy. For both RA and IMRT, the target volume coverage was similar. Peszynska–piorun et al. [28] compared IMRT with 3D-CRT for 25 patients with head and neck cancer. IMRT delivered comparable or greater doses to OARs, while 3D-CRT was found to better spare the organs. Andrea Holt et al. [29] compared VMAT with IMRT in 5 oropharyngeal cancer patients from five institutes. VMAT showed significantly better sparing of OARs and improvement in CI. Kham Nguyen et al. [30] compare VMAT versus IMRT in 10 nasal cavity patients and found that VMAT achieved similar or better target coverage in comparison to IMRT. VMAT plans better spared critical structure and nearly normal tissue from higher dose volumes. IMRT plans were favored in minimizing the volume of low dose received to normal tissue and critical structures. Nima Nabavizadeh et al. [31] compared VMAT with 3D-CRT and IMRT in 20 patients with pancreatic cancer. VMAT and IMRT were shown to be superior over 3D-CRT in planning target volume (PTV) coverage and sparing OARs.
2. Material and Methods
2.1. Equipment Used
2.1.1. Linear Accelerator
- The linear accelerator utilized for treatment planning was the Trilogy equipped with the Millennium Multi leaf Collimator by Varian Medical Systems. It is able to deliver beams of electrons and photons. Only the photon beam is used in this study for all cases with energies of 6 MV, 15 MV and 18 MV. There are 120 leaves total with 40 leaf pairs in the center and 10 pairs on each side. The center leaf width is 5 mm projected at isocenter, while the outer leaves are larger at 10 mm. The maximum leaf speed is 2.5 cm/s. The treatment planning system was the external beam planning system of Eclipse (Version 10.0.28.2, Varian Medical System) and the volume calculation used was the Anisotropic Analytical Algorithm (AAA, version 10.0.28.2). The Progressive Resolution Optimizer (PRO) utilized in the RapidArc optimization was Version 10.0.28.2. Varian’s Leaf Motion Calculator (version 10.0.28.2) was enabled for the IMRT leaf sequence generation (see figure 2.1).
 | Figure 2.1. LINAC machine and MLC |
2.1.2. Radiotherapy Masks
- Perspex and plastic masks are often the basic immobilization device used in radiotherapy to the head and neck area. Masks are fixed to the radiotherapy treatment table. This holds the head and neck in exactly the right position for the treatment because any movement could change the area that is treated and affixed directly on to the treatment table or to a plastic plate that lies under the patient [32]. For the Perspex mask, the technician applies a cool cream or gel to the face and then places strips of plaster of paris bandage on top of this. Holes around the nose and mouth are left so that the patient can easily breathe (see figure 2.2). The mesh plastic mask used in this study was a type of plastic mesh that becomes soft and pliable when heated in warm water (thermoplastic). The mask has many holes in it so that the patient can easily breathe [33] see figure (2.3).
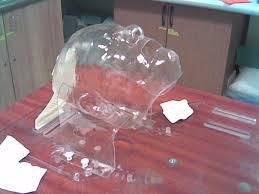 | Figure 2.2. Perspex mask |
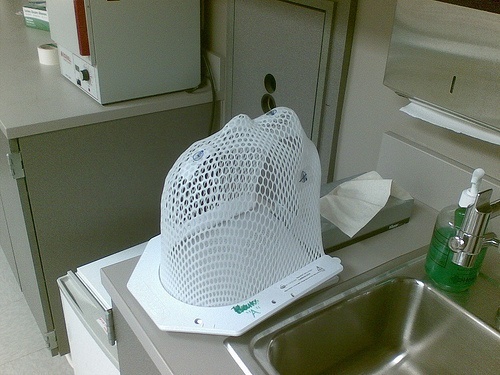 | Figure 2.3. Mesh plastic mask |
2.1.3. CT Simulation
- It is necessary for each cancer center to have CT simulator in the radiation therapy department [33]. CT scan should include the part of the body to be treated with radiation. A slice thickness between 3 mm and 5 mm is recommended for CT scanning except for head and neck, which may be between 2 mm and 3 mm [34]. The CT scanner couch should be flat and comfortable for the patient and compatible with the therapy machine couch. The positioning of laser lights in the CT room must be similar to those in the treatment room to ensure exact positioning of the patient (see figure 2.4). In this study, the patients underwent pervious computed tomography simulation (CT-sim) (GE Light Speed 16 Slice CT) for treatment planning. For all patients, plans were designed on CT scans acquired 5 mm slice thickness, except for head and neck cases that acquired 2 mm slice thickness, and included the region of interest. The patients were positioned supine and straight and level.
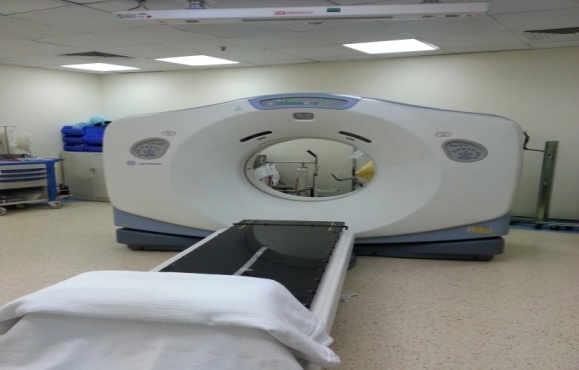 | Figure 2.4. CT scanner |
2.2. Planning Technique
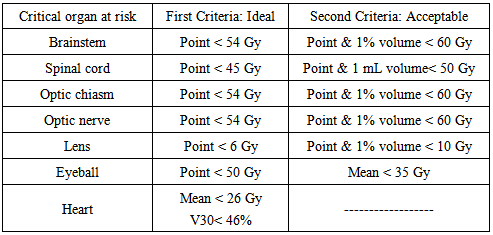
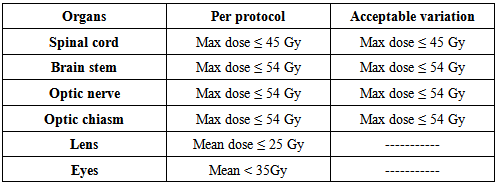
- After simulation, the CT images were transferred to the External Beam planning system of Eclipse using 6 MV and 15 MV photon beam data. The Progressive Resolution Optimizer (PRO) was used for the RapidArc plans. The Anisotropic Analytical Algorithm (AAA) was used for photon dose calculation for all cases. For RapidArc, arcs were used clockwise (181° - 179°) and anticlockwise (179° - 181°), the collimator was rotated 30° to 330° with the dose rate varied between 0 MU/min and 600 MU/min (upper limit) to reduce the effect due to inter-leaf leakage. The double arc technique was expected to achieve better target dose coverage than the single arc because the independent optimization of two arcs allows each arc to create a completely unrelated sequence of MLC shapes, dose rates and gantry speed combinations. For the 3D-CRT plans, all of the gantry angles and numbers of radiation fields (range, 3-4) were manually selected on the basis of the formalism relationship between the PTV and OARs to cover at least 95% of the PTV and spare the OARs. The dose rate of 400 MU/min was used for 3D-CRT. Wedges were used to provide a more homogenous distribution. The optimization constraints for OARs using RapidArc are illustrated in table 2.1.
|
2.3. Compile Patient Database
2.3.1. Patient Selection
- Institutional Review Board (IRB) approval was obtained before the initiation of this retrospective study. The plans of 11 different malignant tumor patients who had received radical RapidArc treatment from 2012 to 2014 at KAMC were randomly selected and re-planned for 3-dimensional conformal radiation therapy. The sample included both male and female patients and the median age was 54 years old (range, 47 - 57 Years).
2.3.2. Patient Anonymization
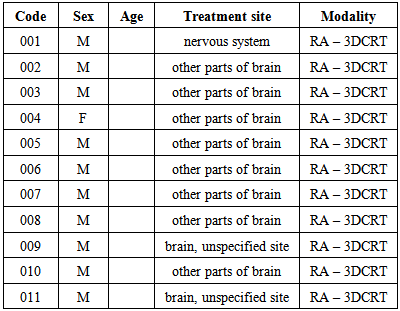
- Patient names, age, sex, treatment site, treatment modality and codes were collected and recorded in an Excel sheet. Each patient was assigned a research code of 0xx, where xx is a number from 01 to 11. The patient's last name and medical record number were replaced by this research code, and all other personal information was removed. Furthermore, the personal information in the image set header files was removed. Table 2.2 lists the cases used for this study, indicating their age, sex, treatment site and modality. A malignant neoplasm is composed of cells that look less similar to the normal cell of origin or an abnormal mass of tissue arising from an abnormal proliferation of the cells. Malignant neoplasms derived from epithelial cells are called carcinomas, which is a cancer that begins in the skin or in tissue that cover body organs. Those derived from mesenchymal (connective tissue) cells are called sarcomas. Malignant brain neoplasms and neoplasms of the immune system are special categories with complex nomenclature [35].
|
2.4. Treatment Plan Evaluation Metrics
2.4.1. Dosimetric Plan Evaluation Metrics
- The dosimetric evaluation metrics used to compare the two plans, in terms of mean, maximum and minimum doses to PTV, were dose to 95% of PTV, Homogeneity Index (HI), Conformity Index (CI), Target Coverage Index (TCI) and Mean and maximum doses to critical organs and normal tissue. The dose to 95% of the PTV (D95%) was used to quantify PTV coverage. The homogeneity index (HI) was used to evaluate uniformity (homogeneity) of dose within the PTV and is calculated as
 | (1) |
 and
and  represent the dose delivered to 5% and 95% of the PTV, respectively. The smaller and closer the value of HI is to 1, the better the homogeneity of the PTV [36]. The conformity index (CI) was also calculated and can be defined as the degree of conformity of the plans, which is a ratio of the PTV receiving 95% of the prescribed dose divided by the volume of the PTV. A CI value approaching 1 indicates a higher degree of conformity.
 | (2) |
 | (3) |
 is the PTV coverage at the prescribed dose (PD) and PTV is the volume of PTV. Target conformity index reports target dose coverage as a value between 0 and 1. A value of 1 indicates an ideal plan with target coverage by prescribed dose. However, a TCI value of 0 indicates the whole target volume is not covered by the prescribed dose [37, 38, 39].
2.4.2. Glioblastoma (GBM) Cancer
- Glioblastoma, the most common primary brain tumor in adults, is usually rapidly fatal. However, for unknown reasons, GBM occurs more commonly in males [35]. Eleven patients whose diagnosis with GBM received 60 Gy per 30 fractions given once daily five days per week (Sunday through Thursday) over a period of six weeks, were included in this study. The median age was 54 years old. CT Scans were performed for the whole brain on a Lightspeed (General Electric) CT scanner with 0.25 cm slice thickness. The patients were positioned supine, and straight and level. A warm wet sheet of plastic mesh was placed over the face to fit around the head and was secured to the table to ensure that the patient is in the correct position during each treatment session. After the CT scan, the images were transferred to the treatment planning system (TPS) to initiate the planning. RapidArc plan was used two full arcs, the first arc rotating in a clockwise direction from 181° to 179° with a collimator angle of 30°. The second arc rotated in the opposite direction from 179° to 181° with a collimator angle of 330° (see figure 2.5), using 6 MV and a maximum dose rate of 600 MU/min. The arcs moved in opposite directions to decrease the off treatment time between the two beams.
 | Figure 2.5. RapidArc plan setup for glioblastoma cancer using two full arcs and gantry angles range from (181°-179°) |
 | Figure 2.6. 3D-CRT plan setup for glioblastoma cancer using three fields |

|
3. Results
- Differences were recorded between those patients who planned with 3D-CRT and those who planned with RapidArc. Thus one patient was selected to represent all other patients in this site for isodose distribution comparison, dose volume histogram (DVH) comparison, dosimetric results for the PTV and dosimetric results for the critical organs. DVHs figures include the PTV and critical organs for each modality and show the percentage of the total volume (y-axis) of each ROI receiving a specified dose (x-axis) in units of Gy.
3.1. Glioblastoma (GBM) Cancer
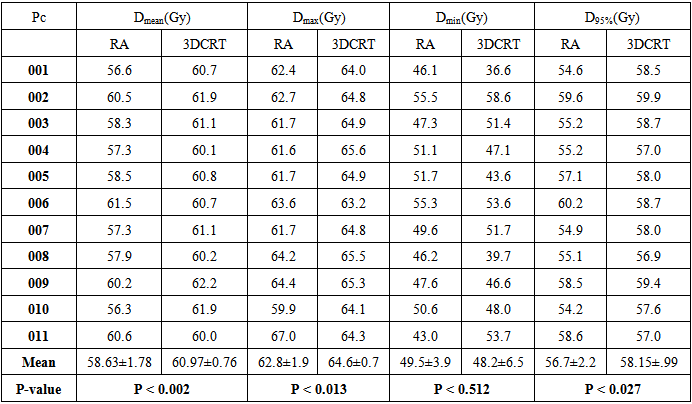
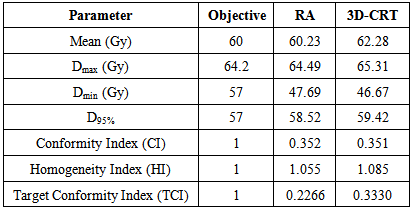
- Table (3.1) shows the mean, max and minimum dose that covered 95% of the target and p-value of the target (PTV) for both modalities. The prescribed dose was 60 Gy.
|
|

3.1.1. PTV
- A statistically significant difference between RapidArc and 3D-CRT in the mean dose to the PTV (p ˂ 0.002) has been observed. The mean value of the PTV was 58.63 ± 1.78 in RapidArc and 60.97 ± 0.76 in 3D-CRT. The maximum dose to the PTV in RapidArc (62.80 ± 1.91) and in 3D-CRT (64.67 ± 0.72) had a lower maximum dose to the PTV (p = 0.013). This results indicates that RapidArc was better than 3D-CRT. The average minimum dose in RapidArc was (49.45 ± 3.89) compared to (48.23 ± 6.49) in 3D-CRT, (p = 0.512). The dose to 95% of the PTV was (56.65 ± 2.20) in RapidArc to (58.15 ± 0.99) in 3D-CRT, (p = 0.027). Conformity index (CI) was approximately equal in both modalities with an average value of 0.626 ± 0.695 in RapidArc compared to (0.624 ± 0.696) in 3D-CRT, (p = 0.462). The average homogeneity index (HI) in VMAT was 1.064 ± 0.019 to 1.091 ± 0.019 in 3D-CRT, (p = 0.000). Therefore, RapidArc achieved an improvement in HI. Target coverage index (TCI) in RapidArc was 0.441 ± 0.619 and 0.522 ± 0.685 in 3D-CRT.
3.1.2. Patient-009
- Patient-009 was a 56-year-old male diagnosed with a malignant neoplasm of the right parts of the brain. After receiving curative dose by RapidArc, 3D-CRT plan was selected for the comparison.
3.1.3. Isodose Distribution Comparison
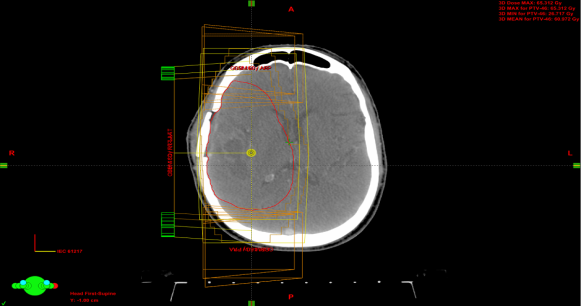
- Isodose distributions for the RapidArc are displayed in figure 3.1 and 3D-CRT in figure 3.2. The 3D-CRT plan contained the PTV receiving greater than 108% of the prescription dose, 65.3 Gy. This was not the case in the RapidArc plan, as the dose distribution within the PTV was more homogeneous. There were hot spots (doses greater than 63 Gy) in the lateral portion of the PTV in the 3D-CRT plan and in the upper portion of the PTV in the RapidArc plan. The distributions showed comparable PTV dose coverage between the two modalities. PTV conformity in the 3D-CRT plan appeared worse than in RapidArc. The 30 Gy lines extended farther to cover the brain in RapidArc than in the 3D-CRT plan. However, a small region of PTV in the 3D-CRT plan was receiving 65 Gy or greater, the PTV dose conformity was greater in the RapidArc plan.
 | Figure 3.1. Isodose distributions for patient-009 showing RapidArc |
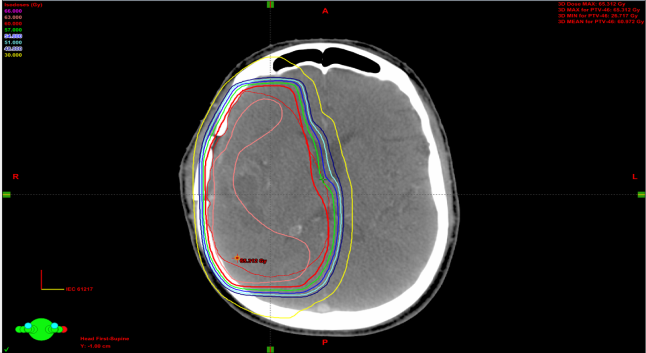 | Figure 3.2. Isodose distributions for patient-009 showing 3D-CRT |
 | Figure 3.3. Comparison of DVHs between RA (squares) and 3D-CRT (triangles). The PTV in red, Brain stem in light green, Optic chiasm in RT yellow line, LT.Optic nerve in LT yellow line, LT.Lens in purple, LT.Eye in light blue and spinal cord in dark green |
3.1.4. PTV-009
- Results for the PTV are shown in table 3.3. The RapidArc plan showed better dosimetric results in the PTV metric for patient-009. The RapidArc plan achieved a lower mean and maximum dose to the PTV. PTV dose coverage, as measured by the minimum dose and the dose to 95% of the volume, was higher in the RapidArc plan. The RapidArc plan also showed a more homogeneous dose distribution in the PTV, achieving an HI of 1.0559 compared with 1.0853 in the 3D-CRT plan. However, the RapidArc and 3D-CRT achieved a similar value of CI and improvement in the TCI value.
|
 lower than 54 Gy, while
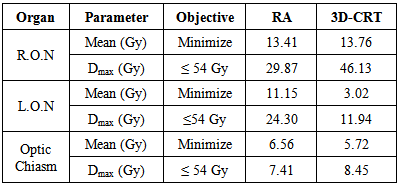
  in 3D-CRT exceeded the tolerance with 54.14 Gy. Similarly, the mean and maximum dose in left optic nerve (LON) was higher in RapidArc than 3D-CRT but within tolerance. The optic chiasms were within tolerance levels in RapidArc and 3D-CRT and were both approximately equal. Although the mean dose was better in 3D-CRT, critical structure was better in RapidArc plan. R.O.N was lower in RapidArc while L.O.N was lower in 3D-CRT and optic chiasm was approximately equal in both techniques.
3.1.5. Organs at Risks (OARs)
3.1.5.1. Optic Nerve / Chiasm
4. Discussion
- The first question addressed by this study was: which is the better option in the treatment of different types of tumor, VMAT or 3D-CRT? Comparison was performed by dose-based analysis on PTV range and critical organs. CI, HI and TCI were calculated. Nearly all of the dosimetric planning goals were met in the VMAT plans for each of the 30 patients in this study and are explained individually for every site. As a baseline for the study, treatment plans were created using two full gantry rotation arcs. Several studies have found that the use of two arcs resulted in better plan quality than using one. Additionally, two arcs were used based upon clinical experience with head and neck planning in King Abdullah Medical City (KAMC), where a single arc was found to be insufficient to achieve dose constraints. The use of two full gantry rotation arcs was not able to obtain better sparing of the left optic nerve, left eye and left lens compared to 3D-CRT. VMAT was able to spare the brainstem and spinal cord better than 3D-CRT for the majority of patients analyzed. Compared with 3D-CRT, VMAT was able to achieve better target coverage. VMAT plan had a better homogeneity index (HI) and target coverage index (TCI) with the PTV and equivalent conformity index (see figures 4.1A, 4.1B and 4.1C). Conformity index reports target dose coverage as a value between 0 and 1. A value of 1 indicates an ideal plan with target coverage with no over/underdosage of target subvolumes, a CI value of 0 indicates the whole target volume is not covered by the therapeutic dose or the existence of a severe cold spot (s) in the target. Figure 4.1A indicates that there were no significant differences in the conformity between the two modalities. The values of 3D-CRT were lower than VMAT, which is an indication of the improvement of the conformity in VMAT modality. This finding is consistent with pervious study that found VMAT capable of superior PTV conformity in head and neck treatment plans. An HI with a value close to 1 indicated better homogeneity. Figure 4.1B illustrates the homogeneity index for both modalities, with VMAT plans showing significantly better PTV homogeneity. Additionally, TCI with a value close to 1 indicated relatively better target coverage. Figure 4.1C shows the disparity in values between the two modalities, where the values of TCI were higher in some cases and lower in others. This is due to target coverage by prescribed dose, where a value of 0 indicates that the target volume is not covered by the prescribed dose. However, not all treatment plans were able to successfully meet each OAR dose constraint due to the close proximity of the PTV, while dose tolerance to critical structures was still maintained. VMAT achieved a better mean dose to central OARs: optic nerves, eyes and lenses.
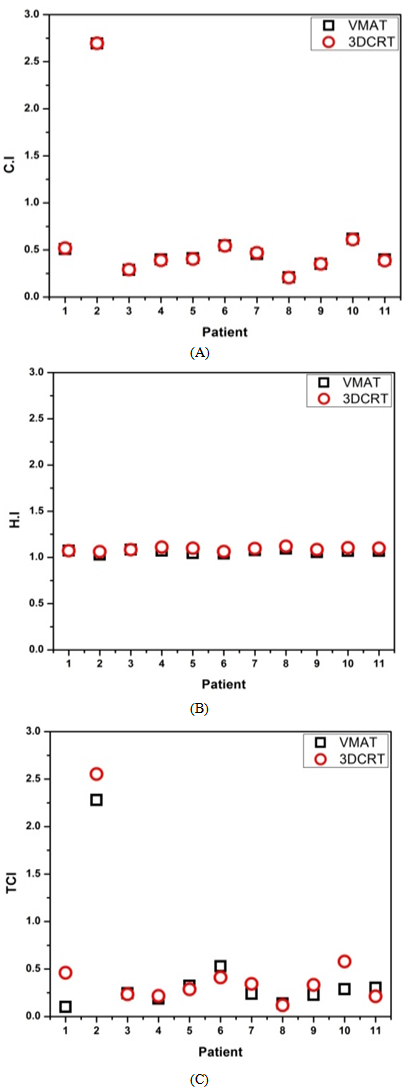 | Figure 4.1. A histogram plot (CI), B histogram plot (Hi) and C histogram (TCI) for 11 glioblastoma cases |
5. Conclusions
- Glioblastoma (GBM) cancer was treated with three dimensional conformal radiation therapy in 11 patients. 3D-CRT resulted in poor dose conformity to the target and high doses to critical organs in some cases. Volumetric modulated arc therapy is a relatively new treatment technology that provides better conformity to the tumor, sparing healthy structures and better low-dose OAR sparing in the lungs and heart. This study has also shown that VMAT is superior to 3D-CRT in term of PTV, conformity and homogeneity, but not in terms of doses to critical organs in some cases. Clinical preference for accepting the VMAT class solution over 3D-CRT treatment was preferred to be determined on a case by case basis. VMAT will be the treatment of choice for tumors requiring PTV conformity and homogeneity that VMAT provides. This study suggests that VMAT class solution is the superior treatment option. The major advantage of VMAT over 3D-CRT is the shorter treatment time. In conclusion, due to the ability of VMAT to generate highly conforming and efficient treatment plans that are clinically comparable to 3D-CRT, the results of this study suggest that VMAT be considered as a viable option for the treatment of various sites of tumors.
ACKNOWLEDGMENTS
- We would like to thanks all staff members of the radiation oncology at KAMC (King Abdullah Medical City), especially Dr. Mohammad Dauod, Dr. Nasser Al-Dhaibani and Dr. Hussain Omar for their help and support in their areas of clinical expertise.
References
| [1] | Perez, Carlos A., and Luther W. Brady., ''Radiation oncology: management decisions’’, Lippincott Williams & Wilkins, 2011. |
| [2] | Govindan, Ramaswamy, ed.,'' The Washington manual of oncology.'', Lippincott Williams & Wilkins, 2008. |
| [3] | Parker, R. G., Janjan, N. A., and Selch, M. T., ''Radiation oncology for cure and palliation.', Springer Science & Business Media, 2003. |
| [4] | Purdy, James A., Carlos A. Perez, and Philip Poortmans., '' Technical Basis of Radiation Therapy: Practical Clinical Applications.'', Springer Berlin Heidelberg, 2012. |
| [5] | International Commission On Radiation Units and Measurements. Prescribing, Recording and Reporting Photon Beam Therapy, ICRU Report50. Bethesda, MD: ICRU, 1993. |
| [6] | International Commission On Radiation Units and Measurements. Prescribing, Recording and Reporting Photon Beam Therapy, (Supplement to ICRU Report50). ICRU Report 62. Bethesda, MD: ICRU, 1999. |
| [7] | Weiss, Elisabeth, and Clemens F. Hess., "The impact of gross tumor volume (GTV) and clinical target volume (CTV) definition on the total accuracy in radiotherapy.", Strahlentherapie und Onkologie, 2003,179.(1): 21-30. |
| [8] | Vokes, Everett E., and Harvey M. Golomb, eds., ''Oncologic therapies.'', Springer Science & Business Media, 2003. |
| [9] | Perez, C. A., Purdy, J. A., Harms, W., Gerber, R., Graham, M. V., Matthews, J. W., and Simpson, J. R., "Three-dimensional treatment planning and conformal radiation therapy: preliminary evaluation.", Radiotherapy and Oncology, 1995, 36,(1): 32-43. |
| [10] | Webb, S, ''The Physics of three dimensional radiation Therapy: conformal therapy, radiosurgery and treatment planning.'', Institute of Physics Publishing, Bristol, UK, 1993. |
| [11] | Cheng, Chee-Wai, and Indra J. Das., "Treatment plan evaluation using dose–volume histogram (DVH) and spatial dose–volume histogram (zDVH).", International Journal of Radiation Oncology* Biology* Physics, 1999 43,(5): 1143-1150. |
| [12] | Mundt, Arno J., and John C. Roeske., '' Intensity modulated radiation therapy: a clinical perspective.'', PMPH-USA, 2005. |
| [13] | Timmerman, Robert D., and Lei Xing., ''Image-guided and adaptive radiation therapy.'', Lippincott Williams & Wilkins, 2012. |
| [14] | Dybwad, Anniken., "Comparison of Dose Distributions resulting from IMRT and VMAT, and Assessment of MLC Leaf Positioning Errors.", 2013. |
| [15] | Chao, KS Clifford, Smith Apisarnthanarax, and Gokhan Ozyigit, eds., ''Practical essentials of intensity modulated radiation therapy.'', Lippincott Williams & Wilkins, 2005. |
| [16] | Ishikura, Satoshi., "Quality assurance of radiotherapy in cancer treatment: toward improvement of patient safety and quality of care.", Japanese journal of clinical oncology, (2008), 38,(11): 723-729. |
| [17] | Connell, Philip P., and Samuel Hellman., "Advances in radiotherapy and implications for the next century: a historical perspective.", Cancer research, 2009, 69, (2): 383-392. |
| [18] | Wu, and Wing-cheung, ''Inverse planning in three-dimensional conformal and intensity modulated radiotherapy.'', Diss. The University of Hong Kong (Pokfulam, Hong Kong), 2004. |
| [19] | Ezzell, G. A., Galvin, J. M., Low, D., Palta, J. R., Rosen, I., Sharpe, M. B., and Cedric, X. Y., "Guidance document on delivery, treatment planning, and clinical implementation of IMRT: report of the IMRT Subcommittee of the AAPM Radiation Therapy Committee.", (2003) , Medical physics, 30.8: 2089-2115. |
| [20] | Mancuso and Gordon Mark., ''Evaluation of Volumetric Modulated Arc Therapy (VMAT) Patient Specific Quality Assurance.'', Brigham Young University, 2011. |
| [21] | Palma, D., Vollans, E., James, K., Nakano, S., Moiseenko, V., Shaffer, R., and Otto, K., "Volumetric modulated arc therapy for delivery of prostate radiotherapy: comparison with intensity-modulated radiotherapy and three-dimensional conformal radiotherapy.", International Journal of Radiation Oncology Biology Physics, 2008, 72, (4): 996-1001. |
| [22] | Salazar and Jessica Emily., ''Optimization of RapidArc for Head-and-Neck Radiotherapy.'', Diss. Duke University, 2011. |
| [23] | Ong and Chin Loon., ''Volumetric modulated arc therapy for stereotactic body radiotherapy: Planning considerations, delivery accuracy and efficiency.'', Amsterdam: Vrije Universiteit, 2012. |
| [24] | MacDonald, S. M., Ahmad, S., Kachris, S., Vogds, B. J., DeRouen, M., Gittleman, A. E., and Vlachaki, M. T., "Intensity modulated radiation therapy versus three-dimensional conformal radiation therapy for the treatment of high grade glioma: a dosimetric comparison.", J Appl Clin Med Phys, 2007 , 8, (2): 47-60. |
| [25] | Cozzi, L., Dinshaw, K. A., Shrivastava, S. K., Mahantshetty, U., Engineer, R., Deshpande, D. D., and Fogliata, A., "A treatment planning study comparing volumetric arc modulation with RapidArc and fixed field IMRT for cervix uteri radiotherapy.", Radiotherapy and Oncology, 2008, 89, (2): 180-191. |
| [26] | Verbakel, W. F., Cuijpers, J. P., Hoffmans, D., Bieker, M., Slotman, B. J., and Senan, S., "Volumetric intensity-modulated arc therapy vs. conventional IMRT in head-and-neck cancer: a comparative planning and dosimetric study.", International Journal of Radiation Oncology* Biology* Physics, 2009, 74, (1): 252-259. |
| [27] | Zheng, B. M., Dong, X. X., Wu, H., Duan, Y. J., Han, S. K., and Sun, Y., "Dosimetry comparison between volumetric modulated arc therapy with RapidArc and fixed field dynamic IMRT for local-regionally advanced nasopharyngeal carcinoma.", Chinese Journal of Cancer Research, 2011, 2, (4): 259-264. |
| [28] | Peszynska-Piorun, Magdalena, Julian Malicki, and Wojciech Golusinski., "Doses in organs at risk during head and neck radiotherapy using IMRT and 3D-CRT.", Radiology and oncology, 2012, 4,(4): 328-336. |
| [29] | Holt, A., Van Gestel, D., Arends, M. P., Korevaar, E. W., Schuring, D., Kunze-Busch, M. C., and van Vliet-Vroegindeweij, C., "Multi-institutional comparison of volumetric modulated arc therapy vs. intensity-modulated radiation therapy for head-and-neck cancer: a planning study.", Radiation Oncology, 2013, 8,(1): 26. |
| [30] | Nguyen, K., Cummings, D., Lanza, V. C., Morris, K., Wang, C., Sutton, J., and Garcia, J., "A dosimetric comparative study: Volumetric modulated arc therapy vs intensity-modulated radiation therapy in the treatment of nasal cavity carcinomas.", Medical Dosimetry, 2013, 38,(3): 225-232. |
| [31] | Nabavizadeh, N., Simeonova, A. O., Waller, J. G., Romer, J. L., Monaco, D. L., Elliott, D. A., and Holland, J. M., "Volumetric-modulated arc radiotherapy for pancreatic malignancies: Dosimetric comparison with sliding-window intensity-modulated radiotherapy and 3-dimensional conformal radiotherapy.", Medical Dosimetry, 2014, 39,(3): 256-260. |
| [32] | Zhang, Q., Li Yu, X., Hu, W. G., Chen, J. Y., Wang, J. Z., Ye, J. S., and Guo, X. M., "Dosimetric comparison for volumetric modulated arc therapy and intensity modulated radiotherapy on the left-sided chest wall and internal mammary nodes irradiation in treating post-mastectomy breast cancer.", Radiology and Oncology, 2012. |
| [33] | Parker, W. I. L. L. I. A. M., and H. O. R. A. C. I. O. Patrocinio., "Clinical treatment planning in external photon beam radiotherapy.", Podgorsak, 2005, I. |
| [34] | Planning Your Treatment: [Cited May, 2013] Available at: Visit website |
| [35] | Aird, E. G. A., and J. Conway., "CT simulation for radiotherapy treatment planning.", The British journal of radiology, 2002, 75,(900): 937-949. |
| [36] | Alvarez-Moret, J., Pohl, F., Koelbl, O., and Dobler, B., "Evaluation of volumetric modulated arc therapy (VMAT) with Oncentra Master Plan for the treatment of head and neck cancer.", Radiation Oncology, 2010, 5, (110): 110. |
| [37] | Kuo, Y. C., Chiu, Y. M., Shih, W. P., Yu, H. W., Chen, C. W., Wong, P. F., and Hwang, J. J., "Volumetric intensity-modulated Arc (RapidArc) therapy for primary hepatocellular carcinoma: comparison with intensity-modulated radiotherapy and 3-D conformal radiotherapy.", Radiation Oncology, 2011, 6: 76. |
| [38] | Yi, B. Y., Ahn, S. D., Kim, J. H., Lee, S. W., and Choi, E. K., "IMRT optimization with pseudo-biologic objective function.", 2002. |
| [39] | Miften, M. M., Das, S. K., Su, M., and Marks, L. B., "A dose-volume based tool for evaluating and ranking IMRT treatment plans.", Journal of Applied Clinical Medical Physics, 2004, 5,(4). |