-
Paper Information
- Paper Submission
-
Journal Information
- About This Journal
- Editorial Board
- Current Issue
- Archive
- Author Guidelines
- Contact Us
American Journal of Medicine and Medical Sciences
p-ISSN: 2165-901X e-ISSN: 2165-9036
2015; 5(4): 175-180
doi:10.5923/j.ajmms.20150504.06
Role of Adipocytokines in the Induction of Experimental Non Alcoholic Fatty Liver Disease
 Abstract
 Reference
 Full-Text PDF
 Full-text HTML
Nevien Mahmoud Ahmed, Madeha Hassan Helmy, Maher AbdEl-Naby Kamel, Mervat Youssef Hanafy
Biochemistry department, Medical Research Institute, Alexandria, Egypt
Correspondence to: Nevien Mahmoud Ahmed, Biochemistry department, Medical Research Institute, Alexandria, Egypt.
| Email: |  |
Copyright © 2015 Scientific & Academic Publishing. All Rights Reserved.
Nonalcoholic fatty liver disease (NAFLD) represents the hepatic manifestation of the metabolic syndrome and covers a large spectrum of liver diseases ranging from benign steatosis to steatohepatitis. There is increasing evidence that adipocytokines are key players in NAFLD. 70 male rats weighted 100-120 gm and divided into two groups control and NAFLD group which fed high fat diet for 14 weeks to evaluate the role of adipocytokines in the induction of NAFLD disease. The levels of adiponectin and tumor necrosis factor –alpha were measured in serum, liver, white and brown adipose tissue, glucose, insulin, insulin resistance by homeostasis model HOMA-IR. triglyceride, total cholesterol, HDL, LDL, aspartate aminotransferase, alanine aminotransferase , gamma-glutamyl transferase in serum and lipid content in liver were determined. From our result we found that adiponectin levels were reduced in NAFLD rats, while TNF-α levels were elevated, significantly, the increase in blood glucose, cholesterol, LDL-cholesterol and lower HDL-cholesterol level in NAFL group compared to control rats from the second week, Hyperglycemia was detected at 8th week of treatment, fasting insulin show a significantly higher level in NAFLD rats from the 4th week of treatment. HOMA-IR show higher degree of insulin resistance from the 6th week and significantly increased levels of triglycerides. Our results suggest that NAFLD is an inflammatory disease and that inflammation is a primary cause for insulin resistance, hyperglycemia, dyslipidemia, steatosis, steatohepatitis, These findings support a complex interaction between adipocytokines and the pathogenesis of NAFLD.
Keywords: Non alcoholic fatty liver disease, High-Fat diet, Adiponectin, Tumour necrosis factor alpha
Cite this paper: Nevien Mahmoud Ahmed, Madeha Hassan Helmy, Maher AbdEl-Naby Kamel, Mervat Youssef Hanafy, Role of Adipocytokines in the Induction of Experimental Non Alcoholic Fatty Liver Disease, American Journal of Medicine and Medical Sciences, Vol. 5 No. 4, 2015, pp. 175-180. doi: 10.5923/j.ajmms.20150504.06.
Article Outline
1. Introduction
- Non alcoholic fatty liver disease (NAFLD) is defined as the accumulation of fat in the liver (conventionally set as more than 5% by weight) in the absence of secondary causes such as increased alcohol consumption and other forms of chronic liver disease. [1]A fatty liver is a consequence of accumulation of various lipids, mostly observed in cases of obesity. [2] Several events might ultimately result in a fatty liver, especially in the context of insulin resistance; increased free fatty acid (FFA) delivery owing to increased lipolysis from both visceral and subcutaneous adipose tissue, and/or increased intake of dietary fat; decreased FFA oxidation; increased de novo hepatic lipogenesis (DNL); and decreased hepatic lipid export via VLDL. [3]Two hits model by Day and James was the first attempt to provide a pathophysiological rationale to the progression of liver damage, claiming that the reversible intracellular deposition of triacylglycerols (first hit) leads to metabolic and molecular alterations that sensitize the liver to the “second hit”, usually referred to as oxidative stress and cytokine-induced liver injury. This model provides a framework to revise the main mechanisms involved in the pathogenesis of hepatic steatosis and its progression to steatohepatitits. [4]First hit: insulin resistance is thought to be inevitably linked to the pathogenesis of NAFLD. [5] This condition classically involves multiple sites: the muscle, where it decreases glucose uptake and utilization, the liver, where it is responsible for the increased production of glucose despite fasting hyperinsulinaemia, and the adipose tissue, where lipolysis is not adequately suppressed by insulin, with subsequent release of glycerol and non esterified fatty acids (NEFA) into the bloodstream. In addition to increased FFA efflux to the liver and increased hepatic de novo lipogenesis, another important source of hepatic triacylglycerol (TAG) is represented by exogenous lipids. During the post-prandial phase, dietary lipids are transported from the gut into the bloodstream in the form of chylomicrons and stored in the liver, where they are processed and assembled with apolipoprotein B-100 (apo B-100) to form VLDL. [6, 7]Second hit: The progression from steatosis to steatohepatitis is likely due to the intersection of multiple mechanisms, probably superimposing on a genetic susceptibility to metabolic and liver damage. Oxidative stress is increased in patients with Nonalcoholic steatohepatitis (NASH). An excess of NEFA supply to the liver increases mitochondrial and peroxisomal β oxidation, promotes microsomal induction of cytochrom-4A1 (CYP4A1) and cytochrom-2E1 (CYP2E1) leading to elevated production of reactive organelle toxicity by an increase in lipid peroxidation with subsequent inflammation and fibrosis. [8]Several adipocytokines have been implicated in the pathogenesis of nonalcoholic fatty liver disease (NAFLD).Adiponectin is the most abundant adipose tissue derived hormone. In the liver, adiponectin is considered to have insulin sensitizing, antifibrogenic, and anti-inflammatory properties by acting on hepatocytes, hepatic stellate cells, and hepatic macrophages (Kupffer cells). [9, 10]Tumor necrosis factor-alpha (TNF-α) a cytokine, has been reported to induce insulin resistance in adipocytes by suppressing proteins essential for insulin-stimulated glucose intake, through inhibition of the insulin receptor proximal signaling, and by inhibiting the expression of peroxisome proliferator-activated receptor gamma (PPARγ). [11]The aim of the study: is to clarify the effect of adipocytokines in the induction of experimental non alcoholic fatty liver disease.
2. Materials and Methods
- Seventy local Wistar male rats weighing approximately 100-120 grams are used. Rats were divided into two groups: control group (group I; n=35) and non alcoholic fatty liver desiese (NAFLD) group, (group II; n=35). The control group was fed a standard diet. The NAFL group was fed high fat diet (HFD) to induce NAFLD for 14 weeks.Five fasting rats were sacrificed each 2 weeks by cervical dislocation and blood samples were collected to obtain serum for the assessment of glucose, insulin, bilirubin, alanine aminotrasferase, aspartate aminotransferase, gamma glutamyl transferase, adipocytokines (adiponectin, TNF-α). The rats were dissected to harvest liver, visceral white adipose tissue, and intrascapular brown adipose tissues for assessment of adipocytokines, and lipid content.
2.1. Biochemical Measurements
- Rat insulin ELISA kit (Millipore) is used for the non radioactive quantitative of insulin in rat sera. Plasma glucose levels were determined according to an enzymatic calorimetric method which has been described by Trinder.The insulin resistance index (IRI) was derived using the homeostasis model assessment (HOMA) as follows:
 | (1) |
 | (2) |
2.2. Adiponectin and Tumour Necrosis Factor- alpha (TNF-α)
- Serum levels of adipokines and cytokines were measured with enzyme immunoassays according to the manufacturer's instructions by using ELISA kits from (eBioscience, USA).
2.3. Histopathological Examination
- Liver tissue specimens from each studied groups were fixed in 10% neutral buffered formalin then washed in running water, dehydrated in ascending series of ethyl alcohol, cleared in xylene and embedded in paraffin wax. Sections of 4μm thick were cut and stained with hematoxylin and eosin stains (H&E) for histopathological investigations.
2.4. Statistical Analyses
- Data are expressed as mean ± SE. All statistical tests were performed with SPSS 20.0. Data were analyzed by two-way ANOVA to assess differences between the groups. The difference between control and NAFLD group was used Student’s – test. P<0.05 was considered statistically significant.
3. Result
3.1. Liver Function Tests
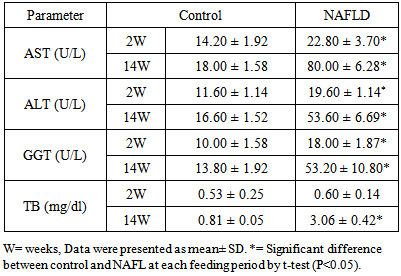
- Normally all liver enzymes (AST, ALT, GGT), and total bilirubin show a slow age-dependant increase. In NAFLD rats induced by HFD, the liver enzymes and total bilirubin were significantly elevated compared to control group from the second week onwards as shown in Table 1.
|
3.2. Glucose Homeostasis Parameters
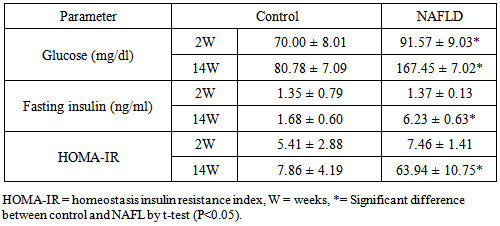
- Blood glucose was significantly elevated in NAFLD rats compared to control rats from the second week of feeding and its level increased directly with the duration of feeding as shown in Table 2. Hyperglycemia was detected at 8th week of feeding and thereafter.
|
3.3. Lipid Parameters
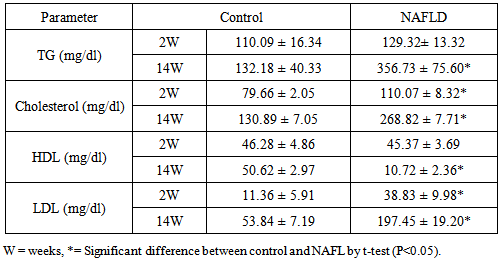
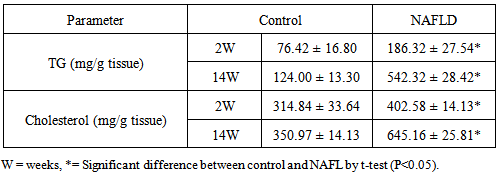
- There are a significant increase in triglyceride, total cholesterol and LDL-C levels in NAFLD rats after 2nd week of feeding rats with HFD which continued to the increase as the duration of feeding increased. Hypertriglyceridemia observed at 6th week while hypercholesterolemia and abnormally high LDL-C were detected after 6th week. In contrast HDL-C was decreased from the 4th week of feeding after which its level shows a significant decrease with the duration of feeding Table 3. The lipid content (triglycerides and cholesterol) of the liver of NAFLD rats showed significantly higher level from the 2nd week of feeding rats with HFD (Table 4).
|
|
3.4. Adipocytokines
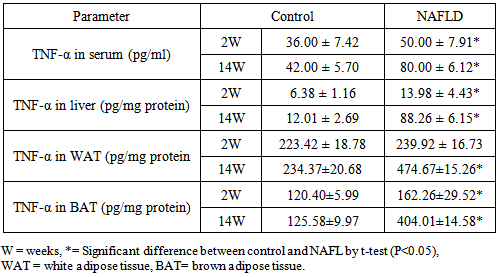
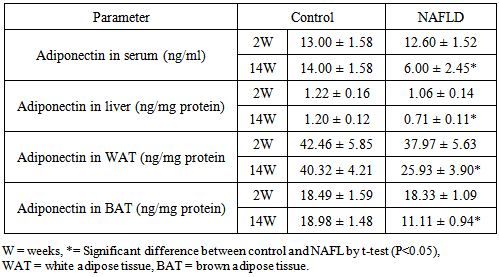
- Serum TNF-α levels were significantly increased in the NAFLD rats at all time points after feeding with HFD compared to control rats. In normal rats the highest content of TNF-α will be observed in white adipose tissues (WAT) followed by brown adipose tissues (BAT) and with the lowest level in hepatic tissues. In NAFLD rats fed with HFD, there was elevation of the tissues levels of the pro-inflammatory cytokine; TNF-α from the 2nd week of feeding and which continued to increase as the duration of feeding increased. Its level was higher at 14th week (Table 5). Reducing serum levels of adiponectin in NAFLD group of rats were observed compared to control which was significant from 8th week of feeding as depicted in the Table 6.
|
|
3.5. Histological Examination
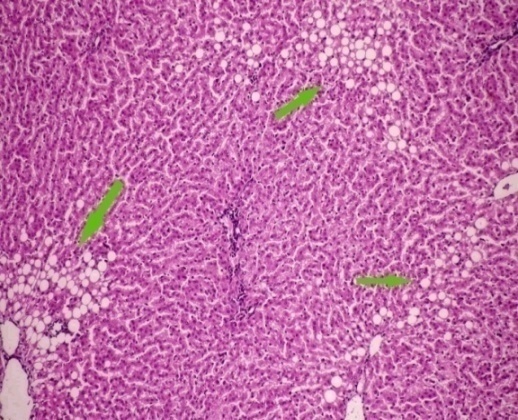
- Histological examination of livers from NAFLD rats demonstrated the progressive development of substantial steatosis with necroinflammatory changes and subsequent development of fibrosis throughout the study period from 2 week onwards Figure 1. After 8 weeks there is mild portal inflammatory as shown in Figure 2, after 12 weeks micro steatosis was observed (Figure 3) and 14 weeks showing macro steatosis (Figure 4).
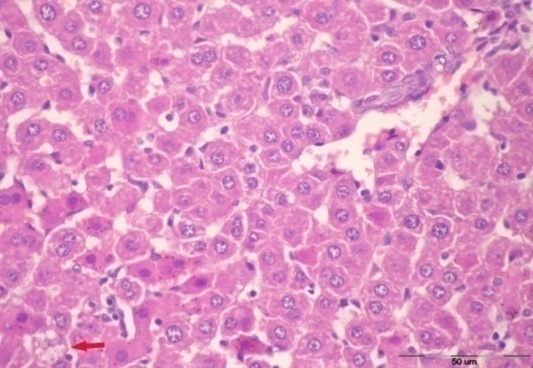 | Figure 1. After 2 weeks showing more or less normal architecture with a single cell showing microvesicular steatosis |
 | Figure 2. After 8 weeks showing mild portal inflammatory infiltrate and multiple scattered foci |
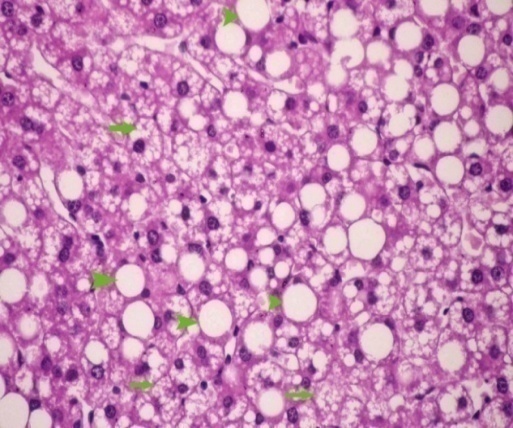 | Figure 3. After 12 weeks showing micro (arrows) & macro (arrowheads) steatosis |
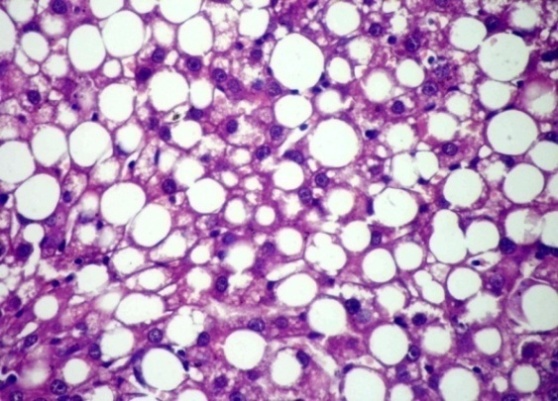 | Figure 4. After 14 weeks showing marked macrosteatosis |
4. Discussion
- In NAFLD multi-organs are involved. The liver and adipose tissues are of central importance. The interest in adipose tissue pathophysiology has grown along with the dramatic increase in the prevalence of obesity. [12]The relationship between the liver and adipose tissue are particularly close. It is remarkable to note that both visceral adipose tissue and the liver share similarities in which metabolic cells (adipocytes or hepatocytes) are in close proximity for immune cells (NK and NKT cells), Kupffer cells, hepatic stellate cells, and endothelial cells or macrophages, and both have immediate access to a vast network of blood vessels. With this configuration, both tissues form a suitable environment for continuous and dynamic interactions between immune and metabolic responses [13]. In fact, this interface might contribute to the emerging importance of these two organs in the initiation and development of metabolic diseases, particularly in the context of type 2 diabetes, obesity and NAFLD [14].During the course of NAFLD in our rats we found that fasting glucose level is significantly higher in NAFLD compared to control rats from the second week of treatment and its level increased directly with the duration of treatment. Hyperglycemia was detected at 8th week of treatment and thereafter also fasting insulin show a significantly higher level in NAFLD rats from the 4th week of treatment. The insulin resistance index (HOMA-IR) show higher degree of insulin resistance from the 4th week and with increasing duration the situation become evident as represented in Table 2. These derangements of glucose homoeostasis during HFD feeding are associated with serious derangements in lipid profile as indicated by significantly increased levels of triglycerides, cholesterol and LDL-cholesterol and lower HDL-cholesterol level from 2nd week of treatment (Table 3). The hepatic lipid content show significantly higher content from 2nd week of induction with abrupt hepatic accumulation after 4th week, this indicates that hepatic TG accumulation proceeds or at least concomitant with hyperinsulineamia at 4th week and insulin resistance which became significant from the 4th week of induction (Table 4). Liver fat accumulation results from a disturbance in the balance between supply, formation, consumption and hepatic oxidation or disposal of triglycerides. The potential sources of lipids contributing to fatty liver include plasma non-esterified fatty acid (NEFA) pool from adipose tissue, newly made fatty acids within the liver through de novo lipogenesis and dietary fatty acids. Nearly 60-80% of liver triacylglycerol is derived from circulating free fatty acids (FFA) [15-17].The increased influx of FFAs to the liver from adipose tissues and diet through portal vein stimulates the hepatic gluconeogenesis and synthesis of triglycerides, impairs the ability of insulin to suppress hepatic glucose output and affects other metabolic insulin effects (insulin resistance) [18].Insulin directs the selection of metabolic fuels for energy production and, in doing so, it is the only hormone committed to the prevention of hyperglycemia [19]. Insulin sensitivity is commonly described as the ability of insulin to lower plasma glucose levels by suppressing hepatic glucose production and stimulating glucose uptake in skeletal muscle and adipose tissue. Insulin resistance describes an impaired biological response to insulin, but there is sufficient variability in normal sensitivity to insulin that there is no specific boundary at which sensitivity ends and resistance begins. [20]Visceral adipose tissue represents a preferential source of adipocytokines potentially acting on the liver tissue. The adipocytokines exert both metabolic and immune functions and mediates the metabolic cross-talk between adipose tissue, muscle and liver. Alteration in the secretion of adipocytokines from adipocytes contributes to metabolic and inflammatory abnormalities such as alteration in the rate of the synthesis of triglycerides in the hepatocytes and increased lipolysis in central adipose tissue [21]. The liver damage in NASH could result from an imbalance between pro- and anti-inflammatory adipocytokines. [22] In the present study we found an interesting pattern of adipocytokines changes. While the serum adiponectin show reduction during induction of NAFLD, the TNF-α show great elevation (Tables 5, 6).It was clear that the elevation of TNF-α precede the reduction of adiponectin by long time; as higher TNF-α was observed from the 2nd week in serum and all tissues while reduction of adiponectin become significant at 4th week in liver, 6th week in adipose tissues and 8th week in serum. These results may confirm the principle role of TNF-α in the early induction of NAFLD and the inhibitory effect of TNF-α on the production of adiponectin. In accordance with our study adiponectin plasma levels were found to be decreased in NAFLD patients and inversely related to hepatic insulin resistance, hepatic fat content [23], degree of inflammation and extent of fibrosis in the liver [24]. High levels of TNF-α and low levels of plasma adiponectin have been indicated as independent predictors of NASH in NAFLD patients [25]. Adiponectin has in general a hepatoprotective and antifibrogenic effect in the liver wound healing process. In the liver, adiponectin increases insulin sensitivity by decreasing the expression of hepatic gluconeogenic enzymes (phosphoenol pyruvate carboxykinase and glucose-6-phosphatase) and the rate of endogenous glucose production. In addition, adiponectin suppresses lipogenesis and activates free fatty acid oxidation [26]. It was reported that NASH patient's exhibit reduced adiponectin levels compared with matched controls or patients with simple steatosis [27] and low adiponectin was associated only with increased steatosis and macro inflammation. Other studies demonstrated a correlation between adiponectin levels and suppression of endogenous glucose, as well as an inverse association of adiponectin with intrahepatic fat [28]. The correlation of adiponectin with hepatic fat content, insulin resistance and altered lipid metabolism has been described in other studies investigating nondiabetic subjects [29]. Hotta et al., have reported a significant negative correlation between circulating adiponectin and triglyceride levels and a positive correlation between adiponectin and HDL cholesterol levels in type 2 diabetes [30], adiponectin levels generally predict steatosis and severity of liver disease although to what extent this is a direct effect or related to the presence of elevation of TNF-α and more severe insulin resistance remain to be addressed [31]. Indeed, Xu et al. demonstrated that adiponectin administration significantly improved fatty liver in mice. Moreover, in adiponectin knockout mice, liver injury and fibrosis were increased [32].The histopathological assessment in this study indicates that even after 2 weeks of feeding HFD some hepatocytes occasionally show microvesicular steatosis while the steatosis is clearly evident after 6 weeks of feeding. From the 8th week of treatment Figure 2 the signs of steatohepatitis (presence of fat and injury to the hepatocytes) were appeared like macrosteatosis, portal inflammation, mononuclear inflammatory infiltration, apoptosis, fibrosis and cirrhotic changes as in Figure 3 and 4.
5. Conclusions
- ● Rats fed HFD are a reproducible model of NAFLD.● Adipocytokines are the main player during the course of NAFLD induction by HFD. ● TNF- α play the main role during the early induction through its pro-inflammatory and lipolytic actions and subsequent induction of insulin resistance.● Reduction of adiponectin during late stage may participates in the progression from benign steatosis into NASH and fibrosis.● The present study for the first time point to the role of brown adipose tissues in the induction of NAFLD however the detailed mechanism needs further investigations.Finally the order of events and the interrelationships between different pathways in the development of NAFLD need further investigation in order to find suitable interventions for the protection or treatment.
Abbreviations
- NAFLD, Non-alcoholic fatty liver disease; NASH, Nonalcoholic steatohepatitis; TNF-α, tumor necrosis factor alpha; HFD, high fat diet; NEFA, non estrifed fatty acid; AST, aspartate aminotransferase; ALT, alanine aminotransferase; GGT, gamma-glutamyl transferase, HDL, high density lipoprotein; LDL; low denstity lipoprotein; HOMA-IR, homeostasis insulin resistance index.