-
Paper Information
- Paper Submission
-
Journal Information
- About This Journal
- Editorial Board
- Current Issue
- Archive
- Author Guidelines
- Contact Us
American Journal of Medicine and Medical Sciences
p-ISSN: 2165-901X e-ISSN: 2165-9036
2015; 5(3): 140-146
doi:10.5923/j.ajmms.20150503.06
Hormonal (Leptin, Prolactin and Thyroxine) and Mineral Profiles of Human Breast Milk during Lactation
 Abstract
 Reference
 Full-Text PDF
 Full-text HTML
Ebuehi O. A. T., Keke M. C.
Department of Biochemistry, College of Medicine, University of Lagos, Lagos, Nigeria
Correspondence to: Ebuehi O. A. T., Department of Biochemistry, College of Medicine, University of Lagos, Lagos, Nigeria.
| Email: |  |
Copyright © 2015 Scientific & Academic Publishing. All Rights Reserved.
Breast milk is a very rich nutritional delicacy for infants. It is nutritionally balanced and contain immunological agents that inactivate the influence of pathogens that cause diseases in children. There has been reports on the potency of breast milk to mothers and children, but the objective of this study is to determine the hormonal (leptin, prolactin and thyroxine) and mineral profiles of human breast milk during the lactation period and to determine the correlation between maternal milk leptin and systemic circulation leptin, prolactin and thyroxine. The changes in some micronutrients, specifically calcium and iron levels during lactation period were also determined. During the first 12 months of lactation period, milk leptin correlated negatively with maternal serum leptin. Other maternal hormones also showed significant correlation. Concentration of milk calcium and iron showed significant decrease and increase respectively during the lactation period and a positive correlation existed between iron levels and lactation months. Conclusively, leptin level in breast milk decreased with lactation period and showed significant relationship with other maternal hormones. Milk calcium and iron levels decreased substantially as lactation period increased, while serum calcium and iron increased slightly as lactation period increased. It is suggested that maternal diet during lactation be supplemented with calcium and iron.
Keywords: Human breast milk, Lactation, Leptin, Prolactin, Thyroxine, Calcium, Iron
Cite this paper: Ebuehi O. A. T., Keke M. C., Hormonal (Leptin, Prolactin and Thyroxine) and Mineral Profiles of Human Breast Milk during Lactation, American Journal of Medicine and Medical Sciences, Vol. 5 No. 3, 2015, pp. 140-146. doi: 10.5923/j.ajmms.20150503.06.
Article Outline
1. Introduction
- In developing countries, survival of most newborn infants depends on breast milk. It has been reported, that the hormonal profile of the breast milk from healthy mothers, consuming diets containing adequate nutrients, breast milk alone may be inadequate to promote optimal health. Therefore, supplemental foods may be needed (WHO/UNICEF, 1995, Kutsky, 1996).Breastfeeding is the optimal method of infant feeding, breast milk provides almost all the necessary nutrients and immunological components a healthy term infant needs, other advantages of breastfeeding includes reduction of incidences and severity of infections, prevention of allergies, possible enhancement of cognitive development and prevention of obesity and hypertension and insulin dependent diabetes mellitus (Zimmerman and Guttman, 2001, Kutsky, 1996).Health gains for breastfeeding mothers, include lactation amenorrhea, early involution of the uterus, enhanced bonding between the mother and infant and reduction in incidence of ovarian and breast cancer. Breastfeeding should be initiated as soon after delivery as possible to promote, protect and support breastfeeding (WHO/UNICEF, 1995).The provision of a specialized maternal body fluid for neonatal nutrition allows birth to occur at an early stage of development and provides a time of intense maternal-infant interaction during early behavioral development. In addition the nutritional reserves of the mother can sustain the infant through a period of famine. In recent times humans, uniquely among mammals, have devised relatively safe and effective alternatives to breast-feeding, a phenomenon which has led to a decline in this practice in most parts of the world (WHO/UNICEF, 1995). These alternatives have several drawbacks: no formula has the same composition as breast milk, bottle-fed infants may be deprived of a nurturing contact with their mothers and, particularly in less developed countries, formula-feeding may be associated with increased exposure to infection and inadequate provision of nutrients. For all these reasons, pediatricians world-wide have recommended that breast-feeding be practiced whenever possible (Kutsky, 1996).Research on the long term effects of breastfeeding on the health of the mother and the infant continue. Some diseases where breastfeeding appears to have a protective effect include, sudden infant death syndrome, diabetes mellitus, Crohn's disease and ulcerative colitis, lymphoma, Celiac disease, elevated cholesterol level in adults, childhood obesity (Lawrence, 1997).The general aim of the present study was to determine the nutritional and hormonal profiles and their corresponding changes throughout lactation period, with emphasis on the hormones: leptin, prolactin and thyroxine, with a view to ascertaining the pattern of changes of these hormones in the breast milk and serum of these lactating mothers for 48 weeks.
2. Materials and Methods
- Inclusion criteria were women who gave birth at term after uncomplicated pregnancies. Exclusion criteria were lactation failure, any existing disease (i.e. maternal disease due to pregnancy or unrelated and pre-existing or neonatal disease), under hormonal and any drug therapy, and body mass index greater than 35.0 at enrolment. Ethical Approval for this study was obtained and informed consents of the volunteers were also obtained.
2.1. Collection of Samples
- Sixty - five blood samples and breast milk (5ml each) were collected. The blood samples were collected via venopuncture from healthy lactating mothers at different months of lactation at private and General Hospitals, Lagos. The blood samples collected in EDTA bottles were spun using Uniscope laboratory centrifuge machine (model SM 112) at 4000 revolutions per minute (rpm) to separate the sample into serum and packed cells. The breast milk samples were collected by manual expression by the lactating mothers and collected in plain sterile tubes.
2.2. Determination of Leptin Concentration
- The ELISA method of Considine et al., (1996) was used. 15µl of each standard, control and samples were dispensed into appropriate wells. 100 µl assay buffer were dispensed into each well and thoroughly mixed for 10sec. The reaction was incubated for 120min at room temperature, without covering the plate. The contents of the well were mixed and then rinsed 3 times with diluted wash solution (300 µl per well). The wells were striked sharply on absorbent paper to remove residual droplets. 100 µl of antiserum were added to each well and then incubated for 30min at room temperature. The contents of the well were thoroughly mixed, the well was rinsed 3 times with diluted wash solution 300 µl per well. A 100 µl of enzyme complex was dispensed into each well and then incubated for 30min. 100 µl of substrate solution were added to each well and then incubated for 15min at room temperature. 50 µl of the stop solution were added to each well to stop the enzymatic reaction. The optical density at 450nm was read with a micro titre plate reader within 10min after adding the stop solution.
2.3. Determination of Prolactin Concentration
- The method of Niall et al., (1974) was adopted. 50 µl of standard, specimens and controls were dispensed into appropriate wells. 100 µl of enzyme conjugate reagent was also dispensed into each well and thoroughly mixed for 10sec and then incubated for 60min at room temperature. The micro titre wells were rinsed 5 times with washing buffer. The wells were striked sharply onto absorbent paper towel to remove residual water droplets. 10 µl of TMB solution were dispensed into each well and gently mixed for 5sec, then incubated at room temperature for 20 min. The reaction was stopped by the addition of 100 µl of stop solution to each well. It was gently mixed for 5sec till the blue colour changed to yellow colour completely. The optical density was read at 450 nm with a micro titre well reader.
2.4. Determination of Thyroxine Concentration
- The procedure of Braun et al., (1983) was used. 50µl of standard, specimens and controls were dispensed in appropriate wells.100 µl of enzyme conjugate reagent was dispensed into each well and thoroughly mixed for 10sec. It was then, incubated for 60 min at room temperature (18-22C). The incubation mixture was removed by flicking the plate contents into a waste container. The micro titre wells were then rinsed and flicked 5 times with washing buffer and striked sharply on absorbent paper to remove all residual water droplets. 100 µl of TMB solution were dispensed into each well and gently mixed for 5sec, then incubated at room temperature for 20min without shaking. The reaction was stopped by adding 100 µl of stop solution to each well and then gently mixed for 5 sec. The optical density was read at 450nm with a microtitre well reader.
2.5. Determination of Serum Calcium and Iron Concentrations
- The concentrations of serum calcium and iron were determined using atomic absorption spectrophotometer (Perkin-Elmer Model 214). Standard protocol and calibration were followed to assay for serum calcium and iron concentrations (Endres and Rude, 2008).
2.6. Statistical Analysis
- Data obtained were analysed using the analysis of variance (ANOVA). Two way ANOVA was used to compare means while One way ANOVA was used to compare intergroup differences followed by Turkey Pairwise multiple comparison method. Pearson correlation (product moment) and multiple regression was used to compare relationships between variables. Graphical analysis was done using a software (prism for windows, version 5.0). All analyses were carried out at p< 0.05.
3. Results
- The leptin concentration was highest in lactation period 1-3mon, gradually decreased from 4-6mon, and the concentration slightly increased at lactation period 10–12 mon. There was no significant (p>0.05) difference in these changes (Fig.1). The mean prolactin concentrations at the different lactation months showed a significant difference. The concentrations were highest at lactation period 4–6mon, followed by 1–3, 10–12 and 7-9mon (Fig. 1).
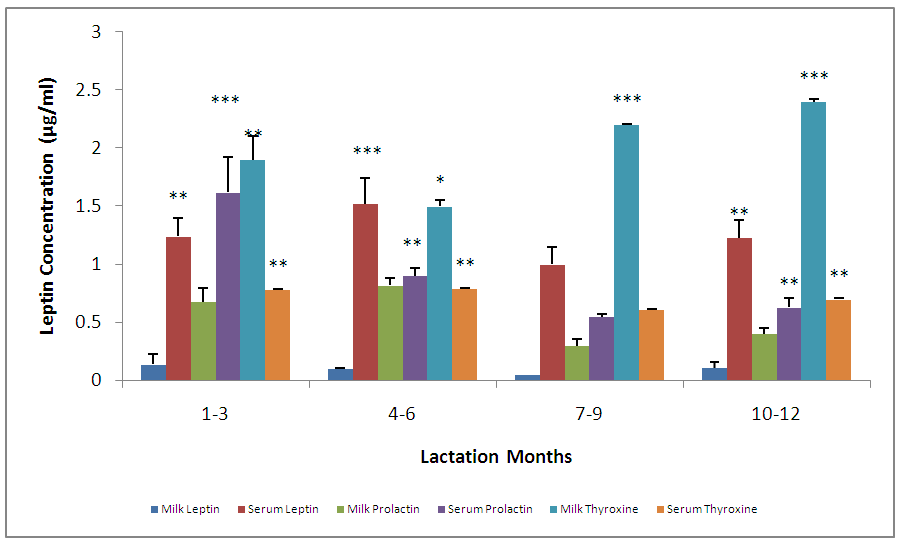 | Figure 1. Mean values (±SEM) of human breast milk hormone and serum hormone concentrations during the lactation period. Brackets indicate differences between groups as determined by a 1-way ANOVA with Turkey's multiple comparison test (**p<0.01, ***p<0.001) |
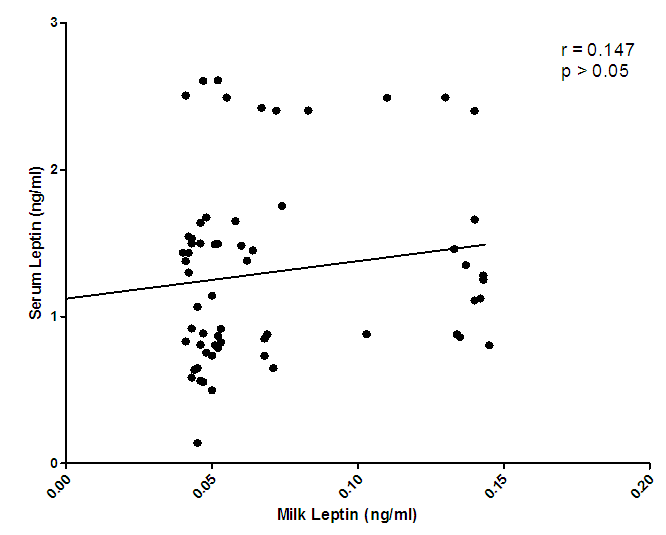 | Figure 2. Correlation of serum leptin and milk leptin levels |
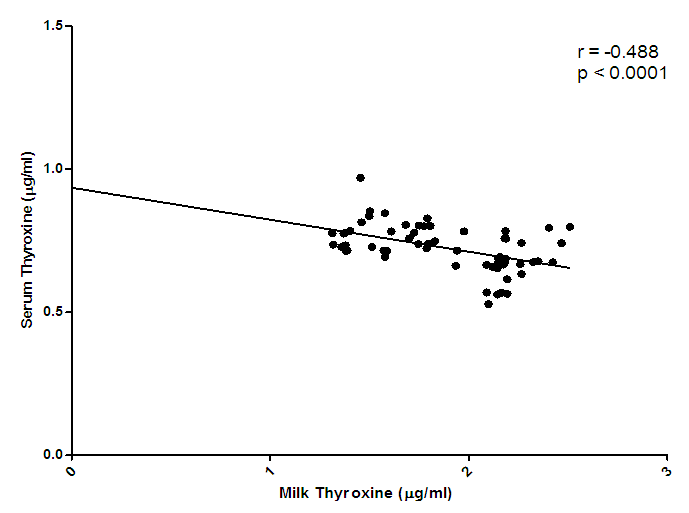 | Figure 3. Correlation of serum thyroxine and milk thyroxine levels |
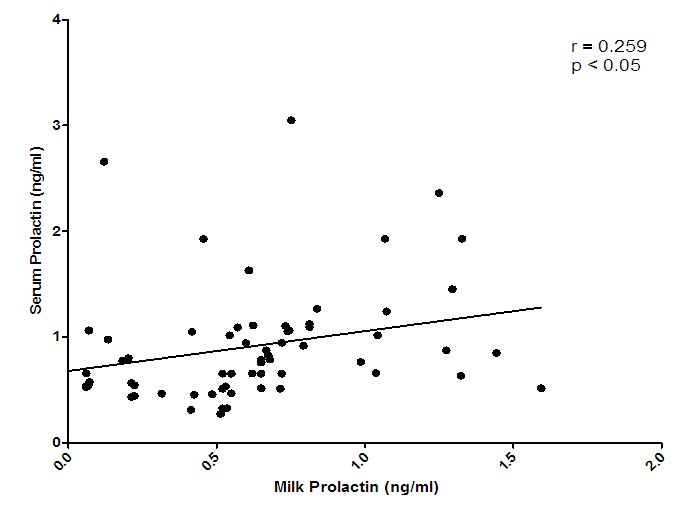 | Figure 4. Correlation of serum prolactin and milk prolactin levels |
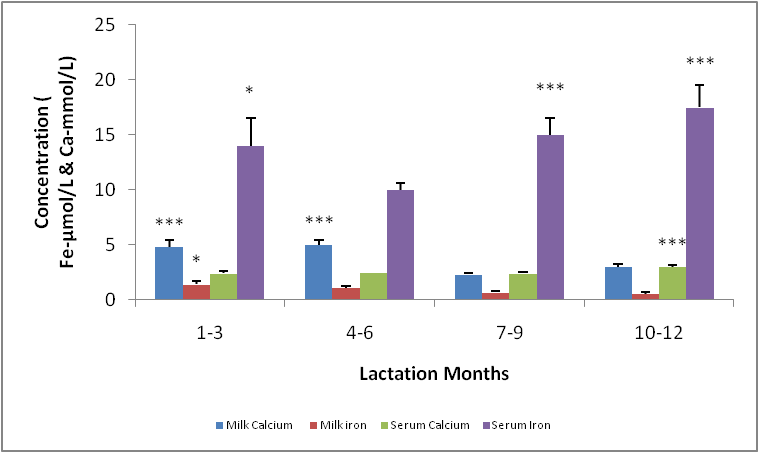 | Figure 5. Mean values (±SEM) of human breast milk and serum calcium and iron concentrations throughout the lactation period. Brackets indicate differences between groups as determined by a 1-way ANOVA with Turkey's multiple comparison test (*p<0.01, **p<0.001) |
- The means and variances for serum calcium concentration in milk were significantly different. The highest concentration was seen at in the group 10-12mon of lactation. For lactation months 1-9, retained a basic concentration with no significant difference. (Fig.5). The mean serum iron concentration in the different lactation groups showed a significant difference (p< 0.05) especially between 1-7, 4-9, 4-12mon the concentration was highest for 10-12, followed by 7-9, 1-3 and 4-7mon (Fig. 5).The micronutrient, namely calcium and iron changes varied considerably, for instance, there was a significant difference between milk calcium and serum iron, serum calcium and serum iron, milk iron and serum iron but no significant difference between milk calcium and serum calcium. The highest concentration of serum iron was found in lactating 10-12mon group (Fig. 5).
4. Discussion
- Changes in leptin concentrations in human breast milk during 360 days of lactation period showed that breast milk leptin concentrations was highest in 1-3mon lactation period after birth, and then fell significantly (p < 0.05). The mean milk leptin levels were not significantly (p>0.05) different. Leptin concentrations in breast milk expressed in 4—6mon, 7—9mon and 10—12mon were lower than the observed concentrations in 1---3mon (p < 0.001) lactation period. (p< 0.01). The variances differed significantly using Bartlett’s test for equal variances (p<0.0001). (F=0.7490, r=0.03553). The leptin levels observed in the current study in breast milk were comparable to most reported values [Casabiell et al., 1997], but much lower than the values mentioned in a previous report [Bielicki et al., 2004]. Maternal leptin may have been transferred to the infant through breast milk and may exert biological effects. Breast milk is the main nutritional source of leptin for breast fed infants for 6mon (Ucar et al., 2000). In previous studies in rats, milk leptin levels fell from early to mid lactation. (Bielicki et al., 2004, Brogan et al., 1999).The mean prolactin concentrations were significantly different (p<0.05). The prolactin concentration changes in breastmilk during 360 days of lactation period, showed that prolactin concentration was highest at 4-6mon lactation period and substantially decreased at 7-12 mon lactation period. The Bartlett’s test for equal variances depicts that the variances do not differ significantly but the multiple comparison test shows that changes in prolactin occurred within the 1—3,4--6, 7—9,10-12mon lactation period and this shows a significant difference.(p<0.05). From the present study, prolactin concentrations increase as degree of fullness of the breast increases (Bennet, 1990), such that the prolactin concentrations for lactating mothers at stage 4-6 mon, was highest. This could be attributed to the fact that their breasts were fullest at this period.The mean concentration of thyroxine was significantly different (p<0.05). The thyroxine concentration changes in breast milk during the 12 mon lactation period revealed that, the level of thyroxine was high at the first three(3) months of lactation and subsequently decreased from 4-6mon lactation period and a steady increase at 7–12mon lactation period. The Bartlett’s test for equal variances show that the variances differed significantly (p<0.05). Lactating women showed more pronounced decrease of thyroxine from 4-12 mon of lactation. This result suggests the effect of lactation on the thyroid activity. This could be due to the loss of iodine and thyroid hormones to the milk (Strabak et al 1976). As for animals, lactation affects the thyroid economy of maternal organisms. Maternal milk definitely affects thyroid function parameters in rats according to Fukuda et al., (1980), the lactation induces a hypothyroid state in rats.The changes in the serum leptin concentrations during the 360 days of lactation, serum leptin, was highest in 4-6mon. The analysis showed that the variances were significant. This group of mothers, may have taken diets rich in essential fatty acids as this has been reported in previous studies, as important for increase in serum leptin levels in lactating women.The changes in mean serum prolactin concentrations were significantly different (p<0.05), (F= 15.89, r= 0.4347).The test for equal variances also showed a significant difference. These changes depicts a high value of prolactin concentration at 1-3mon lactation period and a steady decrease from 4 to 12mon lactation period which showed no significant difference as with other researches, where milk prolactin levels are highest in colostrum and transitional milk. In mature milk the highest prolactin concentration is in the foremilk as reported (Riordan and Auerbach, 2000). In another study, prolactin levels decline slowly over the course of lactation (Battin et al., 1985; Cox et al.,1996), but remain elevated for as long as the mother breastfeeds, even if she breastfeeds for years. Prolactin levels rise with suckling: the more feedings, the higher the level of serum prolactin. More than eight breastfeedings per 24h prevents decline of the concentration of prolactin before the next breastfeeding (Cox et al., 1996).The changes in serum thyroxine concentrations were high at 1-3 mon and relatively decreased as lactation period increased. The variances do not differ significantly. (p>0.05) while the means were significantly different. (F = 23.90, r=0.5363). Evidently, regulation of thyroid hormone T4 in women post partum especially during lactation differs from that in non-pregnant or non- lactating women and this is also supported by previous studies (Iwatani et al., 1987).Milk and serum leptin remains the lowest as it continued to decrease during the lactation period. Milk leptin and milk thyroxine concentrations were significantly different (p<0.05) during the 360 day lactation period. Milk thyroxine and serum thyroxine were also significantly different (p<0.05) especially at 1-3, 7-9, 10-12mon lactation period. Milk leptin and serum leptin showed some significance at 1-6mon of the lactation period. Milk leptin and milk prolactin do not show any significance. Milk leptin and serum prolactin were significant at 1-3mon lactation period. Milk leptin and milk thyroxine showed a positive significance. It was reported that leptin concentrations, in human milk, were inversely related with maternal serum thyroxine levels. Maternal serum thyroxine levels at 1–3mon postpartum were higher, and the relationship between circulating and colostrum leptin concentrations was stronger than that seen with mature milk. Furthermore, serum leptin concentrations in breastfeeding mothers were inversely related to the maternal serum thyroxine levels. These data suggest that thyroxine might have physiological inhibitory effects on milk and serum leptin levels in lactating women. A negative influence of thyroid hormones on serum leptin concentrations have also been observed in experimental rat studies [Wang et al., 2000]. Although many studies in humans on serum leptin levels during thyroid dysfunction revealed conflicting results [Vettor, 2005). A recent report Yaturu et al., (2004), also reported an inverse relationship between thyroid activity and circulating leptin concentrations.The correlation of maternal serum leptin with milk leptin depicting (r=0.147, p>0.05) the correlation was insignificant. There was no correlation between milk and serum leptin concentration during the 360 day lactation period, no correlations were found between breast milk leptin and serum leptin concentration in lactating women, but was contrary in a previous report, where it revealed that there was a correlation between milk and serum leptin concentrations while, the correlation of serum prolactin and milk prolactin (r = 0.259, p<0.05). showed a significant positive correlation. In a previous study carried out, serum prolactin increased in response to stimuli associated with milking, but this response was larger at 8weeks of lactation and then gradually decreased (Koprowski and Tucker, 1973). The correlation of serum thyroxine with milk thyroxine (r = -0.488, p<0.0001), showed a significant negative correlation. Lactating women showed more pronounced decrease of thyroxine. This finding concurs to a previous report by Strabak et al., (1976).For the micronutrient changes, the milk calcium concentrations throughout the lactation period of 12mon showed significant difference (p>0.05), in both the means and variance. There was a steady decreased from 4-12mon lactating period. (F = 24.77, r = 0.5411). The calcium concentrations remained steady at 6months lactation period but decreased thereafter. This is agreement with the report of Yoneyama et al., (1995). Maternal calcium losses occur during lactation which is a normal part of fetal and neonatal development. During lactation, the maternal skeleton loses a small percentage of bone density mass to compensate for calcium loss in breast milk, but is wholly repaired after weaning (Kovacs et al., 2001).The means and variance of the milk iron concentration during lactation period differed significantly (p<0.05). Milk iron increased progressively as the lactation period increased. Although, iron losses in milk during 6mon of exclusive breastfeeding are equivalent to approximately 14% of the average women iron stored. Unless, there was an excessive blood loss at delivery, the total demand for iron during lactation is reduced. Milk iron concentration decreased during lactation.The serum calcium concentration during lactation period showed a progressive change from 1-3 and 10-12mon lactating period, which also demonstrate a significant difference (p< 0.05) during the lactation period in contrast to a previous study where during the first 6mon postpartum, serum calcium concentrations, decreased with increasing time (Specker et al., 1991). It was speculated that the physiological increase in serum calcium concentrations in maternal serum may be related to the physiological increase in serum total protein. The progressive increase in serum iron concentrations were lowest at 1-3mon and increased from 4-12mon lactation period. From Bartlett test for equal variance, the variances were significantly different (p< 0.05) as well as the means. It is speculate that increase in serum iron concentration during lactation period was a result of the fact that a large proportion of iron was bound to one of the milk proteins, lactoferrin.The mineral content of human milk changes over time but is not influenced by maternal stores or intake. ... Human milk contains immune cells, immunoglobulins, lactoferrin, cytokines, nucle-otides, glycans, oligosaccharides, hormones, and bioactive peptides to aid the infant's immature immune (Riordan and Auerbach 2000).
5. Conclusions
- This study shows that breast milk leptin content varies considerably during lactation. Furthermore, this study also provides the second correlations between leptin, prolactin and thyroxine concentrations in breast milk and serum levels of leptin, thyroxine and prolactin. The relationships between the concentrations of milk leptin and maternal serum hormones vary during lactation as well as the macronutrients: calcium and iron, hence supplementation is necessary for lactating mothers and long-term breastfeeding is also encouraged.