-
Paper Information
- Paper Submission
-
Journal Information
- About This Journal
- Editorial Board
- Current Issue
- Archive
- Author Guidelines
- Contact Us
American Journal of Medicine and Medical Sciences
p-ISSN: 2165-901X e-ISSN: 2165-9036
2014; 4(4): 126-138
doi:10.5923/j.ajmms.20140404.05
Benefits Outweigh Costs in Universal Healthcare: Business Case for Reimbursement of Take-home Cancer Medicines in Ontario and Atlantic Canada
 Abstract
 Reference
 Full-Text PDF
 Full-text HTML
D. Wayne Taylor
The Cameron Institute, Cambridge, Ontario N3H 5N4, Canada
Correspondence to: D. Wayne Taylor, The Cameron Institute, Cambridge, Ontario N3H 5N4, Canada.
| Email: |  |
Copyright © 2014 Scientific & Academic Publishing. All Rights Reserved.
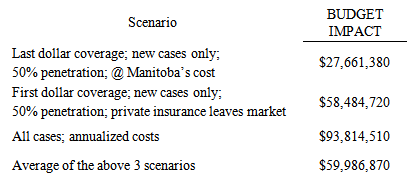
Cancer has the fastest growing prevalence of any non-communicable disease in Canada. Oral and other take-home cancer drugs have been a major game-changer allowing cancer patients to live longer while staying at home without the stressful ordeal of IV chemotherapy. The Canada Health Act only provides for government reimbursement for IV cancer drugs administered in a hospital or cancer centre. In Ontario and Atlantic Canada, patients must personally pay some or all of the cost of medications that are taken at home, even if they are considered the standard of care as part of internationally accepted treatment protocols. A sensitivity analysis was conducted for Ontario on the pool of 9,588 financially vulnerable new cancer patients assuming different levels of oral drug penetration and different drug costs. The last dollar scenario, where the Province steps in after private insurance has paid its share, for a year’s worth of oral cancer drugs for new cancer cases would produce a budget impact of $28 million. For first-dollar coverage the budget impact would be $58.5 million.On an on-going, annualized, first-dollar basis, covering all cancer cases, full coverage would yield a budgetary impact of $93.8 million. Universal funding of oral cancer drugs will save the healthcare system money overall; provide better, more meaningful data; provide better quality of life for cancer patients; provide better purchaser negotiating positions for the procurement of novel prescription pharmaceuticals; and, provide quicker access for patients to life-saving therapy with better outcomes.
Keywords: Oral drugs, Take-home drugs, Cancer, Reimbursement, Universality
Cite this paper: D. Wayne Taylor, Benefits Outweigh Costs in Universal Healthcare: Business Case for Reimbursement of Take-home Cancer Medicines in Ontario and Atlantic Canada, American Journal of Medicine and Medical Sciences, Vol. 4 No. 4, 2014, pp. 126-138. doi: 10.5923/j.ajmms.20140404.05.
Article Outline
1. Introduction
- Cancer is projected to have the fastest growing prevalence of any non-communicable disease in Canada from 2003-2023. According to the Canadian Cancer Society [1], 41% of Canadian women and 46% of men will develop cancer at some point in their lives; over half of those afflicted will die from it accounting for nearly 30% of all deaths in Canada. In total, there were 840,000 Canadians alive at the beginning of 2009 with a cancer diagnosis in the previous 10 years; 30.4% of all cancers afflicted people under the age of 65 years. An estimated 188,000 Canadians were diagnosed with cancer in 2013; 75,500 died from cancer in 2013[2]. Canada ranks below average in overall cancer mortality when compared to Organization for Economic Co-operation and Development (OECD) countries [3].The news is not all bad though. There are more cancer survivors in the country than ever before; 62% of new cancer patients are expected to survive for 5 years or more [4]. Many are living much longer and with a higher quality of life. About half of this improved survival has been attributed to new cancer drugs [5]. Oral and other take-home cancer drugs have been a major game-changer in this regard allowing cancer patients to live longer in their communities without the stressful ordeal of IV chemotherapy. But there have been unanticipated costs to this for the patients, their families and compassionate caregivers.
1.1. Patient Finances
- In addition to the extreme physical and emotional tolls experienced by cancer patients and their families, there is an ever-growing financial burden as well - additional financial challenges to patients, survivors, families, employers, insurance plans and the health care system as a whole. There are disruptions in income-earning power. There are increasingly costly co-payments (75% of private plans have co-pays of 20%) and supportive care costs that deplete savings. In Ontario, 1 in 6 cancer patients reported that out-of-pocket costs were significant or unmanageable.The novel treatment for most cancers today – and increasingly over the past decade as first-line treatment - is chemotherapy delivered by oral prescription drugs – drugs that are taken at home by the patient in lieu of stressful, time-consuming, chemotherapy administered intravenously (IV) in a cancer centre, hospital, infusion clinic, or physician’s office. Five years ago, less than 10% of cancer drugs existed in oral form [6]. One estimate has 48% of cancer drugs orally administered in the community by 2016 [7]; 60% of all new cancer medications currently in development are oral drugs.Cancer drugs are very expensive. Drugs generally, in Canada, are paid for by government drug plans, employer/ private insurance plans, and/or out-of-pocket. Canada ranks second, after only the US, amongst the countries with the highest out-of-pocket drug expenditures; 20% of Canadians’ total drug expenditures are out-of-pocket in the form of premiums, deductibles, co-payments, co-insurance, and cash [8]. Astonishingly, 5% of Canadians spend more than 4% - the “catastrophic” threshold - of their after-tax household income on prescription drugs [9]. For a family, living in one of the five provinces of Ontario, New Brunswick, Nova Scotia, Prince Edward Island or Newfoundland, earning the national average income, and requiring $20,000 of oral cancer drug product per year they can expect to pay anywhere from $2,510 to the full $20,000 [10]. This information is not new. This situation has been around for years and documented 15 years ago by Health Canada [11].In many instances lost income had a larger impact than out-of-pocket costs [12]. Families with a child diagnosed with cancer incur, on average, more than $28,000 in costs [13] in the first three months following a child’s diagnosis – 40% of an average Canadian family’s income in 2011, well above the 4% of income that defines catastrophic drug coverage. In most cases those without private insurance or substantial savings are those in the lowest employment income brackets who can least afford the costs and suffer the consequences of lower survival rates. [14]. Almost all private insurance is provided by employers and/or unions; only 2.4% of private health insurance in Canada is purchased by individuals, with premiums ranging from $1,500 to $3,000 per year [15].Health insurance, whether public or private, should guarantee timely access to medical goods and services while providing protection against unexpected financial burdens from same. But what good are public and private health and drug insurance plans that cover affordable everyday medical care for everyone but do not reimburse or pay-up-front expensive, life-saving, life-improving treatments for the desperately ill? What good are such plans providing care only after such long delays? Patients affected by these waits are not much better off than being uninsured.
1.2. Patient Cost-related Non-adherence
- There is also the issue of patient cost-related non-adherence. It has been well-documented – going back over 20 years to the RAND Health Insurance Experiment [16] - in both Canada and the US that as out-of-pocket costs rise, adherence/compliance in drug utilization declines thus adversely affecting patients’ health and increasing overall system expenses in the long-term [17]. Every year, for the past 10 years, anywhere between 5% (Saskatchewan, Québec) up to 15% (New Brunswick) of Canadians skipped a dose of medication or did not fill a prescription because of the cost [18]. The average cost-related non-adherence rate for Ontario is 9% and for Atlantic Canada it is 12%. The largest non-adherence rates are amongst those age 35-44 years (11.4%); those in fair or poor health (20%); those earning under $20,000 per year at (20.5%); and those with no private drug insurance (26%) [19a].The latest research was a cohort study that showed 31.3% of incident prescriptions were not filled. Drugs in the upper quartile of cost were least likely to be filled. Reduced probability of non-adherence was correlated with the elimination of copayments for low-income groups [19b].
1.3. Other Externalities
- A recent literature review conducted by the Manitoba Division of the Canadian Cancer Society [20] revealed that there were certain groups of people with cancer who were at-risk of incurring a significant financial burden due to their cancer diagnosis and treatment:l individuals/families with high out-of-pocket expenses relative to their income (often but not limited to rural residents who need to travel for their treatments and/or low income individuals/families);l people not covered with private health, medical or disability insurance and/or who work seasonally, part-time or are self-employed; l individuals/families who may not be eligible for private or supplemental insurance;l people with high drug costs; l those with a significant loss of salary (often but not limited to parents with children, who have cancer, who are unable to work in order to care for their children and/or compassionate caregivers who may need to take a leave from work as they care for a loved one in the final phase of cancer); l adolescents and young adults with cancer who are at the early stages of financial independence with no or inadequate private insurance; and,l persons with cancer receiving multiple modality treatments because of high drug costs, long and intense treatments, and the loss of salary (see Figure 1).
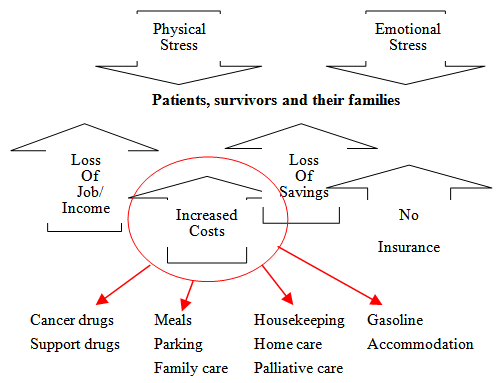 | Figure 1. The growing economic burden of cancer |
1.4. The Economic Facts
- The Canada Health Act provides for government reimbursement for IV cancer drugs because they are administered in a hospital or medical setting. In most provinces, patients must personally pay some or all of the cost of medications that are taken at home, even if they are considered essential as part of internationally accepted treatment protocols. Today half of the newer cancer treatment drugs are taken at home; the burden of drug costs is shifting to the individual while the individual’s ability to deal with this burden is lessening [21].Fifty years ago, Premier Tommy Douglas preached that no one should lose their farm to cover catastrophic health care costs. Yet Sun Life has identified 130,000 households who have mortgaged their homes to cover unaffordable, catastrophic healthcare costs; 40% of Canadians (53% of those 45-54 years of age) are struggling with healthcare costs [22]. Oral and other take-home cancer drugs are part of these costs in Ontario and the Atlantic provinces. In 2013, 14% of Canadians spent more than $1,000 out-of-pocket for health care, and 24% had no confidence in their ability to afford care if they became seriously ill [18]. In the 2013 Bank Debt Report, Manulife reported that the average ratio of Canadian household debt to disposable income was 161.8% [23]. Many Canadians are not confident they will be debt-free at retirement. According to the 2013 Sun Life Canadian Health Index, 38% of Canadians have no group health insurance coverage; 73% do not have personal health insurance; 81% specifically have no money saved for health care expenses; and 20% have no insurance and no money saved [24].A diagnosis of cancer is most often unexpected and planning for out-of-pocket costs takes place in very few if any families [25].A 2010 national study of income loss due to cancer totalling $3 billion calculated that 91 percent of households with a cancer diagnosis suffered a loss of income or rise in expenses as a direct result of that diagnosis [26]. Cancer patient labour participation was reduced 36% and their income was reduced 26.5 % on average. Not only the patient is affected; family and compassionate caregivers typically lost about 25% of their income too. Present value of lifetime earnings lost due to cancer mortality ranged from 1% to nearly 40% [27]. Total productivity lost to cancer 2004-2033 has been estimated by Health Canada to be $540 billion with government revenue losses totalling $249 billion [28].
1.5. Drug Plans not Dealing with Catastrophic Costs
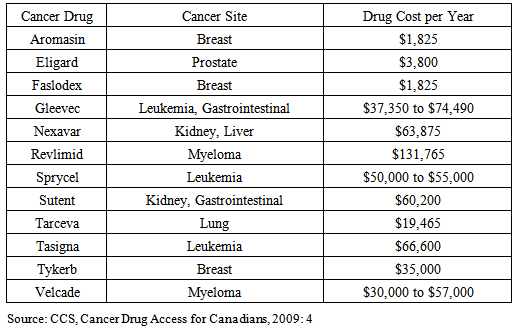
- Canada’s western provinces, Quebec and the northern territories cover the reimbursement of oral cancer drugs for all in need. Ontario and the Atlantic provinces do not [29]. Four of these five provinces have the worst public funding and access to cancer drugs amongst all Canadian provinces [30].In the provinces of Ontario, New Brunswick, Newfoundland and Labrador, and Prince Edward Island – where patients pay anywhere from $2,000 per year up to 12% of net family income before public programmes start to pick up some of the costs - this creates a situation in which there is institutionalized discrimination against those who are not over the age of 65 (amongst whom 30% of all cancers appear) and do not have private insurance coverage, and, those with private insurance coverage but whose plans do not cover the full cost of these drugs over a lifetime, or do not cover drugs at all [31]. In Nova Scotia there is next to no public assistance whatsoever for oral cancer medications. In 2008, only 70% of private drug insurance coverage was “open-ended” in the Atlantic Provinces; 80% in Ontario; and 75% nationally. “Close-ended” private plans operate like provincial government plans restricting access by a managed formulary whereas “open-ended” plans pay for any drug once it is approved for sale by Health Canada and the manufacturer submits an application to the insurer.Many Canadian insurers are now following their American counterparts and invoking moratoria averaging 6 months before a new molecular entity is reimbursed. Amongst current private drug plans 1 in 6 have annual or lifetime spending caps – 70% of these limits are $10,000 [32]. For many privately insured patients this coverage cap falls far short of the actual cost of oral cancer medications (see Table 1). Drug copayments are often 20%; out-of-pocket expenses can range from $15 to over $1200 per claim [33].
|
1.6. Chemotherapy
- The cost of novel drugs is always an issue for payors but, in fact, the incremental cost of new innovative medicines coming on-stream will be no greater than the general consumer rate of inflation in the near and foreseeable future; the impact of the aging population is minimal as the baby boom bulge has yet to reach catastrophic/chronic disease stage en masse; and the patent cliff with its parallel genericization of drugs more than offsets the incremental increase in brand-name product costs if savings are aggressively pursued and captured by insurers, private and public alike [36].What really is at issue is the growing need for care in the community, the growing utilization of medicines in preference to other less cost-effective therapies, and the changing routes of administration. Today there are many routes by which to administer drugs to fight cancer. The most common form of chemotherapy administration is intravenously (IV) which requires the patient to attend a hospital, cancer centre or medical office for a period of time. IV chemotherapy involves physicians, surgeons (to surgically install a port, or portacath), pharmacists, nurses, technicians, allied health professionals and all of the labour costs associated with them; the costs of ancillary supplies, clinic furnishings and technology; the overhead costs of the facility involved; all in addition to the costs of the drugs.About a decade ago a new route of administering chemotherapy emerged. - oral chemotherapy, which is any drug taken by mouth to treat cancer. Oral chemotherapy does away with lengthy hospital visits and the need to repeatedly inject the body with needles; it is taken as a liquid, tablet, or capsule that is swallowed.Oral chemotherapy is just as efficacious and effective as IV chemotherapy. Increasingly, new cancer drug formulations are only in oral form [37]. Oral and other forms of chemotherapy taken by the patient at home is less stressful and time-consuming for the patient and less costly to the health system as visits to a hospital or clinic are reduced [38]. The pharmaceutical industry today is producing more novel oral cancer drugs than IV-administered drugs recognizing both their clinical and economic value as well as the positive impact they have on patients’ and families’ quality of life.
2. No Universality in Canada
- Canada no longer performs exceptionally when compared to other OECD countries when it comes to cancer care [3]. With respect to access to and reimbursement of cancer drugs specifically Canada ranks in the 3rd quartile; and when it comes to first-in-class drugs, Canada ranks in the 4th quartile [39]. Also, there are major inconsistencies amongst the 10 Canadian provinces when it comes to cancer care especially oral chemotherapy.Canadians living in British Columbia, Alberta, Saskatchewan or Manitoba have their cancer drugs paid by the provincial government regardless of their age, income level or whether they are IV and orally administered.Although the funding mechanisms are different, Canadians in Quebec also have both IV and oral cancer drugs reimbursed regardless of age or income level.In the northern territories, oral, take-home cancer drugs are covered by the territorial governments but sometimes with deductibles less than $500.
2.1. The Manitoba Solution
- On April 19, 2012, Manitoba became the most recent province to universally fund oral cancer drugs through the new Manitoba Home Cancer Drug Program (HCD) which is a program for Manitobans diagnosed with cancer that funds eligible outpatient oral cancer and specific supportive drugs, as listed in the HCD Program Formulary, at no cost to the patient. HCD was established with the express purpose of removing a recognized major financial burden. To access HCD patients must be (i) identified by Cancer Care Manitoba (patients managed by Cancer Care Manitoba, Community Cancer Program Network, or community oncologists affiliated with CCMB) as receiving or being scheduled to receive eligible outpatient oral cancer and specific supportive drugs, and (ii) registered with Manitoba Health's Pharmacare Program meeting the following criteria: being eligible for Manitoba Health coverage, and prescriptions for eligible outpatient oral cancer and specific supportive drugs not being covered by other provincial or federal programs [40].
2.2. Changes in New Brunswick
- In December 2013, the Government of New Brunswick introduced the New Brunswick Drug Plan aimed at helping New Brunswickers deal with catastrophic drug costs and ensuring that prescription drug insurance is available to all residents of the province. New Brunswick recognized that, “…when people have access to the prescription drugs they need to manage chronic disease or to prevent or treat illness, they are healthier overall…(t)hey take less time off work…(t)hey visit emergency rooms less often and are less likely to be hospitalized”. The plan covers drugs listed on the New Brunswick Prescription Drug Program Formulary. There is no deductible and coverage will not be denied because of age, gender or pre-existing medical conditions. The plan is to be implemented in two phases. Phase 1 begins on May 1, 2014, when New Brunswickers with a valid Medicare card can choose to enroll in the plan. The graduated premiums will range from $67 per month per adult for individuals earning a gross income of $26,360 or less and families earning a gross income of $49,389 or less, up to $167 per month per adult for individuals earning a gross income of more than $75,001 and families earning a gross income of more than $100,001.From May 1, 2014, to March 31, 2015, New Brunswickers who have private drug plans but still incur high drug costs or need access to a drug covered under the new plan but not through their private plan may join the New Brunswick Drug Plan. Children 18 and younger will not pay premiums but a parent will have to be enrolled in the plan. All plan members will be required to pay 30% co-pay at the pharmacy up to $30 per prescription.Phase 2 will begin on April 1, 2015. At that time all New Brunswickers will be required to have prescription drug insurance with those not insured by a private plan being mandated to join the New Brunswick Drug Plan. Also at this time, minimum coverage standards will come into effect; all private group drug plans will need to be at least as comprehensive as the New Brunswick Drug Plan and its accompanying formulary. This will mean that private group plans will not be allowed to have annual or lifetime caps on coverage; co-payments paid at the pharmacy may not exceed $30 per prescription; co-payments and/or deductibles paid at the pharmacy for each plan member may not exceed $2,000 per year.It is estimated that the total cost of Phase I of the New Brunswick plan will be $50 million, of which $23 million will be paid by plan members and $27 million will be paid by the provincial government. Once the plan is fully implemented, it is anticipated that the total shared cost will be between $120 million and $150 million [41].
2.3. The Ontario and Atlantic Canada Problem
- Unlike the Western Provinces, Ontario and the 4 Atlantic Provinces (even New Brunswick despite its recent drug reimbursement policy initiatives) have “limited universality” when it comes to drug coverage – oral cancer drugs are not reimbursed like IV cancer drugs which are totally covered simply because they are administered in-hospital, even if the former are first-line, life-saving treatments. These differences in policy exist even though the medical needs and the patients’ preferences across provinces are the same [42].Oral cancer drugs, such as Sutent or Votrient, both first-line treatments for kidney cancer, cost $6,000 per month, or $72,000 per year. Others vary from $1,800 to $132,000 per year; three-quarters cost $20,000 or more annually [21]. This amount may exceed various limits placed upon private insurance coverage. In Ontario the government’s Ontario Drug Benefit Program is a formulary-managed drug reimbursement scheme that covers Ontarians over 65 years of age, on social assistance, residing in long-term care or special care homes, receiving professional home care services, or registered in the Trillium Drug Program. In 2012 it funded 102 oral cancer drugs but only for those eligible [43].If you are not a senior or on social assistance in Ontario, you can apply to a special drug program called the Trillium Drug Plan, except there is a co-payment of 4% of your total household income and the same formulary applies. If you have the average after-tax family income for 2010 of $65,500 then you would be out-of-pocket $2,620 of after tax income; if a couple together made $160,000 per year then they would be out-of-pocket $6,400 after taxes. That is providing the patient is willing and/or capable of completing the paperwork for Trillium and is approved for reimbursement [44].Another delay in patient access to life-saving cancer drugs is the common practice of special authorization. Whether a public or private drug insurance plan with a managed formulary the patient’s payor may require that certain criteria be met before it will reimburse certain drugs. In Ontario the Ontario Public Drug Programs has an Exceptional Access Program (EAP) to which physicians may apply for funding of drugs not on the provincial formulary. Circumstances in which this program may apply is the continuation of treatment previously provided through a clinical trial or third party payor, compassionate grounds of a life-, limb-, or organ-threatening nature, or renewal beyond a previously approved funding period. This is the only way for Ontarians to access oral cancer drugs via the government. However, according to the Physician Alliance for Cancer Care and Treatment (PACCT) significant delays in waiting for oral cancer drugs to be approved by EAP initially (2/3 within a month; 1/3 longer [45]), and then renewed every 6 months, results in patients getting sicker, longer remission times, antibodies being developed in the patient thus creating an allergic reaction upon treatment, often a serious progression of the disease, and even premature death.Often the initial application is refused with only the physician – never the patient - being allowed to appeal. The EAP receives over 100,000 requests per year and has been known to be in a backlog [46].l Most private insurance plans have a special authorization process too. However, many private plans’ processes are made more onerous because insurers will sometimes authorize a maximum of three months treatment at a time, necessitating repetition of the process several times a year [45]. Oncologists must spend time completing time-consuming paperwork for their patients, wasting scarce resources. Service providers such as patient navigators and firms specializing in patient access have grown up because of these increasingly complex systems.
2.4. The “Doughnut Hole”
- These inequalities across Canada are contrary to the “five pillars” of the Canada Health Act, which promises Canadians access to medically necessary services “without financial or other barriers”. Times have changed since the Act was written; no one at that time foresaw the monumental progress made in treating cancer at home rather than in a medical institution. What disease-treatment field of medicine can be described more “medically necessary” than access to life-saving cancer drugs?The geographic inequality in treatment across provinces for Canadians with cancer is exacerbated by variations in public and private reimbursement payment systems for cancer drugs. In provinces where oral, or other forms of take-home, cancer drugs for some patients are not included in a universal system of payment, access is determined not by medical need but by an individual’s or their employer’s ability to afford good quality open-ended private insurance. For the five provinces in question, Ontario’s average family income is at the national average and the Atlantic Provinces are all below the national average [47]. There is also inequality within provinces. Rural (and northern Ontario) families experience much higher out-of-pocket costs in terms of travel, accommodation, subsistence, family care, and lost wages than do urban families. In one instance a rural family paid out-of-pocket $25,000 to access the same treatment over a six month period for which an urban family would have been out-of-pocket $2,000 [48]. Another vulnerable segment of the population is youth, both rural and urban. Many young people (especially 18-25), working for a living, do so at or just above the minimum wage level (which in most cases yields an annual income below the poverty line) with no or very sparse employer health insurance benefits [49]. Yet by doing so they are also removed from their parents’ private health insurance plans (unlike dependents that are in post-secondary education). For young people, who live at home with their parents, their parents' incomes as well as theirs is factored into the calculation for the family deductible under provincial pharmacare programs. SiteOut-of-pocket expenses also vary by tumour site. One study showed that breast cancer patients had statistically significant higher out-of-pocket costs than compared with non-breast cancer patients [50]. The major drivers of this finding was the lack of government funding for care once the patient left the hospital or cancer centre, and the lack of at-home treatment options because of inadequate or no private insurance coverage. In a scorecard study of “ease of access” to cancer drugs in 2008, it was not surprising to see Ontario and the 4 Atlantic Provinces (New Brunswick, Nova Scotia, PEI and Newfoundland) as scoring the highest on the “agony factor” [51].Contrary to the rationales for most social programming, education and income are not reliable predictors of need, in this case of inequality, but age and insurance are; patients under age 65 and without private insurance are the hardest hit [52]. In terms that are often used in the US, Ontario and the Atlantic Provinces have a “doughnut hole” of health insurance coverage – a segment of the population left without full coverage.
2.5. Unfulfillment of the Canada Health Act
- The “five pillars” of the Canada Health Act are: universality, accessibility, comprehensiveness, portability and public administration. A lot has changed since 1984 when the Act was promulgated; cancer drug discovery took off in the late 1980`s and has continued at a rapid pace ever since. As has been illustrated throughout this report, the drug policies of Ontario and the Atlantic Provinces, with respect to oral chemotherapy fail when tested against all five pillars.In particular, the fourth pillar of the Canada Health Act, “portability”, is violated by this situation of unequal funding and access. For many cancer patients their drug coverage is not portable across the country. Patients for whom expensive oral cancer drugs are their means of survival can have their access to this lifeline cut simply because they move from one province to another. As oral cancer drug development surpasses and overtakes IV cancer drug development this problem of portability will only get worse. Ontario’s and Atlantic Canada’s lack of funding for oral cancer drugs also ignores the goals of the Canadian Strategy for Cancer Control [53], specifically: increasing access to care; decreasing wait times; improving access to specific treatments at various stages; increasing the quality of life of Canadians and their families living with cancer; and, reducing emotional stress.Specific to Ontario, the lack of universal funding of oral cancer drugs also violates the Guiding Principles of Cancer Care Ontario’s Plan 2011-2015 which are transparency, equity, evidence-based, performance-oriented, active engagement, and value for money [54]. The Cancer Quality Council of Ontario (CQCO) in talking about modernizing cancer care in Ontario has called for maximizing resources and supporting the patient voice - concepts often at odds with each other - but in this instance able to be accomplished simultaneously through the universal funding of oral chemotherapy [55].The CQCO has also cautiously championed personalized medicine in the field of oncology – a medical model that customizes healthcare, clinical decisions, practices, and/or products tailored to the individual patient. Yet the CQCO to date has limited its focus to the narrower definition of personalized medicine that only focuses on the genetic stratification of disease-treatment pairing [56]. What could be more personal in cancer treatment than taking a pill at home versus travelling miles to a clinical setting, being subjected to all of the inconveniences associated with institutional healthcare, being injected with an IV line, and waiting hours for the treatment to end, then travelling home again?
3. Cost-effectiveness
- There is a direct correlation between the rise in the prevalence of non-communicable chronic disease, with cancer in the lead, and lost economic output. The most cost-effective treatment of cancer is both a health imperative as well as an economic imperative. There is clear evidence that insurance plans that have used data mining and predictive modeling to stratify patients have been particularly successful in tackling cancer and other chronic diseases in a cost-effective manner [17]. Singularity in approach or administration of care is expensive. According to Sir Mike Richards, in his seminal report to the Secretary of State for Health in the UK in July 2010, Canada fails to receive value for money spent on healthcare [58]. The two major drivers of rising chemotherapy costs are the high cost of drugs and staffing [59].Drug costs have been tackled relentlessly in Canada. Retail prices of innovative products are controlled; generic prices have been reduced; purchasing economics explored. The most recent study concluded:- the small impact of patented drugs on total health costs means even the most extreme rationing of new medicines will not return significant overall savings for the health system;- the economics and evidence on patented drug prices do not suggest significant savings can be gained by further regulation or by leveraging the monopoly buying power of governments; and,- cost containment efforts that reduce access to new medicines are socially and economically counter- productive [60].There is still room for gains in generic pricing and volume purchasing – which should be pursued - but Pareto optimality suggests that there is probably more to be gained now by switching attention to labour costs.From 2007-2012 total direct spending on patented drugs rose only 4.1% when compared to the rest of healthcare spending which increased 30.5%, approximately three-quarters of which was fees-for-service, wages, salaries and benefits [60]. In current dollars, that translates into an actual 1.8% reduction in patented drug spending while the rest of healthcare costs increased 23.2%. When just total Provincial/Territorial government spending on patented prescribed drugs was isolated from the aggregate data, the decline in current dollar spending was 8.2%.Any change in therapy administration that can reduce staff expenses should be considered seriously – not in the interest of reducing the labour component but making it more productive, i.e. tackling the throughput issues of waiting times that pervasively plague the Canadian system like no other in the industrialized world. In September 2013 wait times, for Cancer Care Ontario, were beyond safety standards. The time between a referral to a specialist and the time that the specialist consulted with the patient was, on average, less than 70% on the target of 14 days. The time between a specialist consult with the patient and the time the patient received his or her first chemotherapy treatment was only 60% within the target of 28 days [61]. In Canada there is no provincial or national guideline for a safe waiting time from specialist consult to a patient's first oral chemotherapy pill.Centres of excellence – such as regional cancer centres – often are defined by their technology. Radiation bunkers and chemotherapy suites have proliferated – as they should – and have been driven by technology and by the fact that institutional care is covered by government funding. Unlike industry where technology generally replaces labour, healthcare technology adds to labour costs. Given that the demand for health professionals at any given time in most provinces over the past few decades has exceeded supply, the unit cost of labour has skyrocketed compared to a relatively flat rate for recent consumer inflation and industrial wages increases [62]. Much of this wait is due to limited access to MRI imaging and other diagnostic and laboratory testing needs. If oral cancer drugs were funded like IV drugs the only wait time for oral cancer drug treatment would be the time for a patient to get a prescription filled. In the provinces of British Columbia, Alberta and Saskatchewan the patient literally leaves the oncologist's office, proceeds to the pharmacy at the cancer centre, and goes home with the drug in hand. Oral treatments are more cost-effective than IV treatments. Numerous studies have evidenced this fact. Savings by this means could be used as a wait time strategy with more patients being treated for cancer. Blue Cross has determined that, when take-home medicines are only partially covered by private insurance or not reimbursed at all, one in six cancer patients with high out-of-pocket costs abandon their medication thus negatively affecting their health as well as long-term health system costs [63]. Full reimbursement by government drug plans would eliminate one of the major barriers to adherence in take-home oral chemotherapy.One population-based study compared the cost of oral capecitabine to IV taxane-based chemotherapy as a first line treatment of metastatic breast cancer. The annual cost of oral chemotherapy in this case was $35,842 compared to $43,353 for the IV therapy. This produced a savings of 17%. Moving six metastatic breast cancer patients onto oral chemotherapy would save enough money to add a seventh patient to the IV treatment group that otherwise would be waiting for treatment and possibly facing worse outcomes because of the wait. Administrative expenses including physician and nursing time accounted for 10% of the IV costs in this study [64].Assuming a regional cancer centre that experiences 25,000 systemic treatment visits per year could reduce its unit costs at least 17% by using oral cancer drugs where possible, then 4,250 visits could be offered to additional new patients waiting for IV chemotherapy at the centre. Another study of oral capecitabine as an adjuvant therapy for Dukes’ C colon cancer demonstrated a 57% savings over IV chemotherapy with fewer side effects, fewer adverse events, fewer relapses, over 75% fewer hospital visits required, less support medications, and 60% less travel time for patients. The clinical results were just as good if not better than the IV administered 5-FU/LV. It was, in fact, determined to be the dominant therapy in terms of quality-of-life months gained and costs saved [65]. Yet another study showed that IV chemotherapy administration procedures and other clinic visit-related services for lung cancer patients accounted for 42-48% of the cost of IV chemotherapy treatment, much of which could be avoided due to the increased availability and utilization of oral chemotherapy drugs [66].Besides the lower or same cost of the oral drug compared to the IV drug, there are also savings in the number of clinic visits required, in one case involving colon cancer patients going from 30 visits for IV patients down to only 8 for patients taking oral medication – 73% fewer visits [67]. In addition to the monetary savings the oral form of chemotherapy, as efficacious as the IV form, was also shown to be more clinically effective with fewer complications, significantly higher relapse-free survival rates, less serious and more manageable side effects, less time-consuming because of the elimination of travel to and from clinic, and more convenient and less stressful for the patients on the oral medication [68].Evidence-informed, patient-based funding is 30 years old, pioneered in the US and adopted throughout the industrialized world yet Ontario and the Atlantic Provinces have yet to do so.
4. Method
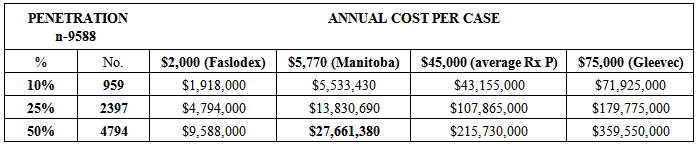
- Where to start? Due to space and time limitations the analysis was conducted only for Ontario but can be easily adapted for use in any one of the four Atlantic Provinces. How many new cases of cancer were there in Ontario in 2013? According to the Chronic Disease Surveillance and Monitoring Division, Public Health Agency of Canada and the Canadian Cancer Registry database at Statistics Canada, there were 187,600 new cases of cancer in Canada in 2013 with 71,900 (38%) of them being in Ontario [69]. Given the age distribution of new cancer cases currently in Ontario, 21,858 of those new cancer cases in Ontario would be under the age of 65 years [70]. Given the proportion of Ontarians under the age of 65 years on social assistance, of one kind or another, 1,587 of those cases would be patients on social assistance leaving 20,271 not [71]. Assuming, for Ontarians under age 65 the average private insurance coverage, 38% of these cases (7,703) would not be privately insured and 15% of those insured would have limited private insurance coverage (1,885), for a total of 9,588 financially vulnerable cancer patients in Ontario in 2013.A sensitivity analysis was conducted on this pool of 9,588 financially vulnerable cancer patients assuming different levels of oral drug penetration and different drug costs. Population penetration rates of 10%, 25% and 50% were used. Faslodex, an oral drug for breast cancer, was used for the low end cost; Gleevec was used for the high end. In-between costs were the average cost in Manitoba, calculated using their estimated case numbers and budget of $10 million which includes reimbursement for all oral cancer drugs and support drugs [72], and the average cost of the cancer drugs identified in Table 1.
5. Results
- The first scenario is the “last dollar” scenario, where the Province steps in after private insurance has paid its share. Most probably, half of the financially vulnerable new cancer case population (4,794) would be administered oral chemotherapy at approximately the same unit cost as that in Manitoba ($5,770) producing a budget impact of $28 million – 6/10ths of 1% of Ontario’s 2012 total drug expenditure, or about 10% of the existing oral cancer drug budget [73] - for a year’s worth of oral cancer drugs (see Table 2).
|
|

|
6. Discussion
- There are more cancer survivors in the country than ever before; 62% of new cancer patients are expected to survive for 5 years or more [4]. Many are living much longer and with a higher quality of life. About half of this improved survival has been attributed to new cancer drugs [5]. Oral cancer drugs have been a major game-changer in this regard allowing cancer patients to live longer in their communities without the stressful ordeal of IV chemotherapy. Take-at-home, oral cancer medicines are safe, efficacious, clinically effective, and less expensive to administer than IV chemotherapy. For the patient there is less stress, less inconvenience, lower risk of hospital-acquired infection and complications. It is quite within the realm of probability that a $28-$58 million investment today by the Government of Ontario in safe, cost-effective oral cancer and support medicines for home use will lead to, at least, if not more than, a 17% reduction in chemotherapy unit costs, yielding timely quality, patient-focused, and value-for-money care all around. The same holds true, proportionally, for the Atlantic Provinces.Overall, the budgetary increase in oral cancer drugs for Ontario could range from $28 million (first dollar) to $58 million (last dollar) to $94 million (annualized) - averaging $60 million. As a percentage of the total drug budget for the Province this ranges from 0.6% to 1.2% to 2.1% - averaging 1.3%.The universal funding of take-home cancer drugs yields a sizeable economic/societal return on investment (E/SROI). Using today’s low-end monetary value of $200,000 for one patient/year of life extension [74], the E/SROI on an annual per case expenditure of $5,770 on oral cancer therapy is 3,466%. Even for patients taking Gleevec at home the E/SROI would be 266.6% for a year’s life extension (see Table 5).
|
7. Conclusions
- Universal funding of oral cancer drugs save healthcare systems money overall, provide better, more meaningful data for clinical, outcomes and systems researchers, better quality of life for cancer patients, their families and compassionate caregivers, better purchaser negotiating positions for the procurement of novel prescription pharmaceuticals, and, above all, quicker access to life-saving therapy with better outcomes. Wait times for oral cancer drugs can be eliminated. Universal funding of oral cancer drugs is the equitable thing to do for a country that espouses its universality in healthcare. Cancer patients, their families and compassionate caregivers should not be systematically discriminated against simply because of their place of residence, their age, their gender or their income level in a supposed universal healthcare system. The financial, emotional and physical costs of dealing with cancer are significant enough without adding to them the costs of a preferred, often indicated, and sometimes only treatment modality. Universal coverage of oral cancer drugs in Ontario and, by extension, the Atlantic Provinces is not only equitable but cost-effective.
ACKNOWLEDGEMENTS
- The study was funded by an unconditional grant from Kidney Cancer Canada.
References
| [1] | http://www.cancer.ca/en/cancer-information/cancer-101/ cancer-statistics-at-a-glance/?region=on. |
| [2] | Public Health Agency of Canada, Statistics Canada, Canadian Cancer Society, Canadian Cancer Statistics 2013, Ottawa, 2013: 6. |
| [3] | Health Canada, Benchmarking Canada’s Health System: International Comparisons, November 21, 2013: 13; OECD countries include: Australia, France, Korea, Slovak Republic, Austria, Germany, Luxembourg, Slovenia, Belgium, Greece, Mexico, Spain, Canada, Hungary, Netherlands, Sweden, Chile, Iceland, New Zealand, Switzerland, Czech Republic, Ireland, Norway, Turkey, Denmark, Israel, Poland, United Kingdom, Estonia, Italy, Portugal, United States, Finland, Japan. |
| [4] | Canadian Cancer Statistics, 2011. |
| [5] | F. R. Lichtenberg, The Impact of New Drug Launches on Longevity: Evidence from Longitudinal, Disease-Level Data from 52 Countries, 1982–2001, International Journal of Health Care Finance and Economics, Vol. 5, No. 1, 47-73. |
| [6] | M. Ogaily, Give patients equal access to drugs, Lansing State Journal, November 15, 2013. |
| [7] | Accessed January 7, 2014 athttp://www.cqco.ca/common/pages/UserFile.aspx?fileId= 291365. |
| [8] | The Rx & D International Report on Access to Medicines, 2009/2010: 17; also, Morgan S, et al.; Toward High-Performing “Pharmacare” Systems: A Review of Experiences in Seven Countries, Working paper presented at the 2008 Annual Conference of the Canadian Association for Health Services and Policy Research, Gatineau QC, May 2008. |
| [9] | Statistics Canada, Table109-5012 - Household spending on prescription drugs as a percentage of after-tax income, Canada and provinces, annual (percent), CANSIM (database) (Accessed January 10, 2014). |
| [10] | Canadian Cancer Action Network, Issues of Access to Cancer Drugs in Canada, April 2008, 26. |
| [11] | Applied Management, Canadian Access to Insurance for Prescription Medicines: Vol. 2 The Uninsured and the Underinsured, Ottawa: Health Canada, 2000. |
| [12] | Longo, C., Fitch, M., Deber, R., Williams, A.P., “Financial and Family Burden Associated with Cancer Treatment in Ontario, Canada.” Support Care Cancer 14: 1077-1085. |
| [13] | Tsimicalis, A., Costs Incurred by Families of Children Newly Diagnosed with Cancer in Ontario. University of Toronto, 2010. |
| [14] | C. M. Booth, G. Li, J. Zhang-Salomons, W. J. Mackillop, The impact of socioeconomic status on stage of cancer at diagnosis and survival : A population-based study in Ontario, Canada, Cancer, Vol. 116, No. 17, 4160–4167. |
| [15] | Canadian Life and Health Insurance Association; Facts 2008. |
| [16] | E. B. Keeler, Effects of Cost sharing on Use of Medical Services and Health, Journal of Medical Practice Management, Vol. 8, No. 1, 11-15. |
| [17] | R. Freeman, K. M. Lybecker, D. W. Taylor, The Effectiveness of Disease Management Programs in the Medicaid Population, Hamilton ON: The Cameron Institute, 2011; R. Tamblyn, et.al. Adverse events associated with prescription drug cost-sharing among poor and elderly persons, JAMA, Vol. 285, No. 4, 421; X. Liac, et.al., The impact of cost sharing of prescription drug expenditures on health care utilization by the elderly: Own- and cross-price elasticities, Health Policy, Vol. 82, Issue 3, 340-347; A.H. Anis, et.al., When patients have to pay a share of drug costs: effects on frequency of physician visits, hospital admissions and filling of prescriptions, Canadian Medical Association Journal, Vol. 173, No. 11, 1335; W. J. Ungar, et.al., Effect of Cost-Sharing on Use of Asthma Medication in Children, Arch Pediatr Adolesc Med. Vol.162, No. 2, 104; J. A. Doshi, Impact of a Prescription Copayment Increase on Lipid-Lowering Medication Adherence in Veterans, Circulation, Vol. 119, No. 3, 390; D. P. Goldman, et.al., Prescription Drug Cost Sharing: Associations With Medication and Medical Schoen C et al.; Toward higher-performance health systems: adults’ health care experiences in seven countries; Health Affairs, Vol. 26, No. 6, p. w717, 2007; J. Kennedy, S. Morgan, A Cross-National Study of Prescription Non-Adherence Due to Cost: Data from the Joint Canada-United States Survey of Health, Clin Ther Vol. 28, No. 8, 1217; M. Mathews, et.al., How important are out-of-pocket costs to rural patients’ cancer care decisions? Can J Rural Med, Vol. 14, No. 2, p. 54, 2009; J. D. Piette, et.al., A conceptually based approach to understanding chronically ill patients’ responses to medication cost pressures, Social Science and Medicine, Vol. 62, 846-857; B. A. Briesbacher, et.al., Patients At Risk of Cost- related Medication Non-adherence: A Review of the Literature, Journal of General Internal Medicine, Vol. 22, 864-871. |
| [18] | Health Council of Canada, Where you live matters: Canadian view on health care quality, Toronto, January 2014: 6. |
| [19] | [a] M. R. Law, et.al., The effect of cost on adherence to prescription medications in Canada, CMAJ, Vol. 184, No. 3, 297-302. [b] R. Tamblyn, T. Eguale, A. Huang, N. Winslade, P. Doran, The Incidence and Determinants of Primary Nonadherence with Prescribed Medication in Primary Care: A Cohort Study, Annals of Internal Medicine, Vol. 160, No. 7, 441-450. |
| [20] | C. Nelson, The Financial Hardship of Cancer In Canada: A Literature Review. The Canadian Cancer Society Manitoba Division, 2010. |
| [21] | Canadian Cancer Society, Cancer Drug Access for Canadians, 2009; many of these drugs directly treat the cancer, while others are support drugs taken at home to deal with the side effects of treatment, such as nausea, pain and increased susceptibility to infection. |
| [22] | Sun Life Canadian Health Index, September 30, 2013. |
| [23] | The Manulife Bank of Canada Debt Survey, 2013 – Accessed January 13, 2014 at www.manulifebank.ca/wps/portal/bankca/Bank.caHome |
| [24] | 2013 Sun Life Canadian Health Index accessed January 6, 2014 at http://cdn.sunlife.com/static/canada/sunlifeca/ |
| [25] | M. Mathews, A. Park, Identifying Patients in Financial Need: Cancer Care Providers’ Perceptions of Barriers. Clinical Journal of Oncology Nursing, 13(5), 501-505. |
| [26] | Hopkins, R.B., Goeree, R. and Longo, CJ. (2010). “Estimating the National Wage Loss from Cancer in Canada.” Current Oncology 17(2): 40-49. |
| [27] | C. J. Bradley, et.al., Productivity cost of cancer mortality in the United Sates: 2000-2020, J Natl Cancer Inst, Vol. 100, No. 17, 63-70. |
| [28] | Health Canada, Strategic Framework for the Canadian Strategy for Cancer Control, April 2005: 8, 9. |
| [29] | In Ontario, the Trillium Drug Plan has a `deductible` equal to 4% of total net family income which in itself can be a debilitating burden on families in need of cancer treatment. |
| [30] | Accessed January 7, 2014 at http://www.cancerdrugaccess.ca |
| [31] | According to ESI, Prism and Teva Neuroscience, in 2008, only 70% of private drug insurance coverage was “open-ended” in the Atlantic Provinces; 80% in Ontario; and 75% nationally – “close-ended” private plans operate like provincial plans restricting access by a managed formulary whereas “open-ended” plans pay for any drug once it is approved by Health Canada and the manufacturer submits an application to the insurer; many are now following their American counterparts and invoking moratoria averaging 6 months before a new molecular entity is reimbursed; 1 in 6 have annual or lifetime spending caps many of which are lower than cancer drug costs – 70% are $10,000 - see Canadian Cancer Society, Cancer Drug Access for Canadians, 2009; drug copayments are often 20%; out-of-pocket expenses can range from $15 to over $500 per claim – see M. L. Raborn, E. M. Pelletier, D. B. Smith, C. M. Reyes, Patient Out-of-Pocket Payments for Oral Oncolytics: Results From a 2009 US Claims Data Analysis, Journal of Oncology Practice, Vol. 9, No. 6, November 2013. |
| [32] | Canadian Cancer Society, Cancer Drug Access for Canadians, 2009. |
| [33] | M. L. Raborn, E. M. Pelletier, D. B. Smith, C. M. Reyes, Patient Out-of-Pocket Payments for Oral Oncolytics: Results From a 2009 US Claims Data Analysis, Journal of Oncology Practice, Vol. 9, No. 6, November 2013. |
| [34] | C. J. Longo, Equitable Access to Healthcare Services and Income Replacement for Cancer: Is Critical Illness Insurance a Help or a Hindrance?, Healthcare Policy, Vol. 5, No. 54, e113-e119. |
| [35] | Canadian Cancer Society (Manitoba Division), Canadian Cancer Action Network, Five year action plan to address the Financial Hardship of Cancer in Canada: A Call for Action, November 2013. |
| [36] | IMS Brogan, Private Drug Plan Drug Cost Forecast, November 2013; also, Canadian Institute for Health Information, National Prescription Drug Utilization Information System Database, Ottawa, 2012. |
| [37] | Not all cancer drugs can be administered orally, though, because the stomach cannot absorb them. |
| [38] | The American Cancer Society - Accessed on January 7, 2014 at http://www.cancer.org/treatment/treatmentsandsideeffects/ treatment types/chemotherapy/oral-chemotherapy. |
| [39] | Accessed January 7, 2014 at http://www.canadapharma.org/CMFiles/. |
| [40] | Accessed November 19, 2013 athttp://www.cancercare.mb.ca/home/about_us/programs/manitoba_home_cancer_drug_program/ |
| [41] | Accessed on January 29, 2014 athttp://www2.gnb.ca/content/gnb/en/news/news_release.20 13.12.1269.html. |
| [42] | D. Menon, T. Stafinski, G. Stuart, Access to Drugs for Cancer: Does Where You Live Matter?” Canadian Journal of Public Health, Vol. 96, No. 6, 454-458. |
| [43] | Accessed December 18, 2013 at www.health.gov.on.ca |
| [44] | Many patients do not have three years’ worth of income tax returns to submit as they have not paid taxes; others do not necessary for IV chemotherapy - to apply. |
| [45] | http://www.health.gov.on.ca/en/public/programs/ drugs/publications/opdp/docs/odb_report_11.pdf, 58. |
| [46] | D. Jensen, spokesman, Ontario Ministry of Health and Long term Care, as quoted in T. Boyle, Ontario’s special drug program mired in backlog, Toronto Star, October 12, 2010. |
| [47] | Accessed January 9, 2014 at http://www.statcan.gc.ca/tables-tableaux/sum-som/l01/cst0 1/famil108a-eng.htm. |
| [48] | Canadian Cancer Society (Manitoba Division), Canadian Cancer Action Network, Five year action plan to address the Financial Hardship of Cancer in Canada: A Call for Action, November 2013, 17-18. |
| [49] | In 2010, 40% of 18-25 year-olds in Ontario – Accessed January 29, 2014 at http://www.wellesleyinstitute.com/wp-content/uploads/2013/ 10/Who-Makes-Minimum-Wage.pdf, and, http://www12.statcan.gc.ca/census-recensement/200 6/. |
| [50] | C.J. Longo, B.G. Bereza, A comparative analysis of monthly out-of-pocket costs for patients with breast cancer as compared with other common cancers in Ontario, Canada, Current Oncology, Vol. 18, No. 1, e1-e8. |
| [51] | Canadian Cancer Action Network, Issues of Access to Cancer Drugs in Canada, April 2008, 31. |
| [52] | C.J. Longo, R. Deber, M. Fitch, A.P. Williams, D. D’Souza, An examination of cancer patients’ monthly ‘out-of-pocket’ costs in Ontario, Canada, European Journal of Cancer Care, Vol. 16, No. 6, 500-507. |
| [53] | Health Canada, Strategic Framework for the Canadian Strategy for Cancer Control, April 2005:12. |
| [54] | Cancer Care Ontario, Ontario Cancer Plan 2011-2015, n.d., 7. |
| [55] | Cancer Quality Council of Ontario, Modern Care for Modern Patients, June 2010, 3. |
| [56] | Cancer Quality Council of Ontario, Mapping a Way through the Double Helix, May 2011. |
| [57] | R. DeVol, A. Bedroussian, An Unhealthy America, Santa Monica CA: Milken Institute, October 2007. |
| [58] | M. Richards, Extent and Causes of International Variations in Drug Usage, July 2010, 71. |
| [59] | Oncology Roundtable, The Advisory Board, State of the Union: Assessing service line trends and opportunities, Washington D.C, 2003: 20. |
| [60] | Canadian Health Policy Institute, The cost of patented drugs in Canada, November 24, 2013. |
| [61] | Accessed on January 9, 2014: https://www.cancercare.on.ca/cms/One.aspx?portalId=1377&pageId=8888#stwtcurmon. |
| [62] | The annual consumer price index was 1.2% for 2013; industrial wages increased by an average of 1.4% in 2013; see http://www.statcan.gc.ca/start-debut-eng.html (Accessed January 28, 2014). |
| [63] | C.I. Starner, P.P. Gleeson, B. W. Gunderson, Oral Oncology Prescription Abandonment Association with High Out-of Pocket Member Expense, Journal of Managed Care Pharmacy, Vol. 16, No. 2, 161-162. |
| [64] | F. T. Camacho, J. Wu, W. Wei, G. Kimmick, R. T. Anderson, R. Balkrishnan, Cost impact of oral capecitabine compared to intravenous taxane-based chemotherapy in first-line metastatic breast cancer, Journal of Medical Economics, Vol. 12, No. 3, 238-245. |
| [65] | J. Cassidy, et.al., Pharmacoeconomic analysis of adjuvant oral capecitabine vs. intravenous 5-FU/LV in Dukes’ C colon cancer: the X-ACT trial, British Journal of Cancer, Vol. 24, No. 8, 1122-1129. |
| [66] | A.T. Skarin, M.S. Duh, J. R. Weiner, P. Lefebvre, M. P. Neary, Costs associated with intravenous (IV) chemotherapy administration in patients with lung cancer, Journal of Clinical Oncology, Vol. 25, No. 18S, 18902. |
| [67] | J.J. McKendrick, J. Cassidy, et al. Capecitabine (x) is resource saving compared with i.v. bolus 5-FU/LV in adjuvant chemotherapy for Dukes' C colon cancer patients: Medical resource utilization (MRU) data from large phase III trial (X-ACT), Journal of Clinical Oncology, Vol. 22, No. 14S, 3578; New Data Highlights Presented at ASCO (May 13-17, 2005). |
| [68] | Complications and adverse events arising from chemotherapy have been estimated to cost between $1,000 and $30,000 per case in 2001; with healthcare inflation averaging 5% per annum, those costs in 2014 would be $2,000-$50,000 per case – see, Oncology Roundtable, Instilling a cost discipline, Washington, D.C.: The Advisory Board, 2001: 9. |
| [69] | Cancer statistics accessed on January 6, 2014 at http://www.cancer.ca/en/cancer-information/cancer-101/ca ncer-statistics-at-a-glance/?region=on and, Public Health Agency of Canada, Statistics Canada, Canadian Cancer Society, Canadian Cancer Statistics 2013, Ottawa, 2013; Ontario social assistance statistics accessed on January 7, 2014 at http://www.mcss.gov.on.ca/en/mcss/programs/social/repor ts/ow_quarterly.aspx; populations statistics accessed on January 14 athttp://www.satacan.gc.ca/tables-tableaux/sum-som/101/CS T01/demo02A-eng.htm; calculations by the author. |
| [70] | 69.6% of the 10 year tumour-based prevalence for all cancers was in patients age 65+; 30.4% was among those under 65. |
| [71] | The number on social assistance (all forms) in Ontario in October 2013 was 883,000 out of a population of 13,775,000. |
| [72] | http://www.winnipegsun.com/2012/04/19/cancer-drugs-get -100-coverage |
| [73] | Ontario spent $265,387,587 on oral cancer therapy in 2012. |
| [74] | N.S.B. Rawson, Potential Impact of Delayed Access to Five Oncology Drugs in Canada, November 2013; this figure is conservative considering that the National Institutes of Health in the US uses a figure of $270,000 as in Cancer Trends Progress Report - 2009/2010 Update, National cancer Institute, NIH, DHHS, Bethesda MD, April 2010 - Accessed March 4, 2011 at http://progressreport.cancer.gov (2005 base figure $225,000 inflated by US CPI 2005-2012 for comparative purposes and assuming USD-CND parity). |
| [75] | M. Toumi, et.al, Influence of health technology assessments on utilization of bevacizumab in Europe, ISPOR 15th Annual International Meeting, Atlanta GA, May 2010 - Accessed on January 16, 2014, and C. Ciapanna, et.al., Cost-effectiveness observations and oncology drug reimbursement recommendations in Canada by the Joint Oncology Drug Review, Value in Health, Vol,13, No. 3, A51. |