American Journal of Medicine and Medical Sciences

p-ISSN: 2165-901X    e-ISSN: 2165-9036

2013;  3(1): 1-9

doi:10.5923/j.ajmms.20130301.01

Interplay Between Quantifiable and Unquantifiable Safety Climate as Affected by Successful Systems Approach to Medication Safety Improvement:Primary Care Settings

Ranjit Singh 1, Diana Anderson 2, Elizabeth McLean-Plunkett 2, Dev Raheja 3, Gurdev Singh 4

1Associate Professor at Schools of Medicine and Management, Co-Director UB Patient Safety Research Center, UB School of Medicine, State University of New York at Buffalo, Member of WHO Expert Panel for Patient Safety in Primary Care.77 GoodellSt,Room 220R, Buffalo, NY 14203, USA

2Research AssociateUB Patient Safety Research Center, UB School of Medicine,77 Goodell St, Room 220R, Buffalo. NY 14203. USA

3Patient System Safety, 9811 Mallard Drive, Suite 213Laurel, MD 20708. USA

4Director UB Patient Safety Research Center, UB School of Medicine, Adjunct Professor UB Schools of Management and Medicine,State University of New York at Buffalo, Member of WHO Expert Panel for Patient Safety in Primary Care.77 Goodell St, Room 220R, Buffalo, NY 14203, USA

Correspondence to: Gurdev Singh , Director UB Patient Safety Research Center, UB School of Medicine, Adjunct Professor UB Schools of Management and Medicine,State University of New York at Buffalo, Member of WHO Expert Panel for Patient Safety in Primary Care.77 Goodell St, Room 220R, Buffalo, NY 14203, USA.

Email:

Copyright © 2012 Scientific & Academic Publishing. All Rights Reserved.

Abstract

The authors examine interrelation of safety attitude constructs measured with an Ambulatory Safety Attitudes Questionnaire(SAQ-A) and a successful intervention designed to reduce medication errors. This paper responds to WHO All Expert Working Group’s 2012 call to understand this interrelationship. Authors set out to measure safety attitude changes in relation to the changes in Adverse Drug Events using a cluster randomized trial in which 12 Upstate New York Practice-based Research Network practices were each randomized to one of 3 states(4 practices each):(1)Team resource management intervention based on FMEA approach;(2)Team resource management intervention with Practice Enhancement Assistants;(3) No intervention(comparison group). Combined pre- and post-intervention scores of the safety attitudes constructs were: (a)stress recognition: 62 vs 64.8, (b)perceptions of management:64.3 vs 61.5,(c)working conditions: 68.1 vs 63.9,(d) teamwork climate: 75.4 vs 72.9,(e) safety climate: 73.3 vs 75.2, and (f) job satisfaction: 78.4 vs 77.0. Despite anecdotal reports to the contrary, the efficacious TRM intervention appeared to have had no significant effects on measured safety attitudes.The authors describe limitations of the work and put forward a concept of context-sensitive culture of safety.

Keywords: Ambulatory, Attitude, Culture, Failure Modes, Medication, Primary Care, Safety

Cite this paper: Ranjit Singh , Diana Anderson , Elizabeth McLean-Plunkett , Dev Raheja , Gurdev Singh , Interplay Between Quantifiable and Unquantifiable Safety Climate as Affected by Successful Systems Approach to Medication Safety Improvement:Primary Care Settings, American Journal of Medicine and Medical Sciences, Vol. 3 No. 1, 2013, pp. 1-9. doi: 10.5923/j.ajmms.20130301.01.

1. Introduction

The huge chasm that exists between the potential and the actual safety-based quality of care delivered by the health care industry is consistently wide across1,2 most of the world. The World Health Organization(WHO) has formed an ‘Alliance for Patient Safety’. According to WHO patient safety is a Basic Human Right.
A most generally expressed and accepted view is that creation of culture of safety is a critical first step for healthcare organizations that aim to improve quality and safety.3-6 This approach has been embraced by the National Quality Forum.7 The Joint Commission for accreditation of healthcare organizations appropriately included an annual assessment of safety culture in its 2007 Patient Safety Goals. Agency for Health Research and Quality(AHRQ) has developed surveys for assessment of patient safety culture in outpatient and inpatient settings.
It is important to point out that the WHO All Expert Working Group’s 2012 report8 calls for understanding of the relationship between safety culture and state of safety in any organization.
With support of an AHRQ grant the authors set out to:
1) examine the feasibility of objectively assessing the impact of a FMEA based Team Resource Management(TRM) intervention on reducing medication errors among geriatric patients in primary care settings, with and without Practice Enhancement Assistants(PEAs). At the heart of this TRM is a Safety Enhancement and Monitoring Instrument that is Patient Centred(SEMI-P).9-13
2) examine changes in six safety attitude constructs measured with an Ambulatory Safety Attitudes Questionnaire(SAQ-A).8,14-16
The associated hypotheses were that:
1) implementing an intervention will reduce Adverse Drug Event(ADE) incidence and severity over the comparison group,
2) implementing TRM will result in measurable changes in safety culture, and
3) the Practice Enhancement Assistant(PEA) will further reduce ADEs and improve safety climate beyond the effect of TRM intervention alone.
In this first section we present, very briefly, the TRM intervention and its effects on ADEs. Subsequent sections present detailed description and discussion of effects of this intervention on the safety attitudes.

1.1. SEMI-P Centered TRM

The authors have developed a bottom up Team Resource Management(TRM) approach for not only monitoring safety hazards but also for improving patient safety in an office setting.10-13,17-19 This approach synergizes with the paradigm of complex adaptive systems and views each medical setting as a complex adaptive micro-system. The measurements that are used to identify and prioritize quality and safety problems must be trusted by the members of the system. The literature reflects scepticism regarding externally driven measures20-22 and top-down recommendations for improvements, suggesting that, in their current forms, they may not be trusted by many physicians, nurses and other staff as fair and valid measures. An alternative approach, TRM, that solicits and encourages involvement of all team members to identify and prioritize safety and quality problems has SEMI-P at its heart and is prospective.10,23 The science of observed systems is looped with that of observing systems in the development of this approach.5,24

1.2. Effects of TRM on ADEs

Rate and severity of ADE’s and preventable ADE’s was measured using a Trigger Tool(TT)25 for the 12-month periods before and after the start of the intervention. It is useful to note that a TT is likely to uncover the largest number of adverse evenets.26 At baseline, among 1019 patients there were 341 ADE’s(33.5 per 100 patient-years), of which 39.3% were preventable. Paired T-tests using site-level rates showed that the rate of preventable ADE’s in the TRM intervention with PEA group was significantly lower after the intervention than before(11.0vs 15.9 per 100 patient-years, p=0.042). Preventable ADE’s most commonly occurred during prescribing and administration of medications.
The most common triggers as well as the largest contributors to ADE’s and to preventable ADE’s were: medication discontinuation, unplanned hospitalization, and emergency department visits.
Among preventable ADE’s
•38% were deemed to have minimal or no clinical effect(e.g., abnormal lab with no symptoms)
•30% were classified as “Severe”(resulting in either hospitalization, permanent disability or death)
The conclusion drawn from this part of the study was that the TRM intervention(when enhanced by a PEA) appeared to affect a significant improvement in medication safety.

1.3. Rationale and Background to the Constructs Safety Culture, Climate and Quantifiable and Unquantifiable Attitudes

Definitions of organizational and safety culture abound in the literature.27,28 These constructs aspire to help analytical reasoning and practical research. It should be acknowledged that the causes and effects of an organization’s safety culture are intertwined. A highly reliable organization ‘has’ a safety culture and ‘is’ a safety culture, wherein the objective of cultivating this culture is to continuously enhance safety, advisedly, with self-empowered and motivated teams.10 It is also helpful to acknowledge and treat each ambulatory practice(organization) as a unique and complex adaptive micro-system.19 In the paradigm of complex adaptive systems, a culture of safety not only functions as a conceptual model but also as a ‘central attractor’ bringing order in disorder(i.e. reliability where there was risk).17,27 It is interesting to note that a study by Quinn et al.29 showed that physicians from practices that were involved in the evaluation of QI activities had significantly less isolation, stress, and dissatisfaction.
In broad terms, climate can be seen as the observable part of culture. Safety attitudes in turn are a subset of safety climate; they are the part of the climate that resides in individuals and may, therefore, be measurable via self-administered surveys. But it should be remembered that attitudes too are very impressionable and complexly dynamic. Figure 1 portrays the dynamic conceptual relationships between the different constructs.
Figure 2 portrays a framework that attempts to clarify the contributors to safety culture and the relationship of culture to climate and attitudes. This figure shows eight factors that, in our view, contribute to a safety culture.14 Although the relative importance of these contributors(and potentially others not identified in this framework) are not well understood at this time, it is important to note that each of these contributors interacts with and influences every other contributor(see narrow arrows); they worksynergistically to create a culture of safety. This culture is complex and hyper-dimensional and is the result of complex interactions between multiple players and their beliefs, attitudes, and behaviours over time.
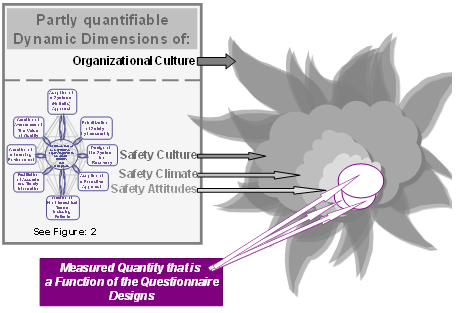
Figure 1. Conceptual Dynamic Relationship between Various Constructs
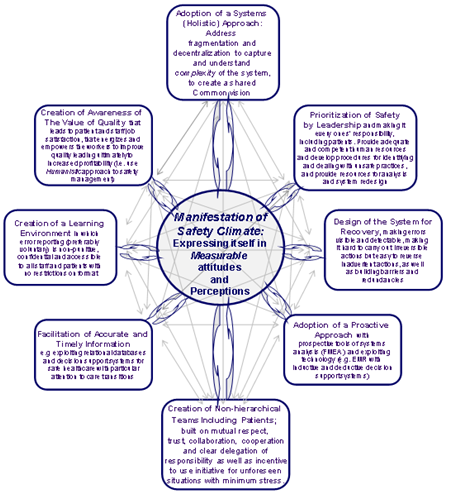
Figure 2. Framework of interactive contributors to the construct of culture of patient safety:manifesting as safety climate,which expresses itselfpartly in measureable attitudes and perceptions with numerous cybernetic loops with the culture14
The manifest or observable aspects of safety culture are referred to as the safety climate and are in a cybernetic loop30 with overall safety culture(via the wide arrows). interactions of goals, predictions, actions, feedback, and response within systems.30 In this context, climate is seen as a primary manifestation of culture which in turn influences and nourishes culture.16,31-34
However, even climate is difficult to measure because, like culture, it exists largely not in individuals but in the interactions between them.
Self-administered questionnaires have been developed in a variety of industries as practical and convenient means of measuring quantitatively some of the important aspects of safety climate. These surveys, whether referred to as safety attitude, safety culture, or safety climate questionnaires, can only examine the aspects of climate that are quantifiable and expressible by individuals. These include individual attitudes and beliefs as well as perceptions about individual and group behaviours at any particular time.
It is the apparent ability to quantify safety climate or culture, albeit in a limited way, that has driven the development of self-administered safety attitudes questionnaires over the last 30 or more years for the expressed purposes of measurement, description, diagnosis, and design of interventions for safety. These formative measures should be seen in light of the fact that the mere process of measurement influences the measured, i.e. there is a time-sensitive cybernetic loop here also.
In attempting to describe safety climate quantitatively, a large number of variables can be identified. A number of these measurable variables are interrelated and measure aspects of the same underlying dimension of safety climate. A number of these dimensions, in turn, capture different aspects of the same underlying(unobservable)latent ‘factor’16 or ‘domain’35 or group/category.36 It is, therefore, possible to reduce/transform, successively, these variables to manageable(quantitatively) dimensions and factors. This transformation is usually done by using Factor Analyses.16,35,37-40 Capturing the climate in terms of these factors helps to provide, hopefully, a clearer view of climate changes within and variations between different healthcare settings.
The SAQ, or Safety Attitudes Questionnaire is such a questionnaire and16 is a 60-item self-administered survey tool that was derived from a questionnaire used in commercial aviation, namely the Flight Management Attitudes Questionnaire.41 In a 2005 study comparing published healthcare safety attitude/climate/culture surveys, the SAQ appeared to be psychometrically the most robust.42 The SAQ has been successfully used in inpatient and ambulatory clinics.16,43 It elicits attitudes through the following 6 scales(or ‘factors’): teamwork climate; safety climate; job satisfaction; perceptions of management; working conditions; and stress recognition. These scales(encompassing 30 of the 60 questions in the SAQ) were developed through multilevel factor analysis using data from 10,843 respondents from 203 clinical areas in three countries(USA, United Kingdom, and New Zealand). The 203 clinical areas included 179 ICU’s, 11 inpatient settings, 11 ambulatory clinics and 2 operating rooms.
A further study, using the ambulatory version of the SAQ(SAQ-A) in a single large multi-specialty academic outpatient practice(282 respondents), demonstrated good internal consistency-reliability for the same six factors (Cronbach’s alphas ranging from 0.68 to 0.86) .42 Although the outpatient care environment is very different from the mostly intensive care hospital settings where the factors were developed, the same six factors appeared to be robust in this setting. This may in part be due to the fact that this study was in a large academic practice that in some ways is organizationally similar to a hospital, with a centralized administrative infrastructure. The typical primary care outpatient setting, where the majority of outpatient care is provided, is very different from this. For example, the organizational structure is typically flatter, roles are sometimes less clearly defined(with more cross-coverage) and relationships between staff are usually closer. These and other differences might have significant effects on the performance of the SAQ-A in this type of setting.
As part of our AHRQ-funded study we tested the internal consistency-reliability of this attitudes questionnaire at the outset. The results are published elsewhere.14 The Cronbach’s Alpha for all respondents, including physician/extenders, nursing staff and administration staff, ranged from 0.58 to 0.77. The lowest(0.40) value of Alpha was recorded among nurses for perception of management and the highest, 0.89 and 0.90, among administration staff for teamwork climate and job satisfaction, respectively.
We concluded, at the outset, that further study was warranted, preferably with a larger sample size than ours, with the goal of developing a more robust instrument tailored to this setting.

2. Objective

The objective of the study presented in this paperwas to measure safety attitude changes in relation to the changes in ADEs by examining changes in the following safety attitude constructs as measured with a 30 item Safety Attitudes Questionnaire(SAQ-A):
a)stress recognition d) teamwork climate
b)perceptions of management e) safety climate
c)working conditionsf) job satisfaction

3. Methods

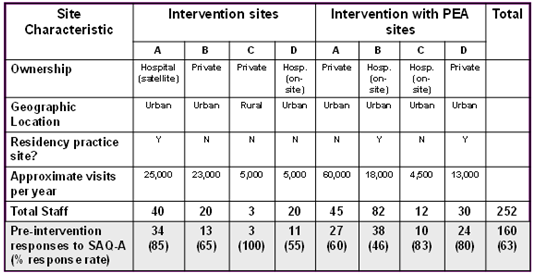
Table 1 shows the characteristics of the sites studied. This was a cluster randomized trial in which 12 Upstate New York Practice-based Research Network practices were each randomized to one of 3 states(4 practices each):(1) Team resource management intervention;(2) Team resource management intervention with PEA;(3) No intervention (comparison group).
All staff at the intervention sites were invited and encouraged to participate in TRM and respond to SAQ. The intervention period was 12 months.The study protocolwas approved by the Social and Behavioural Sciences Institutional Review Board.
Table 1. Site Characteristic
     
The data presented in the following are part, as stated earlier, of a larger study in which the authors presented pre-intervention SAQ-A results to each office’s staff(along with other data specifically related to medication safety) as a means of initiating discussions around change. Staff, in their respective sites, then worked together to design and implement changes.

3.1. Implementation

The SAQ-A was administered voluntarily and anonymously to all eligible staff at 8 primary care offices within the Upstate New York Practice-Based Research Network. To be eligible, staff had to have worked at the office(full- or part-time) for at least one month prior to survey administration. As shown in Table 1 the characteristics of the practices ranged from a rural solo practice to an urban academic residency practice site.
The main part of the survey consisted of a series of statements that respondents rate according to a 5-point Likert scale(1 = disagree strongly, 2 = disagree slightly, 3 = neutral, 4 = agree slightly, and 5 = agree strongly). Respondents could also indicate that an item was ‘Not Applicable.’ The survey took approximately 10-15 minutes to complete. Most surveys were distributed in person at brief informational meetings accompanied by a concise explanation of the purpose of the survey, instructions for completion, and assurances of anonymity. For those employees unable to attend the informational session, materials were left with brief written instructions. To help maintain anonymity and confidentiality, participants were instructed to refrain from placing any identifying information on the survey; a secure drop-box was provided for completed questionnaires. Surveys returned within two weeks were included in analysis.

3.2. Analysis

In keeping with the analytic technique of the originators of the SAQ, calculation of safety attitudes for each of the six safety factorswas performed by converting results from categorical to continuous variables as follows: Strongly disagree=0, Disagree=25, Neutral=50, Agree=75, and Strongly Agree=100. Some items were reverse scored so that a higher score always represents a more positive attitude. For each respondent, a mean score of ≥ 75 for the items in a particular factor denotes a “positive safety attitude” for that factor. Survey data were analyzed using SPSS, version 14.0(SPSS Inc., Chicago, IL).

4. Results

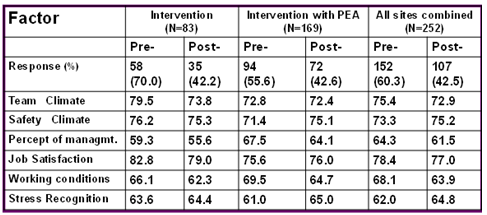
Table 2 shows the 30 item questionnaire response rates and mean scores on the six attitude subscales at the start and after 12 months of TRM intervention. Comparison of post versus pre data by ANOVA showed no significant differences with or without PEA despite anecdotal reports from multiple sites of improvement in attitudes as measured by SAQ-A.
Table 2. Response Rates and Mean Scores on the Six Subscales: pre- and post-intervention
     
We speculate that the reduction in the post intervention response rates may reflect reduced motivation to respond to the SAQ-A with perceived improving state of safety in practices.

5. Discussion

The theoretical framework described in Figure 2 includes several contributors to safety IT. Some of these contributors can be mapped to measurable attitudes, many of which are covered by the SAQ and SAQ-A. For example, ‘Creation of a Learning Environment’ maps very closely to the SAQ’s Safety Climate scale, ‘Creation of Non-hierarchical Teams’ corresponds to Teamwork Climate, Job Satisfaction, and Stress Recognition in the SAQ, and ‘Prioritization of Safety by Leadership’ is an area that is well addressed via the Perceptions of Management and Working Conditions scales. The framework reveals some areas that could be addressed further, such as ‘Design of the System for Recovery’ and ‘Adoption of a Proactive Approach’ that are not explicitly covered by the SAQ. It should also be recalled that all these 8 contributors manifest in complex multidimensional ways, some of which are either not measurable or require methods of assessment other than self-administered surveys.
In an effort to explain absence of direct correlation between reduction of ADEs due to TRM intervention and no significant change in measured safety attitudes, we have visualized threshold effects of TRM intervention, combined with concurrent administration of SAQ-A, on the dynamic interplays between total state of safety, perceived state of safety, the various constructs of culture/climate/attitudes, and the ADEs.
Figure 3 portrays the conceptual interplay, over a 12 month intervention period(t1 to t2), between the beneficial effect of TRM on ADEs and:(1) changes in total number of possible errors or total risks, and(2) changes in perceived number of errors or total risks. These relative changes are assumed to be due to improved situational awareness due to the formative effects of TRM and SAQ-A and the normative/summative effects of TRM. It is helpful to note that a number of studieshave shown that increase in error reporting can accompany overall safety improvements in a setting. A 2009 Report by AHRQ41 found that “hospitals with improvements over time in non-punitive response to error had slight increases in event reporting.”
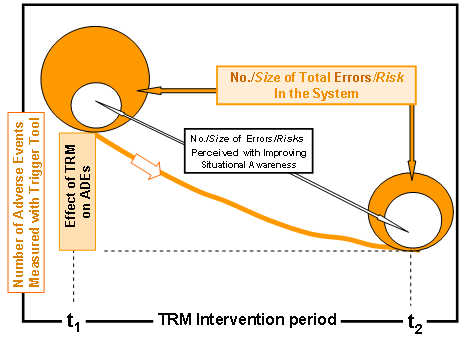
Figure 3. Conceptual interplay between the beneficial effect of TRM on ADEs, changes in total number of possible errors or the total safety risks, and changes in perceived number of errors or the total safety risks
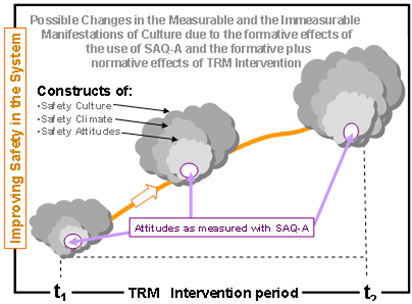
Figure 4. Interplays between the improvement in medication safety and the constructs of safety culture, climate, and the measured attitudes
For further clarification and understanding of the threshold effects we have visualized(Figure 4) the possible interplays between the improvement in medication safety and the(significantly affected) constructs of safety culture, safety climate, and the(insignificantly affected) measured safety attitudes. These interplays are thought to be caused by the formative and normative/summative influences, TRM intervention and the formative influences of SAQ-A.
As stated above only 30 of the 60 items are included in the six climate scales evaluated in this and prior studies. We have speculated above that the reduction in the post intervention response rates may reflect reduced motivation to respond to the SAQ-A with improving state of safety perceived in a practice affected by SEMI-P centered TRM intervention. SEMI-P centered TRM intervention is designed to inculcate mutual respect and trust, cooperation, and collaboration by generating common vision.
It may be helpful to introduce the concept of context-specificculture of safety. As stated in the first paragraph of Section 2, a highly reliable organization ‘has’ a safety culture and ‘is’ a safety culture, wherein the objective of cultivating this culture is to continuously enhance safety, advisedly, with self-empowered and motivated teams.10 Improvement of reliability in the domain of medication with TRM can therefore be viewed as improvement in the culture of safety in the context of medication. The TRM-based improvement methodology, after all, was informed by our framework of interactive culture formers14 illustrated in Figure 2.
It may also be helpful to note that in the general domain of safety there is lack of evidence to demonstrate that the currently available safety climate/attitude measurement tools/questionnaires adequately indicate the state of safety in the workplaces.27,45 The 2009 AHRQ Report,44 based on trends in hospital settings cautions that “survey scores might change, or not change, over time for a number of complex reasons” despite “patient safety actions”. Huang et al.46 observe that “safety culture may influence patient outcomes but evidence is limited” and concluded, from their study in intensive care units, that safety climate(as measured with SAQ-ICU) was only moderately associated with patient outcomes. They recommend further work to develop methods of assessing safety culture. Weingart et al,47 based on their study in multiple hospitals, concluded that independent indicators of patient safety did not line up neatly with safety culture surveys and that “the safety culture is a complex phenomenon that requires further study.” Waterson et al.48 in their 2010 study found that measurement of safety culture and climate in healthcare is still a relatively immature stage of development and argue that there is need to further develop and construct theoretical models that are sensitive to the context-specific nature of healthcare environments.
We concur with views recently expressed by Guldenmund49 that “culture is an intangible, fuzzy concept encompassing acquired assumptions that is shared among the members of a group.” We also hold the view that it is vital that the concept of culture is not deprived of its depth and subtlety and “morphed onto a grab bag of behavioural and other visible characteristics” and it should not be assumed to have normative/summative attributes.
The above discussion should be seen in the light of the fact that overall average Chronbach’s Alpha measures with SAQ-A for all respondents in our study ranged from as low as 0.58 to no higher than 0.77.
It may be worth considering use of recently developed AHRQ’s 12-dimensioned “Medical Office Survey on Patient Safety Culture” in future studies. As a word of caution it should be noted again that the trending data, obtained using 12-dimensional Hospital Survey on Patient Safety Culture, in the AHRQ 2009 Report [AHRQ 2009] shows that despite the “patient safety actions” taken by the trending hospitals there was only marginal increase in “overall perceptions of patient safety”, and that too in only thirty seven% of these hospitals.
In the authors’ view relation between safety and culture is often based on wrong assumption that people are the problem. The most famous quality guru Dr.W. Edwards Deming, who taught the theory of profound knowledge, always emphasized that 85% of the time, the problem is management, not the worker. Introducing a safe system is the responsibility of management. Introducing safety culture with wrong system in place is not going to work. That is why the patient safety movement has been a failure, according to Dr. Lucian Leape, the co-founder of patient safety movement more than a decade ago. We need to fix the system to prevent harm, not fight the problems after we created them. Preventing harm requires use of tools such as FMEA and Fault Tree analysis on ALL critical procedures.

6. Conclusions

1. At baseline SAQ-A revealed significant differences in safety attitudes between sites, attesting to the uniqueness of each setting.
2. Five of the six subscales had reasonable internal consistency-reliability in primary care offices but some performed poorly with some subgroups. Further work is needed to evaluate and refine the instrument for these settings.
3. Combined pre- and post-intervention scores of the safety attitudes constructs were: (a)stress recognition: 62 vs 64.8, (b)perceptions of management:64.3 vs 61.5, (c)working conditions: 68.1 vs 63.9, (d) teamwork climate: 75.4 vs 72.9, (e) safety climate: 73.3 vs 75.2, and (f) job satisfaction: 78.4 vs 77.0. Despite anecdotal reports to the contrary, the efficacious TRM intervention appeared to have had no significant effects on safety attitudes as measured by SAQ-A.
4. Measurement of safety culture and climate in healthcare is still a relatively immature stage of development and there is need to further develop and construct theoretical models that are sensitive to the nature of healthcare environments.
5. The concept of context-sensitive culture of safetyis,therefore,worthy of further development.
6. It may be worth considering use of the recently developed AHRQ 12-dimensioned “Medical Office Survey on Patient Safety Culture” in future studies.
7. Our work responds to WHO All Expert Working Group’s 2012 call to understand this interrelationship between safety culture and a successful intervention designed to improve safety.

6.1. Limitations

•Small number of sites
•Modest response rates(esp. post-intervention)
•Lack of a control group
•Confounding factors
•Changes in management, staff turnover, etc.
•Limitation of the measurement tool
•Some aspects of safety climate not covered
•Some issues not amenable to this approach
•SAQ-A is a formative tool; confounding the “before and after” comparisons, e.g., people’s threshold for agreement may change.

ACKNOWLEDGEMENTS

Authors are grateful for AHRQ Grant:1R21HS014867-01A1; Improving Geriatric Drug Safety in Underserved Practices.

References

[1]  Murphy GJ, Stee L., Marian T.M., O Shiro J.(2007). Journal reporting of medical errors: The wisdom of Solomon, the bravery of Achilles, and the foolishness of Pan. Chest 131, 890-896.
[2]  McGlynn E.A., Asch S.M., Adams J., et. al.(2003). The quality of health care delivered to adults in the United States. N Eng J Med 348, 2635-2645.
[3]  Kohn LT, Corrigan JM, Donaldson MS eds. To Err is Human; Building a Safer Health System. Washington, DC: National Academies Press; 1999.
[4]  Sagan SD. The Limits of Safety Organization, Accidents, and Nuclear Weapons. Princeton, NJ: Princeton University Press; 1993.
[5]  Singh R, Singh A, Anumba C, Singh G. Web-Based Systems Approach to Improvement of Patient Safety. Proceedings, North American Simulation Technology Conference, Aug 26-28, 2009. Atlanta, GA
[6]  Singh R, Singh A, Singh S, Singh G. Visual Modeling for Making Healthcare Safer. Proceeding, North American Simulation Technology Conference, Aug 26-28, 2009. Atlanta, GA.
[7]  National Quality Forum: Safe Practices for Better Health Care: A Consensus Report; 2003.
[8]  WHO Safer Primary Care for All Expert Working Group Meeting Report: Safer Primary Care for All: A Global Challenge. February 2012.
[9]  Singh R, Servoss T, Kalsman M, Fox C, Singh G. Estimating impact on safety caused by introduction of electronic medical records in primary care. Informatics in Primary Care 2004;12: 235-41.
[10]  Singh R, Singh A, Taylor JS, Rosenthal TC, Singh S, Singh G. Building learning practices with self-empowered teams for improving patient safety. J Health Manag 2006; 8(1):91-118.
[11]  Singh R, Servoss T, Danzo A, Singh A, Singh G. Prioritizing Threats to Patient Safety in the Micro-System of Rural Primary Care. Journal of Rural Health 2007; 23(2); 173-8.
[12]  Singh R, Naughton B, Anderson DR, Singh G. Building Self-Empowered Teams for Improving Safety in Post-operative Pain Management. In: Henriksen K, Battles JB, Keyes MA, Grady ML, editors. Advances in Patient Safety: New directions and alternative approaches. Vol. 3. Performance and Tools. AHRQ Publication No. 08-0034-3. Rockville, MD: Agency for Healthcare Research and Quality; August 2008; pp 37-50.
[13]  Singh R, Anderson Diana, McLean-Plunkett Elizabeth, Brooks R, Wisniewski Angela, and Singh G. Effects of Self-Empowered Teams on Rates of Adverse Drug Events in Primary Care. International Journal of Family Medicine.(in Press)
[14]  Singh G, Singh R, Thomas EJ, et al. Measuring Safety Climate in Primary Care Offices. In: Henriksen K, Battles JB, Keyes MA, Grady ML, editors. Advances in Patient Safety: New directions and alternative approaches. Vol. 2. Culture and Redesign. AHRQ Publication No. 08-0034-2. Rockville, MD: Agency for Healthcare Research and Quality; August 2008; pp 59-72.
[15]  Kirk S, Parker D, Claridge T, Esmail A, Marshall M. Patient safety culture in primary care: developing a theoretical framework for practical use. QualSaf Health Care. 2007;16:313-320.
[16]  Sexton J B, Helmreich R L, Neilands T B, Rowan C, Vella K, Boyden J, Roberts P R and Thomas EJ. The Safety Attitudes Questionnaire: psychometric properties, benchmarking data, and emerging research. BMC Health Service Research 2006; 6:44.
[17]  McDaniel, RR Jr. Strategic leadership: A view from quantum and chaos theories. Health Care Management Rev. 1997 Winter: 21-37.
[18]  Miller WL, Crabtree BF, McDaniel R, Stange KC. Understanding change in primary care practice using complexity theory. J FamPract. 1998; 46: 369 - 376.
[19]  Plsek P. Redesigning health care with insights from the science of complex adaptive systems. Crossing the Quality Chasm: A new health system for the 21st century National Academy Press; 2001. Appendix B,
[20]  Rosenstein AH. Hospital report cards: friend or foe? J Clin Outcomes Manage. 2004; 11: 98 - 102.
[21]  Hibbard JH, Stockard J, Tusler M. Does publicizing hospital performance stimulate quality improvement efforts? Health Aff. 2003; 22 : 84 - 94
[22]  Hofer TP, Hayward RA. Are bad outcomes from questionable clinical decisions preventable medical errors? A case of cascade iatrogenesis. Ann Intern Med. 2002;137:327 - 333 .
[23]  Raheja, Dev. Healthcare Failure Mode and Effects Analysis as a Proactive Safety Tool. Journal of System Safety, March-April 200: 14-16.
[24]  Singh, R. Singh, A. Anumba, C. Singh, G. Enhancing and Measuring Patient Safety with an Innovative Web-Based Systems Approach. Special Issue on Soft Computing, Simulation, and Web-centric Computing on Selected Papers from NASTEC 2009, International Journal of Advanced Intelligence Pradigms(IJAIP)- Volume 3, Number 1, January 2011.
[25]  Singh R, Wisniewski AM, Fox C, McLean-Plunkett EA, Kee R, Cadzow R, Okazaki S, Singh G. Experience with a Trigger Tool for identifying ADE’s among older adults in ambulatory primary care. Quality and Safety in Healthcare 2009; 18:199-204.
[26]  David C. Classen, Roger Resar, Frances Griffin et al. ‘Global Trigger Tool’ Shows That Adverse Events In Hospitals May Be Ten Times Greater Than Previously Measured. Health Aff April 2011 vol. 30 no. 4 581-589.
[27]  Guldenmund F W. The nature of safety culture: a review of theory and research. Safety Science 2000;34:215-257.
[28]  Cooper M D. Towards a Model of Safety Culture. Safety Science 2000;36:111-136.
[29]  Quinn MA, Wilcox A, Orav EJ, Bates DW, Simon SR. The relationship between perceived practice quality and quality improvement activities and physician practice dissatisfaction, professional isolation, and work-life stress. Med Care. 2009 Aug;47(8):924-8.
[30]  Wiener, N. Cybernetics: or Control and communication in the animal and the machine(2nd Edition). Cambridge, Massachusetts: The MIT Press; 1965
[31]  Schein E H. Organizational Culture and Leadership, 2nd Edition. San Francisco: Jossey-Bass; 1993.
[32]  Keenan V, Kerr W and Sherman K W. Psychological climate and accidents in an automotive plant. Journal of Applied Psychology 1951; 108-111.
[33]  Hofstede G R. Cultures and organizations: software of the mind. London: McGraw-Hill; 1991.
[34]  Glick W H. Conceptualizing and measuring organizational and psychological climate: pitfalls in multilevel research. Academy of Management Review 1985;10(3):601-616.
[35]  Pronovost P and Sexton B. Assessing safety culture: guidelines and recommendations [editorial]. QualSaf Health Care 2005;14:231-233.
[36]  Singla A K, Barret K, Weissman J S and Campbell E G. Assessing Patient safety Culture: A Review and Synthesis of the Measurement Tool. Journal of Patient Safety 2006;2(3):105-115.
[37]  Guttman L. A general nonmetric technique for finding the smallest coordinate space for a configuration of points. Psychometrika 1968;33(4):469-506.
[38]  Borg I(Ed). Multidimensional data representation: When and why. Ann Arbor: Mathesis Press; 1981.
[39]  Williamson A A, Feyer A, Cairns D and Biancotti D. The Development of a Measure of Safety Climate: The Role of Safety Perceptions and Attitudes. Safety Science 1997;25:15-27.
[40]  Vogus T J and Sutcliffe K M. The Safety Organizing Scale: Development and Validation of a Behavioral Measure of Safety Culture in Hospital Nursing Units. Med Care 2007;45(1):46-54.
[41]  Helmreich R L, Merritt A C, Sherman P J, Gregorich S E and Wiener E L. The Flight Management Attitudes Questionnaire(FMAQ). NASA UT/FAA Technical Report 93-4, Austin TX: The University of Texas; 1993.
[42]  Colla JB, Bracken AC, Kinney LM, Weeks WB. Measuring patient safety climate: a review of surveys. QualSaf Health Care. 2005;14:364-366.
[43]  Modak I, Sexton J B, Lux T R, Helmreich R L and Thomas EJ. Measuring Safety Culture in the Ambulatory Setting: The Safety Attitudes Questionnaire – Ambulatory Version. Journal of Gen Internal Medicine, 2007;22:1-5.
[44]  Hospital Survey on Patient Safety Culture: 2009 Comparative Database Report. AHRQ Publication No. 09-0030 March 2009
[45]  Flin, R., Mearns, K., O'Conner, P. &Bryden, R.(2000) Measuring safety Climate: Identifying the common features Safety Science 34, 177 - 192.
[46]  Huang DT, Clermont G, Kong L, Weissfeld LA Sexton JB, Rowan KM, Angus DC. Intensive care safety culture and outcomes: a US multicenter study. International Journal for Quality in Health Care vol.22 no.3 2010. 151-161.
[47]  Weingart SWN, Farbstein K, Davis RB, Philips RS. Using a multihospital survey to examine the safety culture. JtComm J QualSaf. 2004 Mar;30(3):125-32.
[48]  Waterson P, Griffiths P, Stride C, et al. Psychometric properties of the Hospital Survey on Patient Safety Culture: findings from the UK. QualSaf Health Care March 8, 2010.
[49]  Guldenmund FW.(Mis)understanding Safety Culture and Its Relationship to Safety Management. ARisk Anal. 2010 Jul 8.