Hong bo Zhou 1, Qiang Cheng 1, Hong - Ju Yang 2, Hai yun Xu 3
1Department of Computer Science, Southern Illinois University, Carbondale, 62901, IL
2Department of Anatomy, Southern Illinois University, Carbondale, 62901, IL
3Mental Health Center, Shantou University Medical College, Shantou 515065, PR China
Correspondence to: Hai yun Xu , Mental Health Center, Shantou University Medical College, Shantou 515065, PR China.
| Email: |  |
Copyright © 2012 Scientific & Academic Publishing. All Rights Reserved.
Abstract
Prepulse inhibition (PPI) deficits have been seen in various neuropsychiatric disorders, such as schizophrenia, Tourette’s syndrome and Huntington’s disease. How to effectively distinct these PPI deficit subjects from normal ones is a challenging task because the PPI data measured from animal experiments are usually erroneous, incomplete, and unstable. In this paper, we introduce a novel multi-scale Bayesian hypothesis testing (MBHT) method to rectify the PPI data. Specifically, we regard any startle response signal as a deteriorated result from a hypothesis and reconstruct the complete and stable signal using a Bayesian hypothesis testing approach. The multi-scale analysis here is necessary because we cannot directly estimate the proper scale for a hypothesis even we have some statistical quantities of the whole population. By carrying out two sets of animal experiments using different medicines, we show that this MBHT method is much more robust than the conventional method. The analytic methodology proposed in this work can also be applied to similar animal experiments.
Keywords:
Multi-scale Analysis, Prepulse Inhibition Test, Bayesian Hypothesis Testing
1. Introduction
The prepulse inhibition (PPI) refers to the reduction in startle reaction in response to a startle-eliciting “pulse” stimulus when it is shortly preceded by a sub-threshold “prepulse” stimulus[1,11,12]. This test provides an operational measure of sensory gating of subjects. Disruption of PPI has been related to central dopamine hyperactivity[2] and is observed in schizophrenia patients[3-5] and in animal models of this mental disorder[6-8]. In recent studies we established a novel animal model of schizophrenia by exposing young adult C57BL/6 mice to cuprizone (CPZ), a copper chelator. The CPZ-exposed mice show some behavioral changes reminiscent of certain schizophrenia symptoms. One of which is PPI deficit[9, 10]. Furthermore, the PPI deficit can be prevented or attenuated by antipsychotic drugs including clozapine (CLZ) and quetiapine (QTP)[10].The details of PPI test and format of the PPI data has been described before[8,9,11]. The PPI data contain considerable amount of information about the different aspects of a startle response. The raw data of PPI test need to be examined and justified carefully as certain trials may contain questionable data that should be excluded from statistical analysis[11,12]. In addition, we need to consider the following possibilities of causing false PPI data:● Incompleteness (Type I): if an animal’s movement starts before a prepulse is given, the recorded data do not reflect a real startle response to a pulse. ● Incompleteness (Type II): if an animal’s movement happens after the completion of a pulse the recorded data are not related to the pulse too.● Instability (Type I): some animals may shake several times following a given pulse and this will result in several peaks in the response curve.Instability (Type II): the same animal’s startle responses to a given pulse may vary a lot in repeated experiments. Any desirable method for the analysis of PPI test should consider all the above issues. However, as we will show in next sections, the conventional PPI evaluation method fails to take account of these problems.
2. Approach
2.1. Conventional method
A typical PPI test contains the following five types of trials[9-12]: Nos stands for the trial with neither prepulse nor pulse stimulus; P stands for the trial with only a pulse stimulus; PP1 stands for the trial with a pulse and a prepulse stimulus of 3 db above the background level; PP2 stands for the trial with a pulse and a prepulse stimulus of 6 db above the background; PP3 stands for the trial with a pulse and a prepulse stimulus of 12 db above the background.Conventional method starts with computing the averages of Vmax[10] for a trial.  ,
, ,
, , and
, and  are used to denote the averages of Vmax for trials P, PP1, PP2, and PP3, respectively. Then, it proceeds to compute PPIs for three different prepulse levels using the following formula,
 | (1) |
Although widely used[10], this intuitive method doesn’t take account of the possibilities of causing false PPI data as discussed in last section.
2.2. Multi-scale Bayesian Hypothesis Testing
Bayesian hypothesis testing or Bayesian inference[13] refers to a method of statistical inference which estimates the probability of a hypothesis, given some observed evidence[14]. Given observed data and a set of possible
 , the estimation usually takes the following form
 | (2) |
where represents a confidence in choosing the hypothesis
  and
and  is the mathematical symbol for proportionality. This confidence usually comes from both the assumption or prior
  on hypothesis
  and the conditional probability
 .
.  is a set of parameters for generating
  . After we have estimations for all
  , we may estimate the mode by computing the Maximum A Posteriori (MAP)
 | (3) |
Bayesian hypothesis testing has been widely applied in machine learning and data mining[15]. Especially, it has been widely used in many error rectifying scenarios, such as the semantics or word correction in search engine, audio signals[16], and gene expression analysis in bioinformatics[17]. In this work, we explore this powerful technique to rectify the erroneous responses in the PPI data. To achieve this aim in a Bayesian inference way, we first need to give a probabilistic description for the startle response signals.
2.3. Multi-scale Bayesian Hypothesis Testing For PPI Data Analysis
We start with a brief overview of the PPI data. For each animal in a given trial, we repeat the experiment for several times and record a continuous response signal each time. This is named as a basic unit test, and for each trial we have several unit tests using different animals. After putting all signals from all trials together, we extract some useful information such as peak value of each response (Vmax) and time span of each response as the PPI data. These signals might be erroneous, incomplete, and unstable as aforementioned in the Introduction. In an ideal PPI test, we expect to have ideal animals for each unit test. These ideal animals are expected to give the same complete and stable responses in a given trial and thus we can avoid the incompleteness and instability.Different from the conventional method which is based on simple averaging, we propose to use a probabilistic approach to modelling the PPI data. Specifically, for the unit test  , we regard the
  -th measured startle response signal
  as a deteriorated result from a hypothesis
 , where
 is the set of response signals measured in the unit test
  .Under this assumption, a hypothesis can be viewed as the signal generated by an ideal animal. Particularly, we assume the hypothesis
  here is a complete, stable signal controlled by a set of environment parameters
 . Quite often, we only have a set of pooled signals
  for a trial and we cannot differentiate signals for each unit test
  . This further imposes difficulties to the estimation of parameters for each hypothesis and we have to compute
  instead of
  .Intuitively, a hypothesis
  is a continuous signal appeared for a certain length of time. It is controlled by three parameters: type of kernel functions, scale and location. As we observed in PPI tests, the original response signals usually admit a symmetric-bell-like curve so we will directly use the Gaussian function
  and focus on the choice of a proper scale
 . This choice of Gaussian function is also natural in the aspect that we wish the hypotheses are complete and stable. By taking this kernel, the scale
  now has a real-world meaning: it represents the duration of the meaningful response; also, the location can be simply determined by the center of the signal
 . Although we can always estimate the mean and variance of
  ,
,  for the whole population in
  , it is impossible to preset the
  ,
, for a given hypothesis. A simple reason is that a trial
  may contain several ideal animal models or hypotheses. In this study, we propose to use a multi-scale technique to resolve this problem. For a given deteriorated response signal, we will use the Bayesian inference to choose a hypothesis which corresponds to a proper scale. Assuming there are
  different hypotheses, we should have
  different pairs of
  .The environment
  controls the probability of generating a hypothesis signal
  , or equivalently, the proper
  and
and  . We define the conditional probability as
 | (4) |
where  is the population mean for center. Having defined
  , we are in a position to estimate
  , which is the probability that we may get
  given
given  . For each trial, we have
  observations
  which may be associated with the hypothesis
  . Simply assuming these observations are independent given
  , we have
 | (5) |
This equation accumulates confidence through a set of observations. As aforementioned, each  is a deteriorated result from a hypothesis
  . Despite all other distortions in shape and duration, we mainly consider the distortion in the parameter Vmax of
  , which is expected to have the same value as
  of
of  . However, due to the instability and incompleteness in animal experiments, Vmax may be shifted with regard to (w.r.t.) the underlying true
  . We introduce the following conditional probability
 | (6) |
where  is a weight parameter. The above definition for
  shows that if the measured response actually has the same Vmax as the hypothesis, we will have the largest probability to choose this
  and
and  .
.
2.4. Evaluating PPIs using Reconstructed Hypotheses
In fact, for any given trial  , we cannot preset which observations should belong to a hypothesis
  . Fortunately, we usually know the number of unit tests
  for each animal. So we simply choose the first
  observations which are the closest to the
  of a given
  . Putting together, we are able to choose the best hypotheses for any given
  by computing the confidence using Equations (2) and (3). Then, these hypotheses are representative signals for each group. Then we can use the density estimation method introduced in[12] to estimate the averages of these centers
  in each group as the averaged Vmax and again use Equation (1) to get the PPIs.
2.5. Experiment Design and Results
We have used the PPI test as described in previous studies[9,10]. Two independent experiments were performed using young adult male C57BL/6 mice (6-weeks old, 20 to 22 g) purchased from Charles River Laboratories (Wilmington, MA, USA). After an acclimatization period of 10 days, the C57BL/6 mice were randomly assigned to any one of the following four groups (8-12 mice/group) for the first experiment: The CNT group, in which mice ate the standard diet without CPZ; the CPZ group, in which mice ate the diet mixed with CPZ (0.2% by weight); the CLZ group, in which mice received CLZ (10 mg/kg/day) via intraperitoneal injection (i.p.); and the CPZ+CLZ group, in which mice received CPZ and CLZ. The treatment continued for 21 days. On the 22nd day, all mice were subjected to PPI test as described above. The second experiment was designed in the same way as the first one and consisted of the four groups of CNT, CPZ, QTP, and CPZ+QTP. QTP was also administered via i.p. at the dose of 10 mg/kg/day. The treatments continued for 21 days. On the 22nd day, all mice were subjected to PPI test as described above.All animal procedures in this study were in accordance with the National Institute of Health Guide for the Care and Use of Laboratory Animals and were approved by the Animal Care and Use Committee of Southern Illinois University Carbondale.
2.6. Comparing Results from Conventional and MBHT Methods
We computed the PPIs of each animal group by the conventional method and MBHT method. Figures 1 and 3 show PPI distributions computed by the conventional method on the first and the second experiment, respectively; Figures 2 and 4 show PPI distributions evaluated by the MBHT method on the same experiments.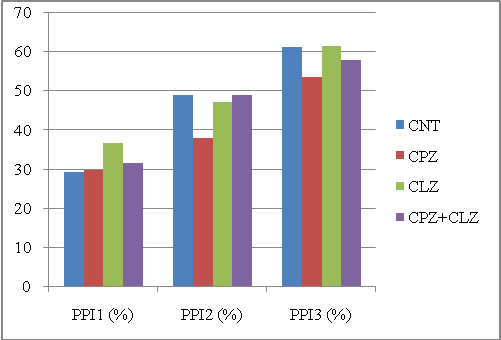 | Figure 1. PPIs of different animal groups in the first experiment computed by the conventional method. Abbreviations: CNT, controls; CPZ, cuprizone; CLZ, clozapine |
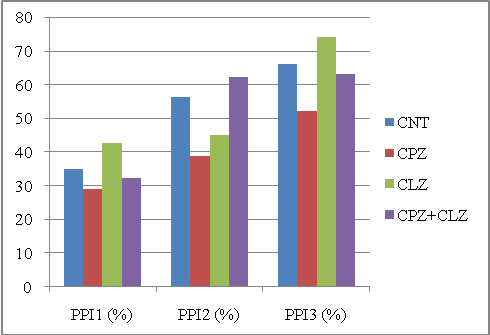 | Figure 2. PPIs of different animal groups in the first experiment computed by the MBHT method. Abbreviations: CNT, controls; CPZ, cuprizone; CLZ, clozapine |
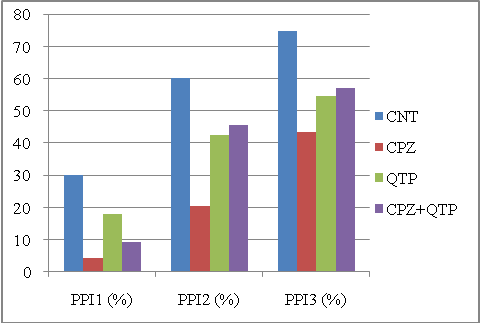 | Figure 3. PPIs of different animal groups in the second experiment computed by the conventional method. Abbreviations: CNT, controls; CPZ, cuprizone; QTP, quetiapine |
Ideally, for these two experiments, the CPZ group should have the smallest PPI for PPI1, PPI2 and PPI3; also, when treated with CPZ+CLZ or CPZ+QTP, the PPI3 should be lower than the CLZ or QTP groups.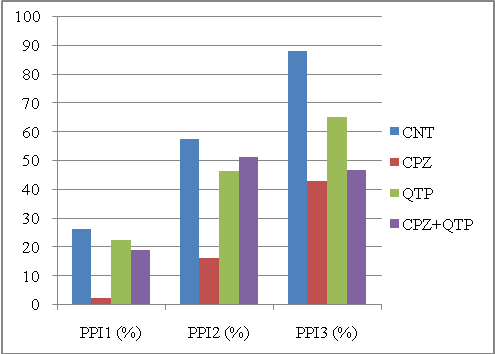 | Figure 4. PPIs of different animal groups in the second experiment computed by the MBHT method. Abbreviations: CNT, controls; CPZ, cuprizone; QTP, quetiapine |
To get a quantitative description, we used a score to measure the separability between CPZ and the other three groups. The score was defined as the sum of squared differences between the CPZ group and all other three groups. Table 1 shows the scores for each method in these two experiments. As shown in the figures, the MBHT method outplayed the conventional method in terms of the ability to distinguish the CPZ groups from other groups. It should be note that the computed PPI1 for CPZ is greater than that of CNT in Figure 1, and our MBHT method can correct this mistake as shown in Figure 2.| Table 1. Comparing the scores for two experiments. Large score means better separability. The MBHT outplays the conventional method |
| | | Experiment I | Experiment II | | Conventional | 5.25e+002 | 4.8788e+003 | | MBHT | 1.90e+003 | 7.6695e+003 |
|
|
We should also point out that MBHT outplayed the conventional method regarding the second criterion. As shown in Figures 2 and 3, the CPZ+CLZ or CPZ+QTP group constantly produce lower PPI than that of CLZ or QTP group; however, the conventional method fails to discover this in Figure 3.
3. Conclusions
The goal of this paper is to introduce a more reliable and sensitive method for robust analysis of erroneous, unstable, and incomplete PPI data. We turn to use a probabilistic method to model the PPI data and use a multi-scale Bayesian hypothesis testing to reconstruct complete and stable signals from deteriorated observations.Comparing with conventional techniques, the MBHT method has some advantages. First, it has the potential to greatly reduce the number of animals because some animals may actually correspond to the same hypothesis. Obviously, this is an animal-friendly advantage. Also, it can decrease the workload for lab researchers. Secondly, the MBHT method appears more robust in terms of its ability to reduce noise and subject variability. The MBHT method reconstructs complete and stable signals from deteriorated observations. The reconstructed responses are relatively insensitive to the noise and subject variability. Finally, we conclude that the proposed multi-scale Bayesian hypothesis testing is effective in rectifying deteriorated signals in similar animal experiments.
References
| [1] | H.S. Hoffman and J.R. Searle, “Acoustic variables in the modification of startle reaction in the rat”, J Comp Physiol Psychol, 68: 280-283, 1965. |
| [2] | N. R. Swerdlow, D. L. Braff, M.A. Geyer and G. F. Koob, “Central dopamine hyperactivity in rats mimics abnormal acoustic startle response in schizophrenics”, Biol Psychiatry, 21: 23–33, 1986. |
| [3] | F. Bolino, V. Di Michele, L. Di Cicco, V. Manna, E. Daneluzzo and M. Casacchia, “Sensorimotor gating and habituation evoked by electro-cutaneous stimulation in schizophrenia”, Biol Psychiatry, 36: 670–679, 1994. |
| [4] | D. L. Braff, C. Grillon and M.A. Geyer, “Gating and habituation of the startle reflex in schizophrenic patients”, Arch Gen Psychiatry, 49: 206–215, 1992. |
| [5] | W. Perry and D.L. Braff, “Information-processing deficits and thought disorder in schizophrenia”, Am J Psychiatry, 151: 363- 367, 1994. |
| [6] | V. P. Bakshi, M. Tricklebank, H.C. Neijt, V. Lehmann-Masten and M.A. Geyer, “Disruption of prepulse inhibition and increases in locomotor activity by competitive N- methyl-D-aspartate receptor antagonists in rats”, JPET, 288: 643–652, 1999. |
| [7] | G. Le Pen and J. L. Moreau, “Disruption of prepulse inhibition of startle reflex in a neurodevelopmental model of schizophrenia: Reversal by clozapine, olanzapine and risperidone but not by haloperidol”, Neuropsychopharmacology, 27: 1–11, 2002. |
| [8] | S.S. Moy, A, Perez, B. H. Koller and G. E. Duncan, “Amphetamine- induced disruption of prepulse inhibition in mice with reduced NMDA receptor function”, Brain Res, 1089: 186–194, 2006. |
| [9] | H. Xu, H.Yang, Y. Zhang Y, R. Clough, R. Browning, X-M Li, “Behavioral and neurobiological changes in C57BL/6 Mice exposed to cuprizone”, Behav Neurosci., 123: 418-429, 2009. |
| [10] | H. Xu, H. J. Yang, B. McConomy, R. Browning and X. M. Li, “Behavioral and neurobiological changes in C57BL/6 mouse exposed to cuprizone: effects of antipsychotics”, Front Behav Neurosci, 4:8. doi:10.3389/fnbeh.2010.00008, 2010. |
| [11] | H. Zhou, Q. Cheng, , Xu, “A new computational tool for the post session analysis of the prepulse inhibition test in neural science”, 1077-1080, 2009. |
| [12] | H. Zhou, H. Yang, H. Xu, Q. Cheng, "Weighted kernel density estimation of the prepulse inhibition test", Journal of Computer Science, 7 (5): 611-618, 2011. |
| [13] | R. A. Fisher, "Statistical Methods for Research Workers", Edinburgh: Oliver and Boyd, 1925, P.43. |
| [14] | E.L. Lehmann and J. P. Romano, "Testing Statistical Hypotheses", New York: Springer, 3ed ,1997. |
| [15] | C.M. Bishop, "Pattern Recognition and Machine Learning", Springer, 2007. |
| [16] | S.J. Godsill and P.J.W. Rayner, "A Bayesian approach to the detection and correction of error bursts in audio signals," In Proceeding of ICASSP, 2:261-264, 1992. |
| [17] | J. Yuan,Y. Lu and G. B. Mills, "Bayesian models based on test statistics for multiple hypothesis testing problems", Bioinformatics, 24 (7): 943-949, 2008. |
 Abstract
 Reference
 Full-Text PDF
 Full-Text HTML