
-
Paper Information
- Paper Submission
-
Journal Information
- About This Journal
- Editorial Board
- Current Issue
- Archive
- Author Guidelines
- Contact Us
American Journal of Intelligent Systems
p-ISSN: 2165-8978 e-ISSN: 2165-8994
2026; 15(1): 7-37
doi:10.5923/j.ajis.20261501.02
Received: Sep. 1, 2026; Accepted: Sep. 19, 2026; Published: Sep. 22, 2026

A Software-in-the-Loop Platform for the Simulation, Integration and Validation of Multi-Sensor Navigation, Hydrographic and Geophysical Survey Systems
 Abstract
 Reference
 Full-Text PDF
 Full-text HTML
Michel Mfeze1, Raphael Nlend2, Eric Deussom1
1Laboratory of Electrical Engineering, Mechatronics and Signal Processing, National Advanced School of Engineering of Yaounde (ENSPY), University of Yaounde I, Cameroon
2University of Yaounde I
Correspondence to: Michel Mfeze, Laboratory of Electrical Engineering, Mechatronics and Signal Processing, National Advanced School of Engineering of Yaounde (ENSPY), University of Yaounde I, Cameroon.
| Email: |  |
Copyright © 2026 The Author(s). Published by Scientific & Academic Publishing.
This work is licensed under the Creative Commons Attribution International License (CC BY).
http://creativecommons.org/licenses/by/4.0/

Modern hydrographic, geophysical and maritime navigation systems assemble dozens of heterogeneous instruments that exchange data in incompatible formats over serial and Internet Protocol links, and the resulting acquisition chains must be verified before any offshore campaign. Verification is still performed mostly at sea, where it is expensive, weather-dependent, hard to reproduce, and unable to recreate critical conditions such as satellite loss or signal degradation. The objective of this paper is to design, implement and evaluate a bidirectional software-in-the-loop platform, LSUGeoSimulator, that emulates the output of survey and navigation instruments and, within the same interface, tests the output port of a real instrument. Written in object-oriented Java, the platform organizes 36 equipment categories, 133 instruments and several hundred sentence formats in a three-level hierarchy, and routes every stream through a single connection abstraction supporting serial, Transmission Control Protocol and User Datagram Protocol links in both directions. A contextual error model injects noise whose bounds are read from one of three user-selectable sources: a real-time kinematic model, an International Hydrographic Organization S-44 order of survey, or a degraded model. An independent adversarial layer generates replay, checksum-desynchronization and spatio-temporal inconsistency streams, while a multi-language scripting engine, session persistence and inter-protocol forwarding provide automation. The platform was evaluated along five axes: exhaustiveness, realism, bidirectionality, concurrency and reproducibility. Generated sentences proved syntactically valid and temporally consistent, and their dispersion remained inside the uncertainty budget declared by the selected error model. Received streams were decoded, counted, logged and automatically compared with the expected sentence, so that a live pass-or-fail indication is produced without character-by-character inspection. Dozens of instruments ran concurrently under a bounded thread pool with unified throughput accounting. The platform therefore provides a reproducible test bench that transfers integration risk from the sea to the laboratory and reduces the cost and lead time of offshore commissioning.
Keywords: Sensor Simulation, NMEA 0183, Software-in-the-Loop, Maritime Navigation, Hydrographic Survey, Equipment-Output Testing, Error Modelling, Maritime Cybersecurity, Digital Twin
Cite this paper: Michel Mfeze, Raphael Nlend, Eric Deussom, A Software-in-the-Loop Platform for the Simulation, Integration and Validation of Multi-Sensor Navigation, Hydrographic and Geophysical Survey Systems, American Journal of Intelligent Systems, Vol. 15 No. 1, 2026, pp. 7-37. doi: 10.5923/j.ajis.20261501.02.
Article Outline
1. Introduction
- Modern hydrographic, marine geophysical surveying and maritime navigation all result from the fusion of numerous sensors and systems: Global Navigation Satellite System (GNSS) receivers, gyrocompasses, bathymetric echo sounders, acoustic Doppler current profilers, inertial navigation systems and acoustic positioning systems with an ultra-short baseline (USBL) or a long baseline (LBL). Each of these instruments delivers data in a format that is frequently proprietary, carried over serial interfaces such as RS-232 and RS-422, over Ethernet using the Transmission Control Protocol (TCP) or the User Datagram Protocol (UDP), or over dedicated buses. The growing complexity of offshore missions, which now include seabed mapping, pipeline inspection, cable laying and remotely operated vehicle operations, together with the emergence of maritime autonomous surface ships, imposes strict interoperability requirements and a rigorous validation of every acquisition chain [1], [2].This validation is traditionally carried out during sea campaigns whose daily cost is high and whose schedule is exposed to weather and logistical hazards. Any incompatibility discovered at that stage generates a substantial additional cost, because the vessel, the crew and the equipment are already mobilized. Several critical conditions are, moreover, almost impossible to reproduce deliberately offshore: loss of satellite tracking, degradation of the differential correction link, intentional jamming or spoofing of a positioning signal. The hardware-in-the-loop (HIL) and software-in-the-loop (SIL) approaches proven in the aerospace and automotive industries transfer this risk to the laboratory by modeling the environment and the sensors [3]. Their adoption in the marine domain is growing, from dynamic positioning to autonomous surface and underwater vehicles [4], [5], [6].
1.1. Problem Statement
- Transferring marine acquisition-chain validation to the laboratory nevertheless presupposes a software layer able to reproduce the native streams of the instruments involved. The tools currently available for that purpose exhibit five recurring limitations. First, excessive specificity: most of them address a single manufacturer or a single instrument family, so that users cannot assemble a realistic multi-vendor bench from one tool. Second, lack of realism: sentences are generated in an ideal form, without noise, bias, or drift, so that a receiving application is never confronted with the dispersion it will meet at sea. Third, poor ergonomics: command-line operation excludes the survey operators and the integration engineers who are precisely the intended users. Fourth, limited network support: these tools struggle at a time when shipboard data buses are massively migrating to Internet Protocol communications. Fifth, weak extensibility: adding one format usually requires editing and recompiling the source code.A sixth limitation, more fundamental than the previous five, is that these tools operate in a single direction. They emit. Integration work, however, requires the symmetrical operation just as often: verifying that a real device actually delivers the expected message, on the expected port, at the expected baud rate and in the expected protocol. That verification is currently performed with generic terminal software that knows nothing about the sentence that ought to arrive, so the operator must compare the incoming characters with a datasheet manually. The central research problem addressed in this paper follows from these observations and can be stated as follows: how can a simulation platform be designed that is simultaneously exhaustive, realistic, ergonomic, multi-protocol, extensible and bidirectional, so that it can serve as a reproducible software-in-the-loop test bench for the integration of shipborne survey and navigation systems?
1.2. Novelty and Contributions
- The novelty of this work lies in the combination of four elements that, to the best of the authors' knowledge, have not previously been brought together in a single platform. The first element is a reference software architecture for the simulation of heterogeneous survey sensors, organized around a three-level format hierarchy and a unified connection abstraction that serves emission and reception identically. The second is a bounded contextual error-injection model whose bounds are not hard-coded constants but are read at generation time from a user-selectable source, so that a generated stream becomes explicitly traceable either to a real-time kinematic (RTK) solution, to a declared order of survey of the International Hydrographic Organization (IHO) Standard S-44 [8], or to a degraded, uncorrected-positioning scenario. The third is a bidirectional operating principle that pairs instrument emulation with a reception mode testing the output port of a real instrument, and that exploits the format declared by the instance to compare every incoming sentence with the sentence that ought to arrive, giving an automatic and immediate conformance indication. The fourth is an adversarial perturbation layer, independent of the metrological error model, that reproduces replay, checksum desynchronization and spatio-temporal inconsistency, and thereby turns the platform into a controlled generator of spoofed streams for the evaluation of anomaly detectors.These four elements are complemented by an automation suite, comprising a multi-language scripting engine, session persistence and inter-protocol forwarding, which opens the way to reproducible testing and to continuous-integration pipelines. The remainder of the paper is organized as follows. Section 2 reviews the standards, the simulation tools and the related research that define the state of the art, and identifies the gap that the platform fills. Section 3 describes the architecture and the methodology, from the hierarchical data model and the connection abstraction to sentence generation, the error model, multi-protocol communication and forwarding, the reception mode and the automation services. Section 4 presents the results and the evaluation. Section 5 discusses the findings, the novelty, the cybersecurity implications and the limitations. Section 6 concludes and outlines future work.
2. Literature Review
2.1. Standards and Shipborne Acquisition Chains
- The NMEA 0183 standard of the National Marine Electronics Association remains the common language of shipborne electronics. It defines delimited ASCII sentences, protected by an exclusive-or checksum and historically transmitted at 4800 baud over a differential serial link [7]. Its version 4.30, published in 2023, adds integrity mechanisms and extends the talker and sentence sets, but the native absence of encryption and of authentication is structural and has not been removed [7]. In practice, the standard coexists with a large body of proprietary formats: manufacturers of echo sounders, inertial units, acoustic positioning systems and side-scan sonars have each defined their own ASCII, comma-separated or binary encodings, and a single survey spread routinely carries 15 to 30 distinct formats simultaneously. This heterogeneity is the practical reason why acquisition-chain integration is a recurring source of delay.On the quality side, the requirements applicable to hydrographic surveys are codified by the IHO standard S-44 [8], which defines orders of survey and, for each of them, a total horizontal uncertainty and a total vertical uncertainty at the 95% confidence level. Those figures are the reference against which a survey system is accepted, and they therefore constitute the natural basis for any realistic error model: a simulator that claims realism must produce dispersions consistent with the order of survey being emulated, and not merely add arbitrary noise.
2.2. Simulation of Sensor Streams
- Three families of tools are currently used to produce marine sensor streams. The first family consists of generic NMEA sentence generators, usually free, which cover a small number of GNSS sentences and emit them on a serial port at a fixed rate. They are easy to use but they are limited to a handful of formats, they produce ideal values, and they ignore network transports. The second family consists of the simulation modules embedded in commercial acquisition or navigation suites. These are powerful and faithful, but they are closed, tied to the vendor ecosystem, licensed at a cost comparable to the acquisition software itself, and generally unable to emulate a competitor's instrument. The third family consists of scripts written ad hoc by integration engineers, typically in Python. They are infinitely flexible, but they are not reusable, they are undocumented, they depend on their author, and they exclude the non-developer operator.A fourth and more recent family has emerged from marine robotics. HoloOcean, an open-source underwater simulator built on a game engine, provides multi-agent support, a range of underwater sensor implementations and a sonar model based on an octree representation of the environment [9]. Comparable frameworks target graphics-accelerated underwater perception. These simulators are excellent at reproducing the physics of the environment and the perception of a vehicle, but they deliver their output through their own programming interface rather than in the native sensor formats that a shipborne acquisition system expects. They therefore address a complementary problem: they simulate what the vehicle sees, whereas the platform presented here simulates what the instruments say.
2.3. Hardware-in-the-Loop and Software-in-the-Loop Testing
- Hardware-in-the-loop testing has become a de facto standard for validating marine control systems, from dynamic positioning to collision avoidance. A representative implementation couples a programmable logic controller with two computers, one hosting the path planner and the other simulating the scenario and the ship model, in order to test a maritime autonomous collision avoidance system [3]. Recent benches emulate the environment of an autonomous sailboat in real ocean conditions [4], use an open-source underwater robotics simulator as the environment model of such a bench [5], or couple physics-based numerical models of fluid-structure interaction with a visual ocean system [6]. Surveys of autonomous collision avoidance at sea [29] and learning-based avoidance policies evaluated entirely in simulation [30] confirm that the verification of shipborne autonomy is now inseparable from the quality of the simulated inputs, and comparative studies of adaptive collision avoidance systems show that the conclusions drawn depend strongly on the behaviour attributed to the simulated target ships [33]. Test-scenario generation has itself become a research topic, with frameworks for the safety evaluation of automatic collision avoidance [10], adaptive generation of high-risk scenarios by reinforcement learning [11], and virtual-reality fusion testing validated on a real vessel [12].A common feature of these studies is that they model the dynamics of the carrier and the geometry of the encounter, and then assume that a layer able to deliver the corresponding sensor streams in native format is available. Researchers rarely discuss that assumption, and off-the-shelf tools almost never satisfy it. The platform described in the present paper is precisely that missing layer, and it is therefore complementary to, rather than in competition with, the benches cited above.
2.4. Digital Twins and Autonomous Ships
- The digital twin is establishing itself as a framework for the safe simulation of embedded algorithms [13], with reviews dedicated to the maritime domain [14] and applications combining virtual reality with numerical simulation for ship path planning [15]. Situational awareness on autonomous ships relies on the fusion of many sensors and on artificial-intelligence methods [2], and the corresponding algorithms must be trained and validated on large volumes of representative data. Trajectory prediction from Automatic Identification System (AIS) messages, for example, is now addressed with deep sequence models whose performance depends directly on the realism of the data used [16], [32], and unsupervised detectors of anomalous tracks are trained on the same kind of material [34]. A simulator able to reproduce the noisy streams of a complete sensor suite, including their formats, their rates and their defects, is therefore a prerequisite both for the construction of digital twins and for the supervised training of perception systems.
2.5. Underwater Positioning and Its Error Budgets
- Positioning an underwater vehicle combines acoustic systems (USBL, SBL and LBL), inertial sensors and Doppler velocity logs, each with its own error budget and failure modes. A recent comprehensive review of positioning systems for unmanned underwater vehicles surveys these technologies and the way they are integrated to improve accuracy and operational efficiency [17]. Work on long-range LBL navigation shows that systematic effects such as acoustic ray bending, the Doppler effect and Earth curvature degrade accuracy significantly and must be compensated explicitly [18], while tightly coupled inertial and LBL architectures address the case in which few hydrophones are available [19]. Calibration of an inertial measurement unit by acoustic long-baseline observations has likewise been shown to improve underwater navigation performance [20]. Real-time ray-based range prediction under ice has been shown to bring long-baseline re-navigation errors down to the metre level [35]. High-precision distance-difference localization has been formulated for long-baseline measurement [31], and the establishment of seafloor geodetic networks has been reviewed together with its key technologies [36]. The classical treatment of integrated navigation gives the corresponding analytical framework [28]. These studies document the orders of magnitude that an error model must reproduce if the streams it generates are to be credible for the receiving software.
2.6. Maritime Cybersecurity and Stream Integrity
- Because NMEA 0183 carries neither authentication nor encryption, any device with access to the shipboard bus can inject sentences that the receiving equipment will accept. GNSS and AIS spoofing are documented threats, and dedicated risk models have been proposed to predict AIS spoofing attacks on board [21]. Broader analyses of maritime cyber-security threats and security models in cross-border shipping confirm that operational technology, and navigation systems in particular, remains a weak point [22]. On the defensive side, low-cost anomaly detection based on the monitoring of NMEA sentence integrity has been shown to detect maritime GNSS spoofing without replacing the existing receivers [23]. Such detectors, however, need to be trained and evaluated on datasets that contain both nominal and deliberately corrupted streams, and those datasets are difficult to obtain from real operations. The ability to generate controlled corrupted traffic is therefore a direct contribution to this line of research.
2.7. Synthesis and Research Gap
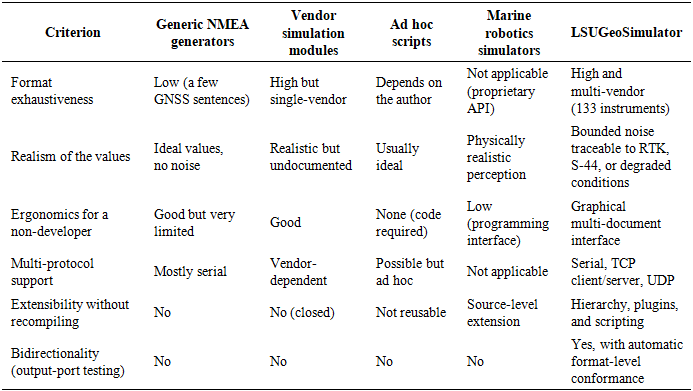
- Table 1 summarizes the comparison between the four families of tools reviewed above and the platform proposed in this paper, across the six criteria derived from the problem statement of Section 1.1. The comparison shows that no existing family satisfies more than three of the six criteria, and that none of them is bidirectional.
|
3. Architecture and Methodology
- The design proceeds top-down, from an analysis of the use cases to the resulting software architecture. Figure 1 summarizes the actors addressed by the platform, namely the integration engineer, the survey operator, the geophysics researcher and the cybersecurity tester, together with their use cases.
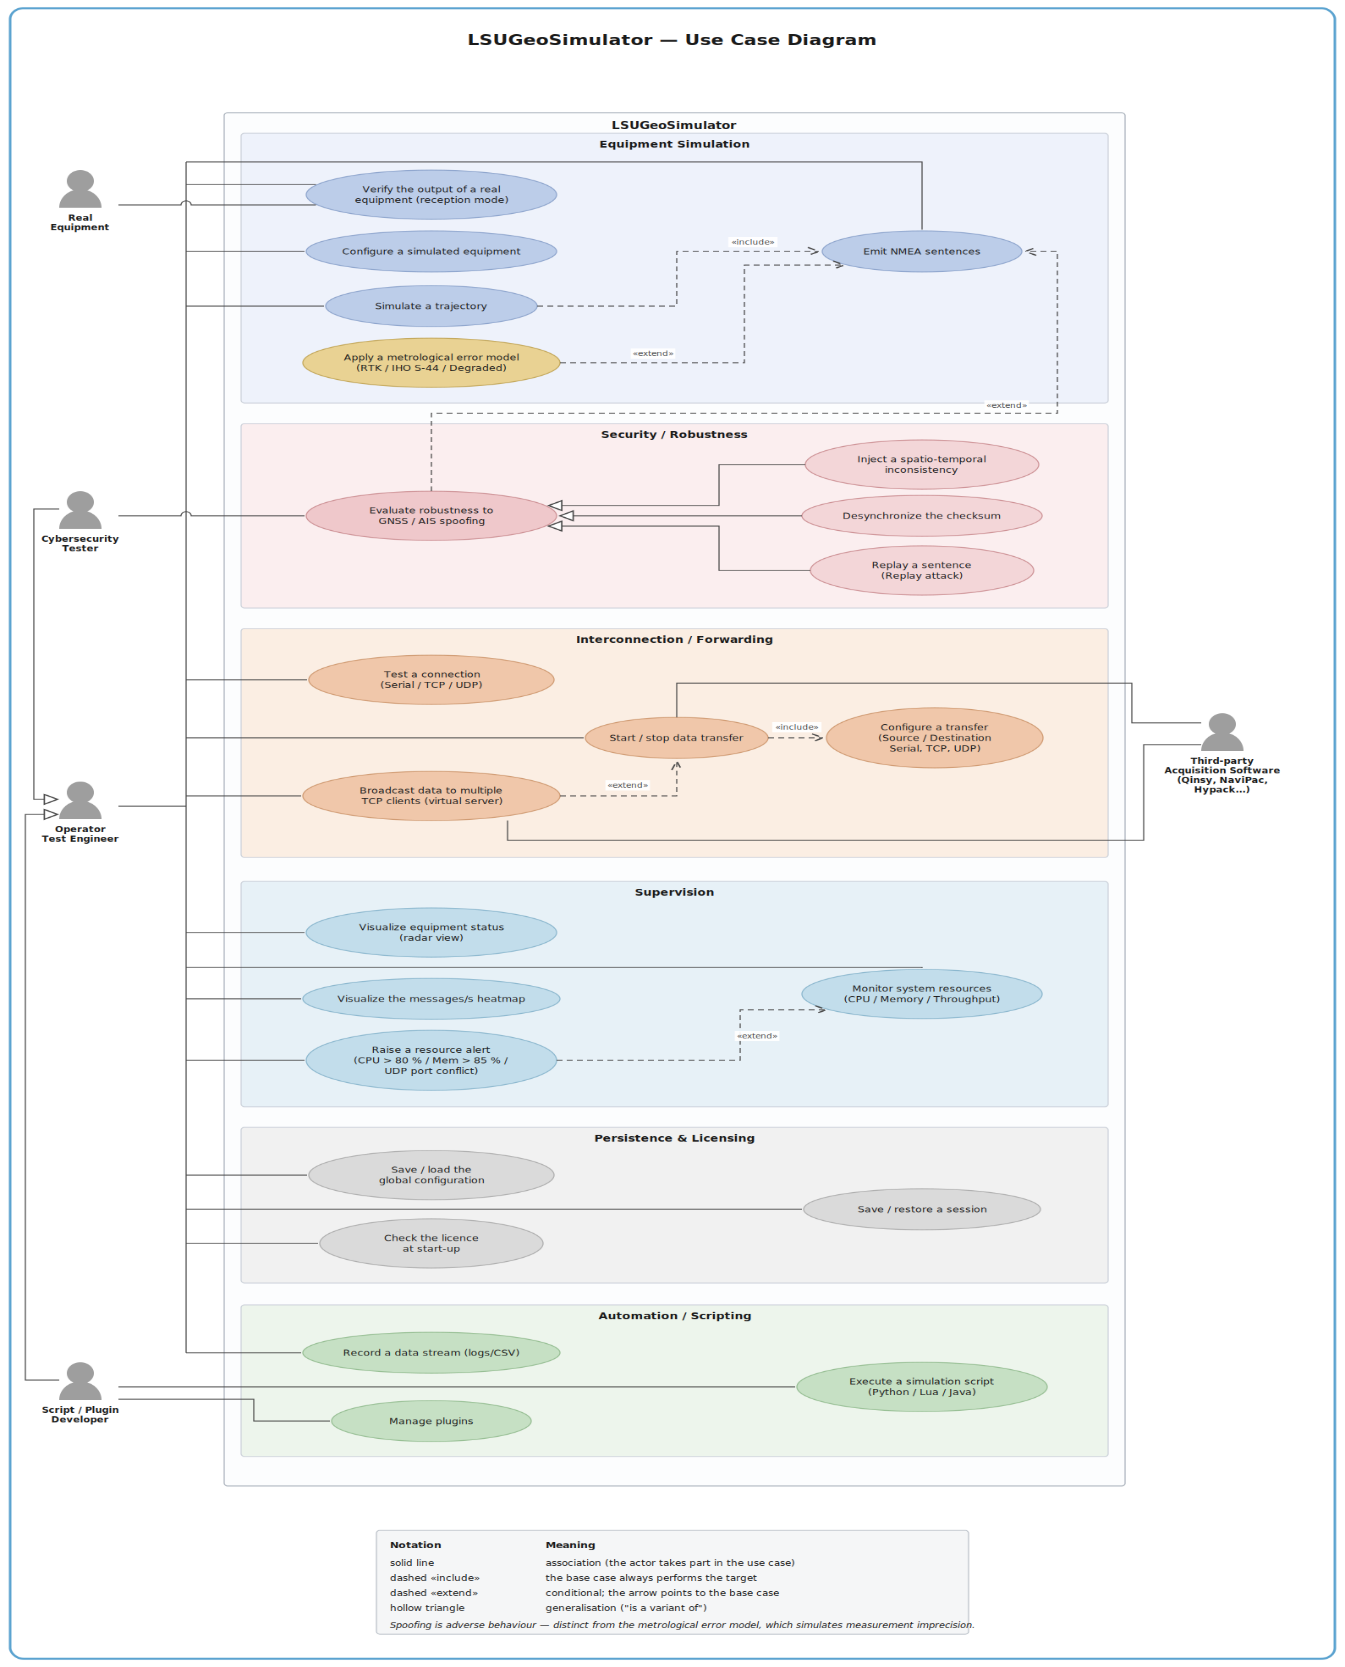 | Figure 1. Use-case diagram of the platform and the four actors it addresses. The cybersecurity tester exercises the spoofing layer through an extend relation towards sentence simulation |
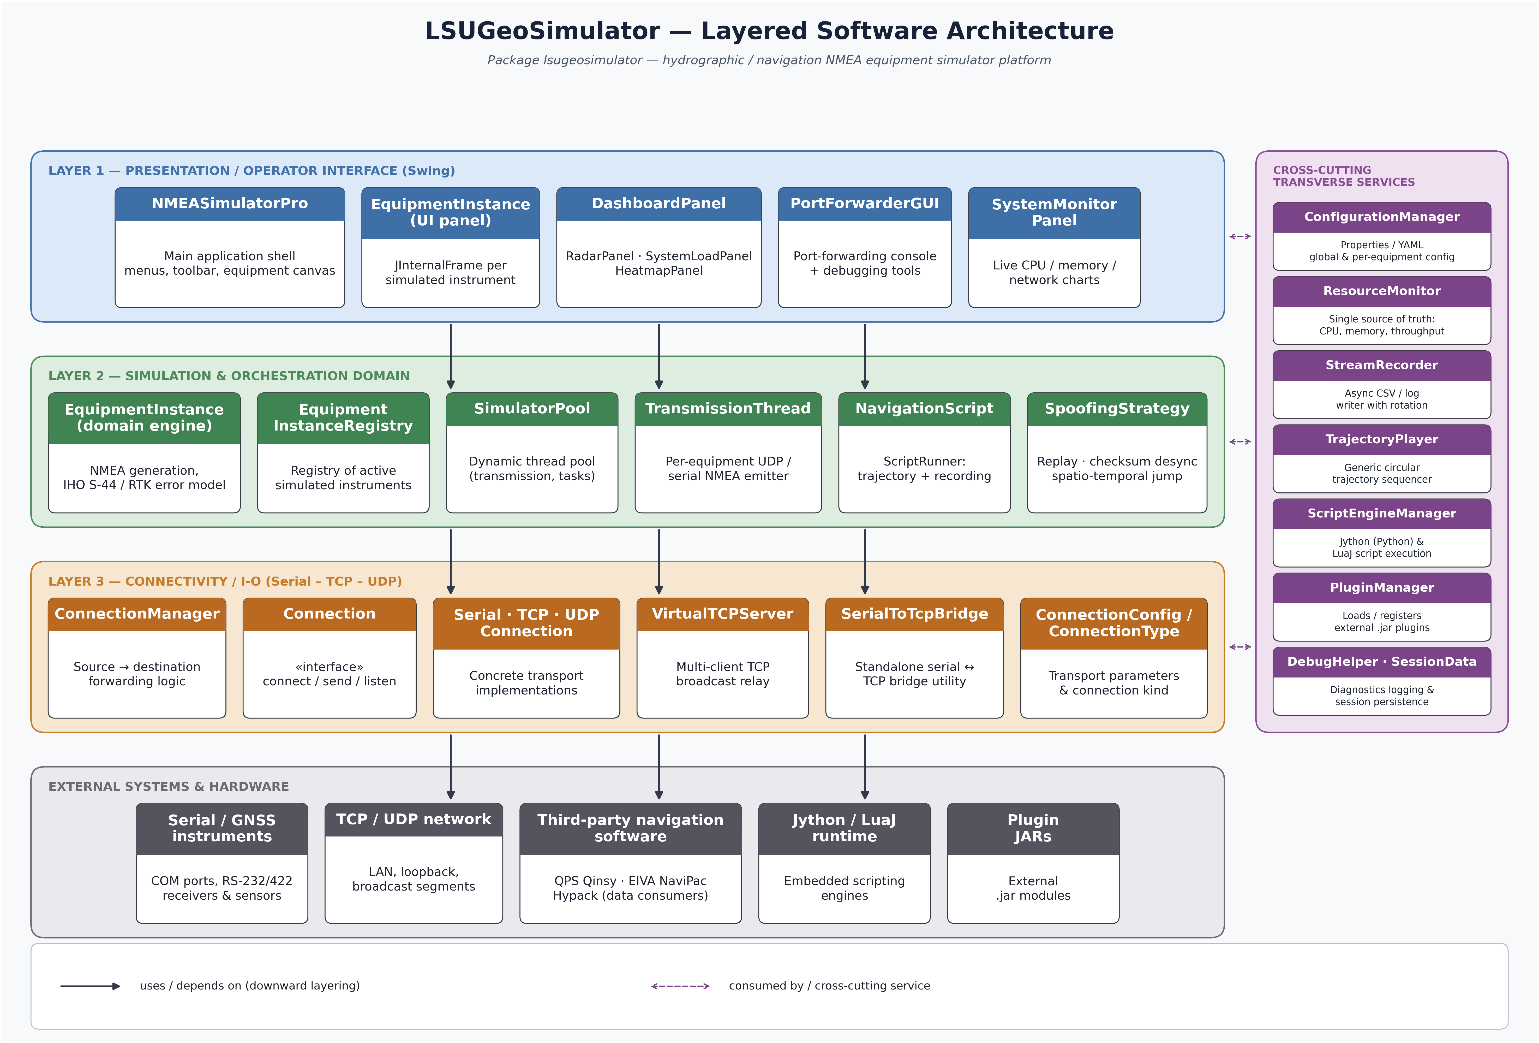 | Figure 2. Layered software architecture of LSUGeoSimulator, comprising the presentation layer, the business core.., the service layer, the communication layer and the external environment. The Trajectory Player and the Stream Recorder belong to the service layer, and the Spoofing selector belongs to the business core |
3.1. Hierarchical Data Model
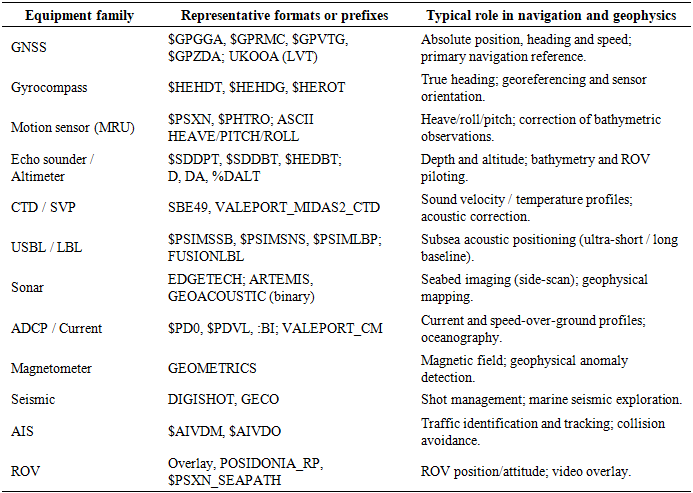
- Equipment is described by a three-level hierarchy, from category to instrument and then to prefix or format, materialized by a static linked hash map named EQUIPMENT_HIERARCHY that preserves insertion order. The hierarchy covers categories ranging from fundamental systems such as GNSS receivers, gyrocompasses and echo sounders to specialized families such as AIS, conductivity-temperature-depth and sound-velocity profilers, cathodic protection, and the proprietary hydrographic outputs of the Atlas, CODA, ELAC, NaviPac and PHINS or ROVINS families. This structure drives the user interface directly and enforces configuration consistency, while a keyword search bar accelerates the location of a format. In total, 36 categories group 133 instruments and several hundred prefixes. Table 2 gives a representative overview, and the exhaustive catalogue is provided in the Appendix.
|
3.2. The Equipment Instance
- Each virtual instrument is encapsulated in an internal frame, the EquipmentInstance class, which gathers the simulation state, comprising the transmission and listening flags and the port configuration; the input components, namely the combo boxes and the text fields as well as the generation logic implemented by the generateNMEAMessage method and the communication managers. The multi-document interface of the supervisor allows the operator to instantiate, move, and supervise many instruments simultaneously, which reflects the topology of a real shipborne network.
3.3. Connection Abstraction
- All links implement a common Connection interface exposing the connect, disconnect, sendData, setDataListener, and getConnectionInfo methods. Three realizations exist: SerialConnection, built on the jSerialComm library [24] with a message delimiter and an event listener; UDPConnection, which uses a datagram socket in bind or broadcast mode with a dedicated receive thread; and TCPConnection, which supports client and server modes with accept and read threads and an ordered resource shutdown. This decoupling, consistent with classical design patterns [25], [26], allows one transport to be substituted for another without modifying the business logic, and it is used for both emission and reception. The configuration of each link is carried by a serializable ConnectionConfig object selected by a ConnectionType enumeration, which unifies the serial and network parameters in a single structure.
3.4. Supervision and Configuration
- A resource monitor periodically samples the processor and memory load of the Java virtual machine through a scheduled executor service and detects UDP port conflicts, notifying the user. The dashboard provides a real-time visualization comprising an equipment radar view, system-load gauges, a heatmap of throughput expressed in messages per second, and a system monitor plotting processor, memory, and network time series. Global and per-instrument configuration is persisted in the properties format, with a YAML fallback resolved by reflection, and defines the network, serial, transmission and security parameters.Traffic metrics, namely messages, bytes and packets, are unified in the resource monitor through the recordMessageSent, recordBytesTransferred and recordPacketTransferred methods. Both emission paths, that is the main transmission loop and the script-facing sendNMEASentence method, feed the same counters, so that the dashboard has a single consistent source for the heatmap and the throughput indicators under every mode of use.
3.5. Concurrency, Persistence and Bootstrap
- Long-running tasks, that is per-instrument emission or listening, monitoring, and plugins, are delegated to a dynamic thread pool built on a thread-pool executor configured with two core threads, 10 maximum threads and a keep-alive time of 60 seconds. Each emission is submitted as a runnable transmission thread, which bounds the memory footprint when dozens of instruments run simultaneously. The complete state of a session is serialized as a SessionData object aggregating EquipmentData items, each of which records the category, the instrument, the prefix, the field values, the connection configuration, the window geometry and the transmission and listening states, so that a test bench can be restored identically. A registry indexes the instances for the port forwarder, while the entry point performs a licence check before instantiating the supervisor, which in turn builds the thread pool, the plugin manager, the resource monitor and the dashboard. Figure 3 summarizes this connection, forwarding and concurrency subsystem.
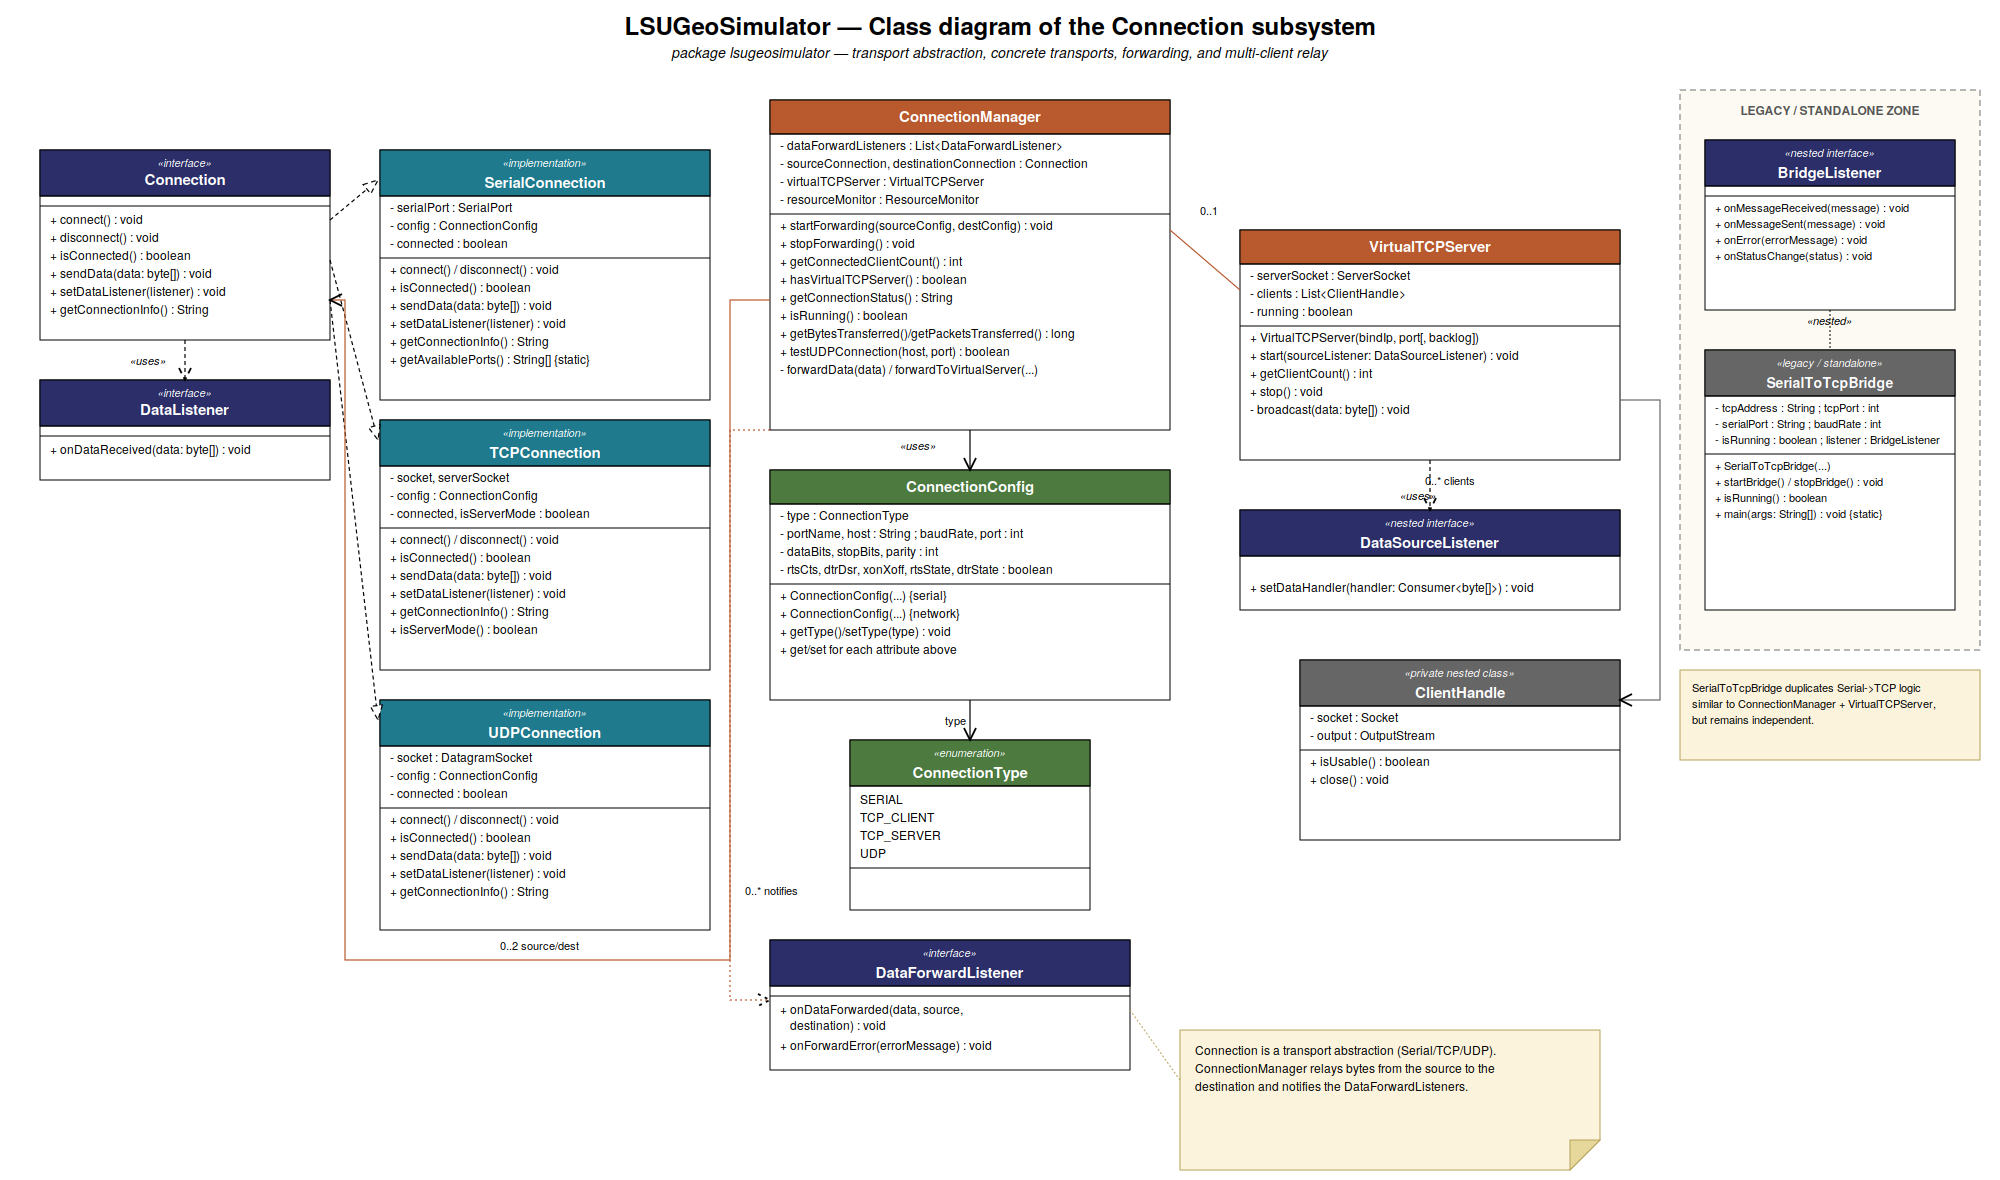 | Figure 3. Class view of the connection subsystem: the Connection interface and its serial, UDP and TCP realizations, the forwarding manager, the multi-client virtual TCP server, and the concurrency, persistence and bootstrap layer. The resource monitor is the single source of truth for traffic metrics |
3.6. Sentence Generation and Contextual Error Model
- For each selected prefix, the updateInputFields method builds the relevant parameter fields, such as latitude, longitude, depth or heading, and populates them with realistic default values. Generation then assembles the current field values into the target string. For NMEA sentences, a checksum is computed by an exclusive OR of the characters located between the dollar sign and the asterisk, and is formatted as two hexadecimal digits after masking with 0xFF, in accordance with the standard [7]. The Coordinated Universal Time and date fields are refreshed by a timer so that the temporal consistency of the streams is preserved.Realism is introduced by the maybePerturb method, which is invoked on every input field immediately before assembly. The method infers the physical category of each field from its label, distinguishing latitude and longitude; easting, northing and position; heading, course, bearing, azimuth, roll, pitch and yaw; depth, altitude and heave; speed and velocity; and a generic class covering range, pressure, temperature, dilution of precision and similar quantities. It then adds an offset drawn from a uniform distribution whose half-width is specific to the category. That half-width is not a fixed constant: it is looked up at generation time from one of three user-selectable error models exposed as a selection menu in the equipment panel. The RTK model provides sub-decimetre bounds representative of a fixed real-time kinematic solution under nominal conditions. The S-44 model derives its bounds from a second combo box that selects one of the four orders of survey, namely Exclusive Order, Special Order, Order 1a or 1b, and Order 2, following the uncertainty formulation of the standard [8]. The Degraded model corresponds to a widened, uncorrected-positioning scenario and retains a horizontal bound of 100 metres.For the RTK and Degraded models, the category bounds are fixed constants and are listed in Table 3. For the S-44 model the horizontal bound is the total horizontal uncertainty of the selected order, given by
 | (1) |
 is the depth in metres,
 is the constant term of the order and
 is its depth-proportional coefficient. The value is converted into degrees by division by 111,320 metres, an equatorial approximation that deliberately ignores the longitude correction in
 .
 | (2) |
 represents the part of the uncertainty that does not vary with depth and
 the coefficient of the part that does. The angular bound uses the roll and pitch ceiling of the selected order. The four orders and their coefficients are given in Table 4. The depth
 is read from a depth or altitude field among those currently displayed for the sentence being generated, and falls back to a nominal 10 metres when no such field is present, which is the case for sentences such as GPVTG that carry no depth information of their own.
|
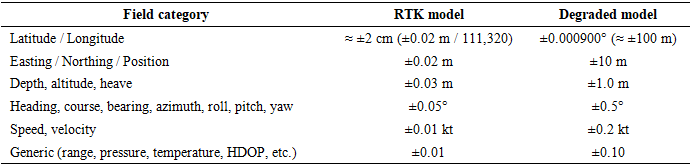
|

3.7. Adversarial Perturbation Layer
- A second and independent perturbation layer addresses adversarial rather than metrological noise. Whereas the error model described above reproduces the imprecision that a sensor exhibits under normal operation, this layer reproduces the manipulation that an attacker would deliberately inject, that is, the class of threat represented by GNSS and AIS spoofing and discussed in Sections 2.6 and 5.3. The layer is exposed as a fourth combo box, labelled 'Spoofing', placed next to the error-model selector, and it offers three modes.The Replay mode periodically re-emits an earlier captured value in place of the current one, tracked per field label with a short rolling history, which mimics an attacker recording and rebroadcasting a legitimate signal. The Checksum Desync mode corrupts the checksum returned by the calculateChecksum method with a bounded probability, so that the receiver sees a structurally valid frame carrying an invalid checksum, simulating data corrupted or tampered with in transit. The Spatio Temporal Inconsistency mode injects, on latitude and longitude fields only, position jumps that are inconsistent with the declared speed and heading, creating a forged position that a plausibility check should be able to catch.Because the checksum desynchronization is wired into the single, centrally shared checksum method, it applies uniformly to every sentence-generation path, including the instrument-specific ones, without any of them having to be modified individually. The three modes are selected independently of the metrological error model, so that a nominal S-44 stream and a spoofed stream can be produced from the same instrument configuration by changing one selector.
3.8. Multi-Protocol Communication and Forwarding
- The transmission thread reads the instrument configuration, opens the chosen transport and periodically emits the generated sentence. An economy mode reduces the emission rate in order to limit the load. A dedicated gateway module illustrates serial-to-TCP relaying with automatic reconnection. Beyond simple emission, the forwarding module acts as a software converter between a source and a destination of different types, that is, serial, TCP client, TCP server or UDP. When a UDP or serial source must feed a TCP client, a virtual TCP server is instantiated dynamically on the local address and the destination port, which resolves the client and server asymmetry. The transferred volume is counted in bytes and packets, and a visual indicator signals activity. This capability reproduces the protocol repeaters and converters commonly inserted in shipborne architectures and allows third-party acquisition software listening on Internet Protocol to receive it. The virtual TCP server accepts and broadcasts to several simultaneously connected clients, so that several acquisition packages can consume the same forwarded stream at once, and a live client-count indicator is displayed in the forwarder window.
3.9. Reception Mode and Equipment-Output Testing
- The platform is not limited to emulating instruments. It is bidirectional. Each instance can switch to a reception mode that interfaces and tests the output port of a real instrument. Activating the Listen Port control binds the same Connection object (serial, UDP or TCP) as an input. Incoming bytes are delivered through the onDataReceived callback of the data listener, time-stamped, displayed in the activity log and tallied by a received counter.Because the instance already declares the expected type, instrument, message format and output-port configuration, for instance, the SDDPT sentence of a single-beam echo sounder or the GPHDT sentence of a gyrocompass, the operator can immediately check that the equipment under test delivers the correct sentence and that this sentence is correctly received and decoded. The sample message that the platform would itself produce for the same instrument, labelled Generated Message during emission, becomes the Expected Message during reception, and serves as the reference against which conformance is judged. Every incoming sentence is automatically compared with it at the format level, that is, on the prefix and the field count, irrespective of the perturbed values. A match turns the activity-log text green and a mismatch returns it to black.This mechanism provides a live pass or fail indication that spares the operator a manual, character-by-character comparison. The received stream can be filtered so that only NMEA sentences are retained, and can be recorded to a time-stamped log file for later analysis. The reception mode therefore turns the tool into a lightweight acceptance testing and troubleshooting bench for sensor output ports: it answers the practical question of whether a given device, on a given port and with a given baud rate or protocol configuration, actually outputs the expected message. That question arises constantly during integration, factory acceptance testing, and shipboard fault diagnosis. Combined with the forwarding module, an instance can listen, validate, and simultaneously relay the stream towards third-party acquisition software, so that emission, reception and forwarding share one connection abstraction and one user interface.
3.10. Automation: Scripting, Services and Persistence
3.10.1. Multi-Language Scripting Engine
- A script manager integrates, by reflection and without any hard dependency, a Python interpreter and a Lua environment, with variable injection and output retrieval. More unusually, the supervisor also supports dynamic Java compilation. A Java script implementing the ScriptRunner interface is compiled in memory through the Java compiler of the tool-provider application programming interface, loaded by a dedicated class loader, and then executed with full access to the simulator interface, that is, the equipment list, the transmission control, and the logging facilities [27]. Scripts therefore allow reproducible scenarios such as a sequenced start-up, a heading change, a signal loss, or a report generation to be orchestrated without recompiling the application. The variable contract exposed to scripts, namely the equipment collection and the simulator object injected into the run method, is documented explicitly for the three coexisting mechanisms, and four ready-to-use examples are loadable directly from the scripting tab so that the user starts from verified code.
3.10.2. Reusable Trajectory and Recording Services
- A bundled navigation script illustrates the automation. It enumerates and configures the instruments, simulates a trajectory from a configurable centre by emitting consistent GPGLL and GPVTG sentences, and then records the data in a time-stamped log file with parsing of the GPGGA and GPRMC sentences. The trajectory-generation and stream-recording logic has been extracted from the script into two reusable cross-cutting services. The first one is a trajectory player, which is a generic circular and waypoint sequencer. The second is a stream recorder, which performs asynchronous comma-separated logging with size-based rotation and is decoupled from the transmission thread in order to avoid input and output contention. The navigation script delegates to both, and either service can be driven directly by another component without going through a script. This factoring is what allows a kinematic model of the carrier to be plugged in later without touching the scripting layer.
3.10.3. Session Persistence and Plugins
- The supervisor serializes the complete state of a configuration through an object output stream, recording the name, category, instrument, prefix, field values, port configuration, window positions, and transmission or listening states. A complex test environment can therefore be restored identically, shared across teams or resumed after an interruption. Finally, a plugin manager dynamically loads Java archive modules implementing a plugin interface, which enables functional extension by connectors or widgets without any modification of the core.
4. Results and Evaluation
- This section first illustrates the operation of the platform through representative screenshots, and then evaluates its ability to address the problem stated in Section 1.1 along the five axes derived from that statement.
4.1. Platform Walkthrough
- Figure 4 shows the main interface with one instrument instance, a radar source in emission mode, comprising the selection panel, the parameter fields, the transmission controls, the generated message and a time-stamped activity log. Several instances can run side-by-side in the same desktop pane, as shown in Figure 5, each with its own instrument, prefix and port configuration, which illustrates the capacity of the multi-document interface to instantiate, move and supervise many sensors simultaneously.
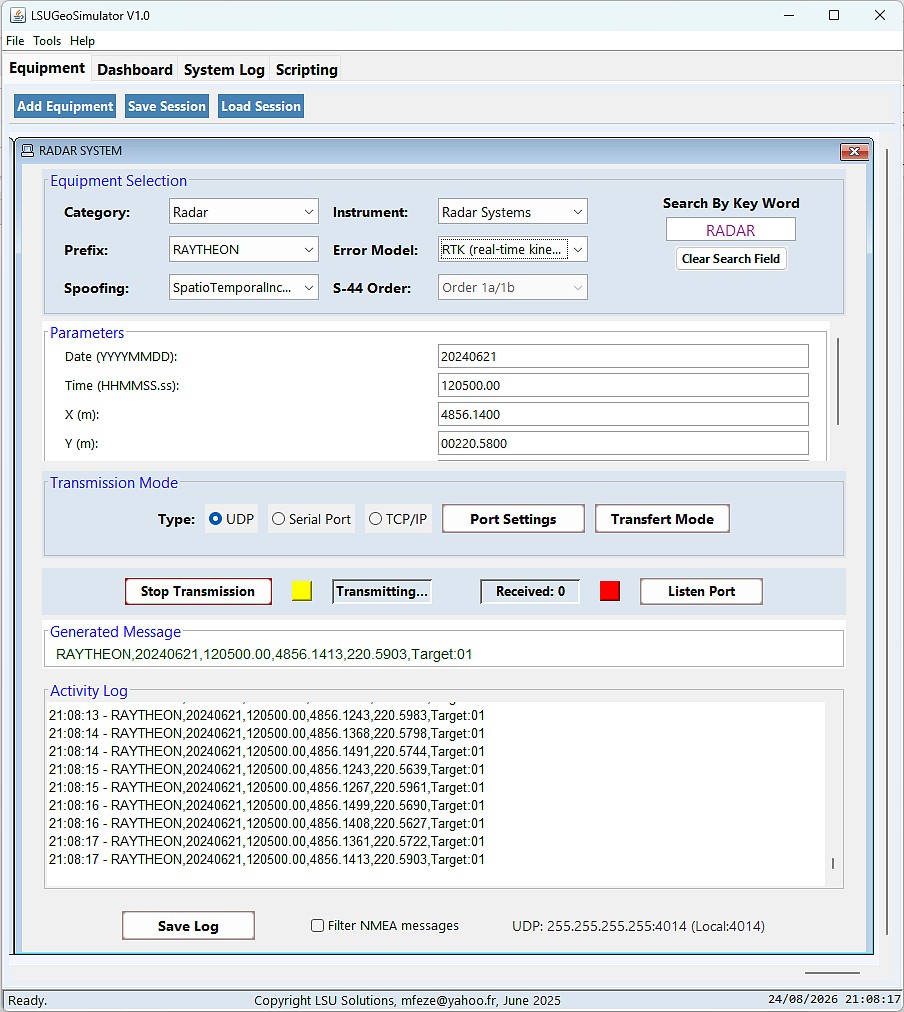 | Figure 4. Main interface of the supervisor with one equipment instance in emission mode |
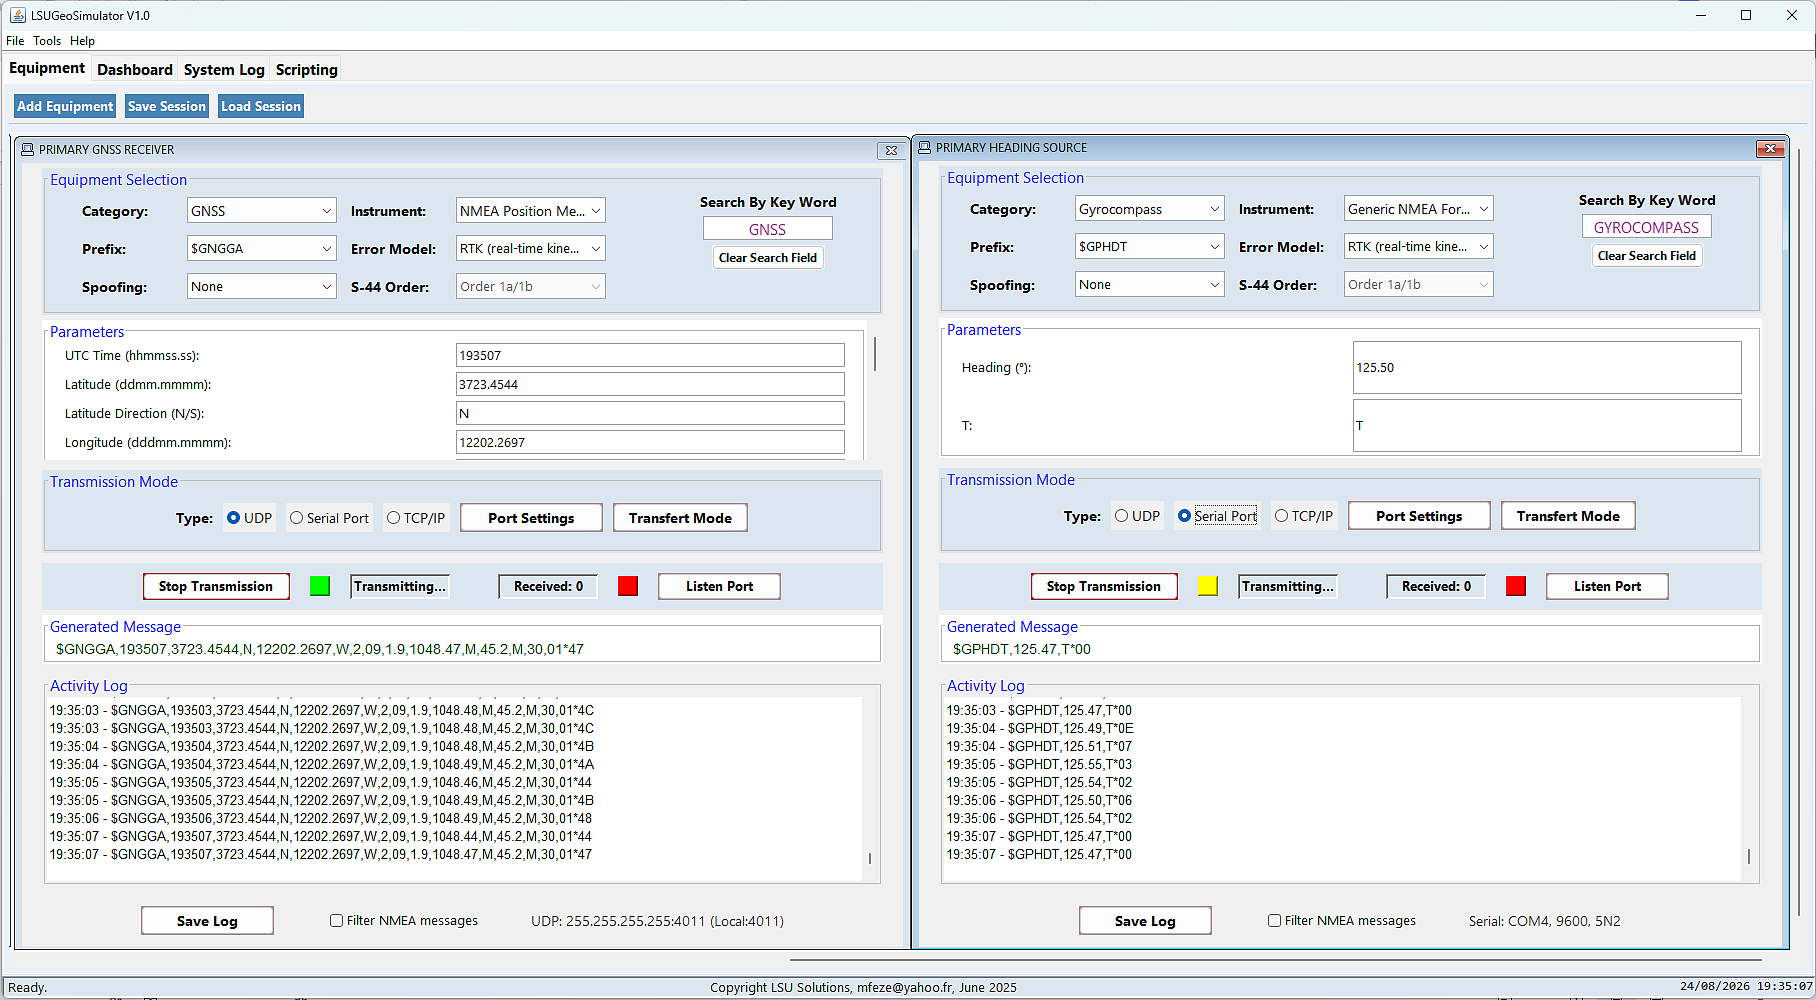 | Figure 5. Multi-document supervisor running several equipment instances concurrently, each with its own prefix, port, and transmission state |
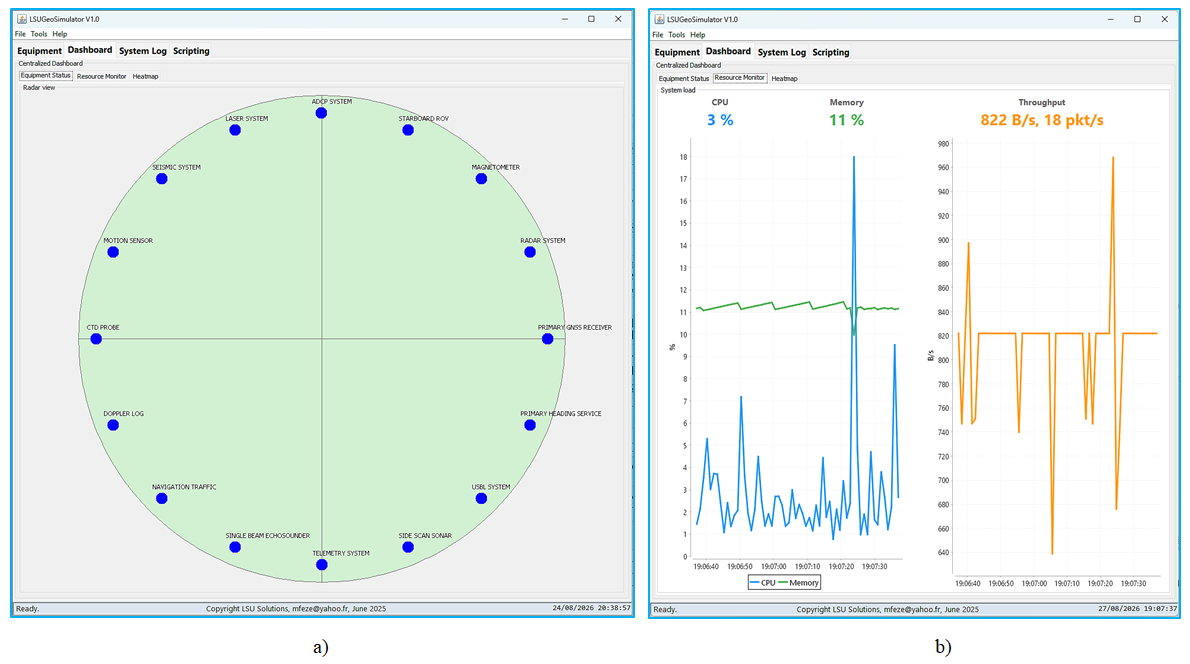 | Figure 6. Centralized dashboard. (a) Equipment radar view showing 16 configured instruments. (b) Real-time system monitor plotting processor, memory, and network time series |
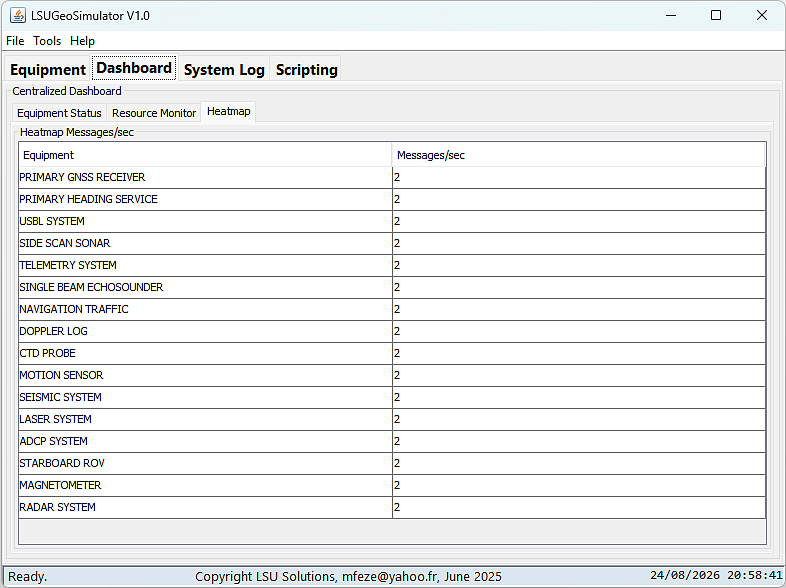 | Figure 7. Dashboard, heatmap tab: throughput per instrument in messages per second, fed by the same unified resource monitor as the global throughput readout |
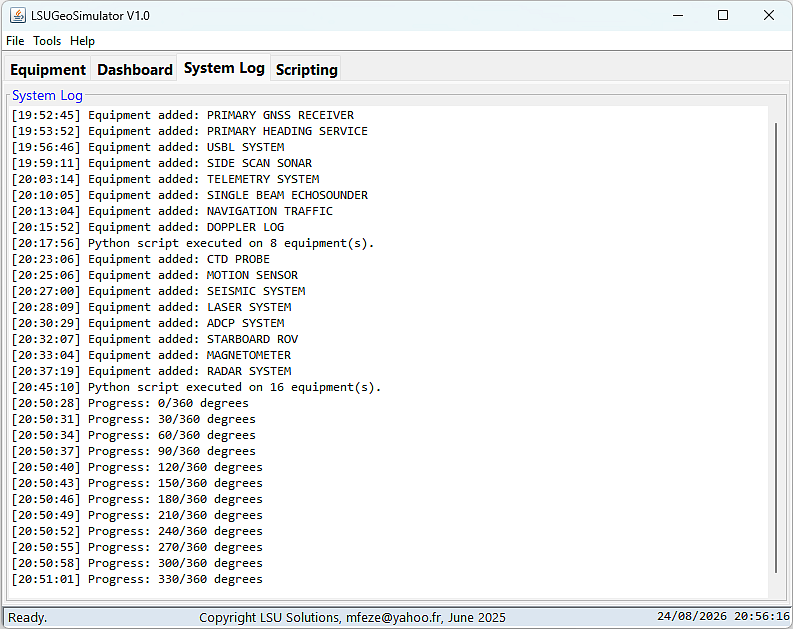 | Figure 8. System log tab: consolidated log of instrument creation, script executions and trajectory player progress, complementing the per-window activity log |
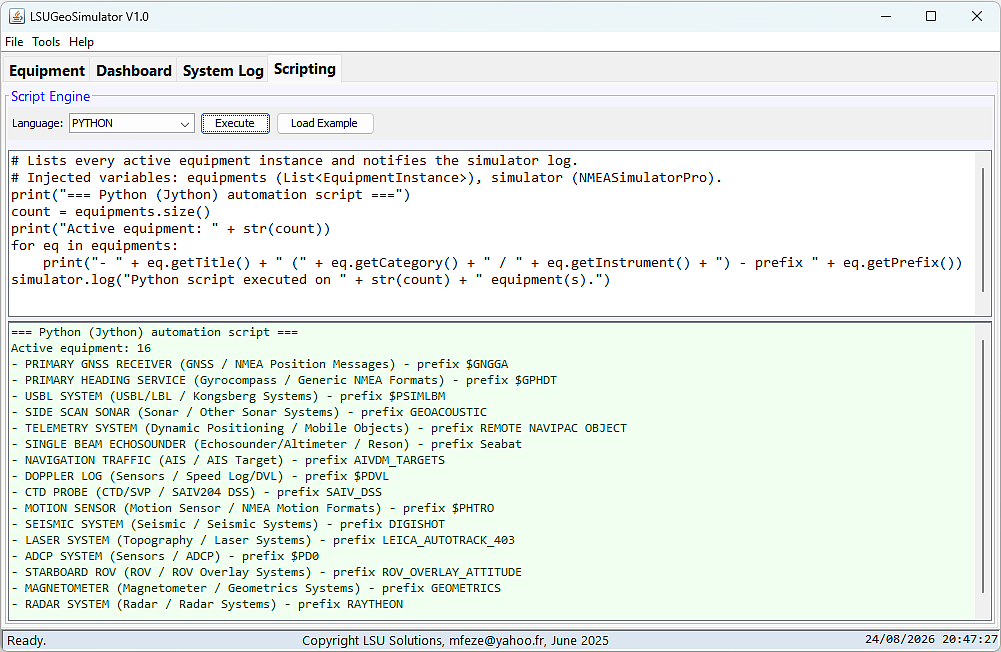 | Figure 9. Scripting tab, Python example: the script lists the active instruments, which confirms that variable injection operates correctly |
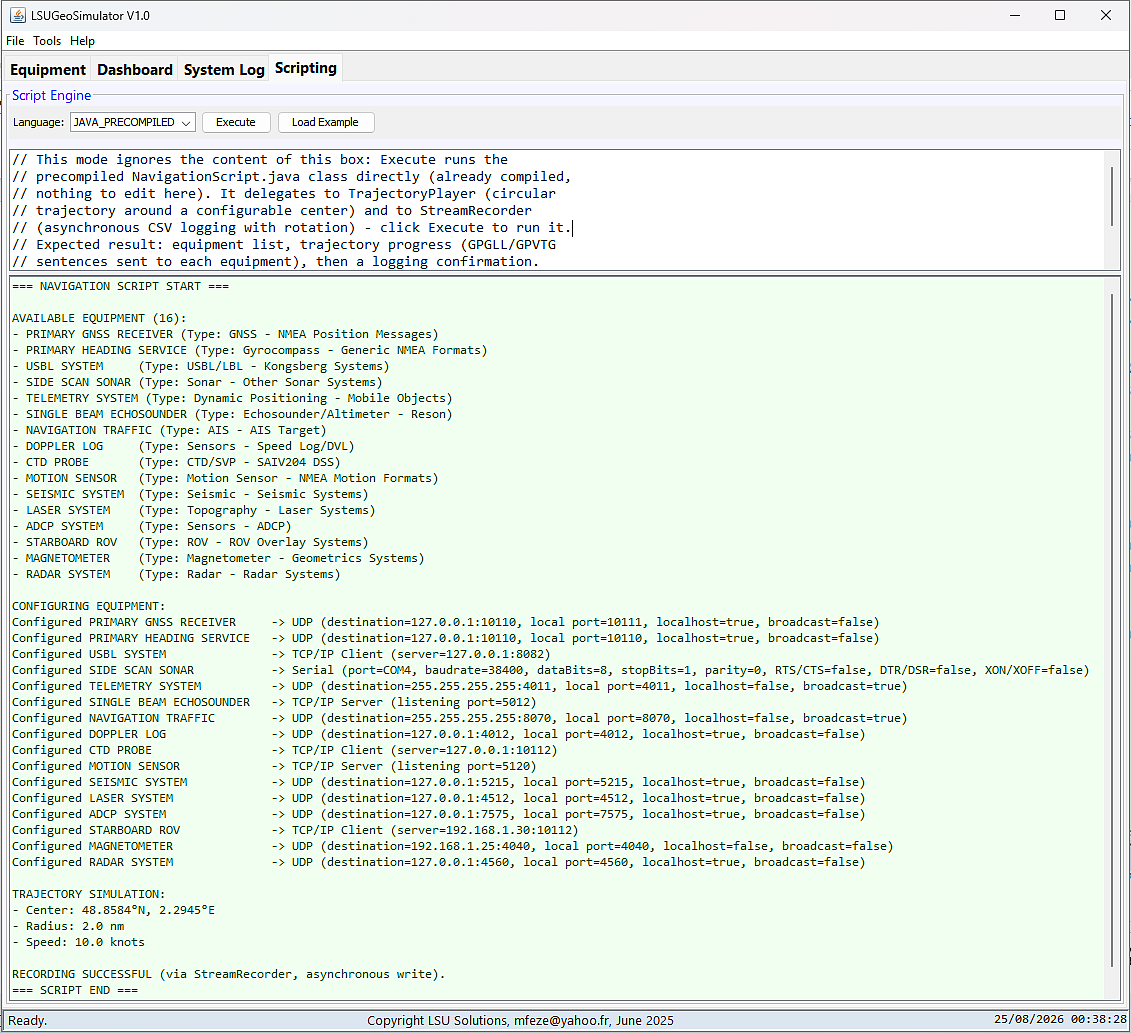 | Figure 10. Scripting tab, precompiled Java mode: execution of the bundled navigation script, which delegates the circular trajectory to the trajectory player and the asynchronous logging to the stream recorder |
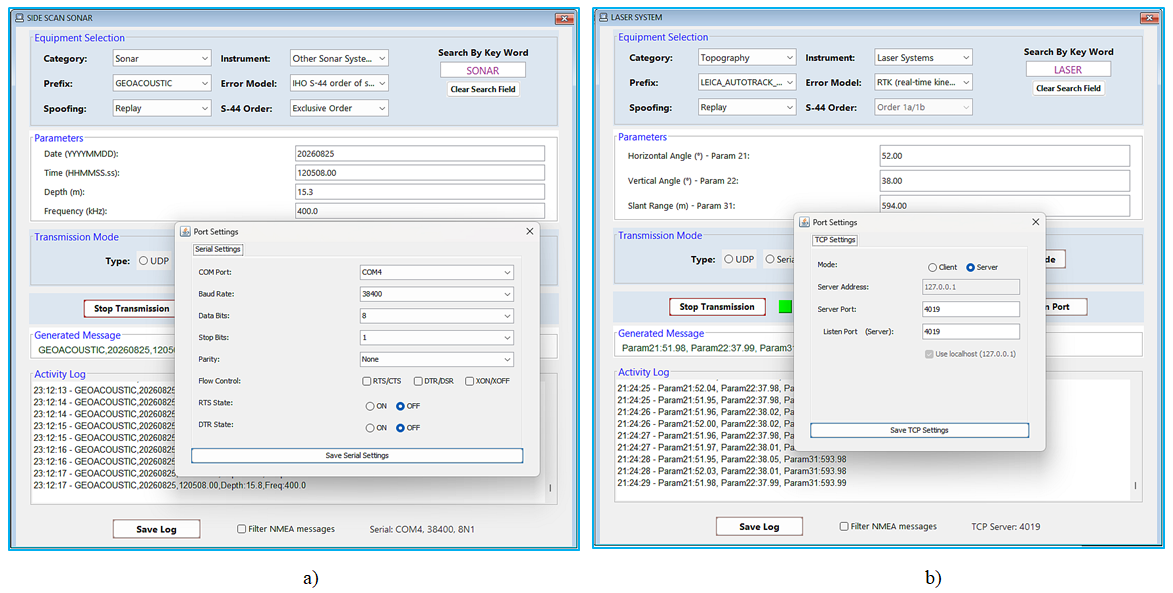 | Figure 11. Port configuration dialogs. (a) Serial settings: baud rate, data bits, parity and flow control. (b) TCP and UDP settings: mode, address and ports |
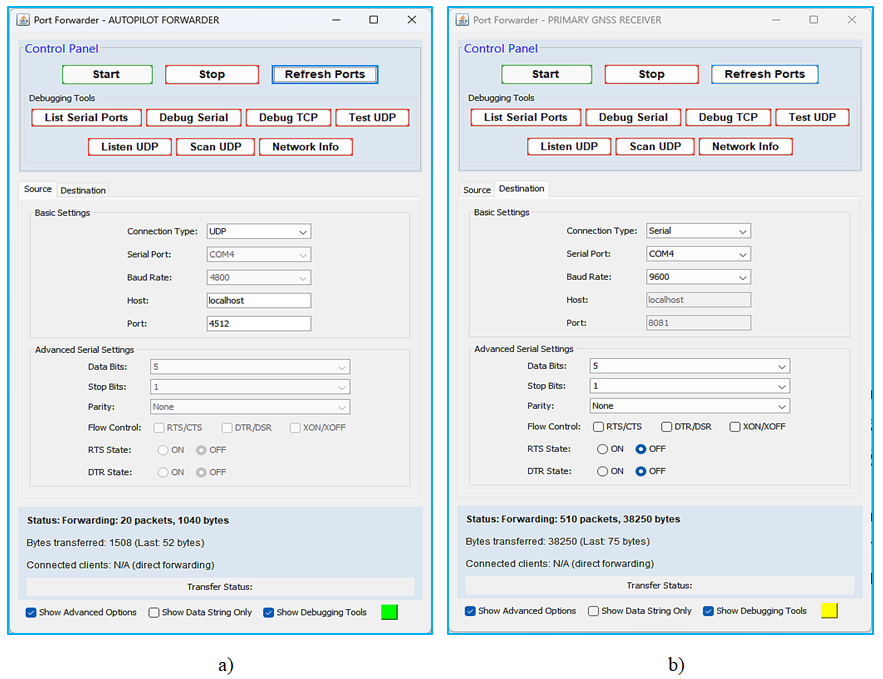 | Figure 12. Inter-protocol forwarder. (a) Configuration of the source and the destination, here from a UDP network port to a serial port. (b) Transfer control and status panel with the live connected-clients indicator |
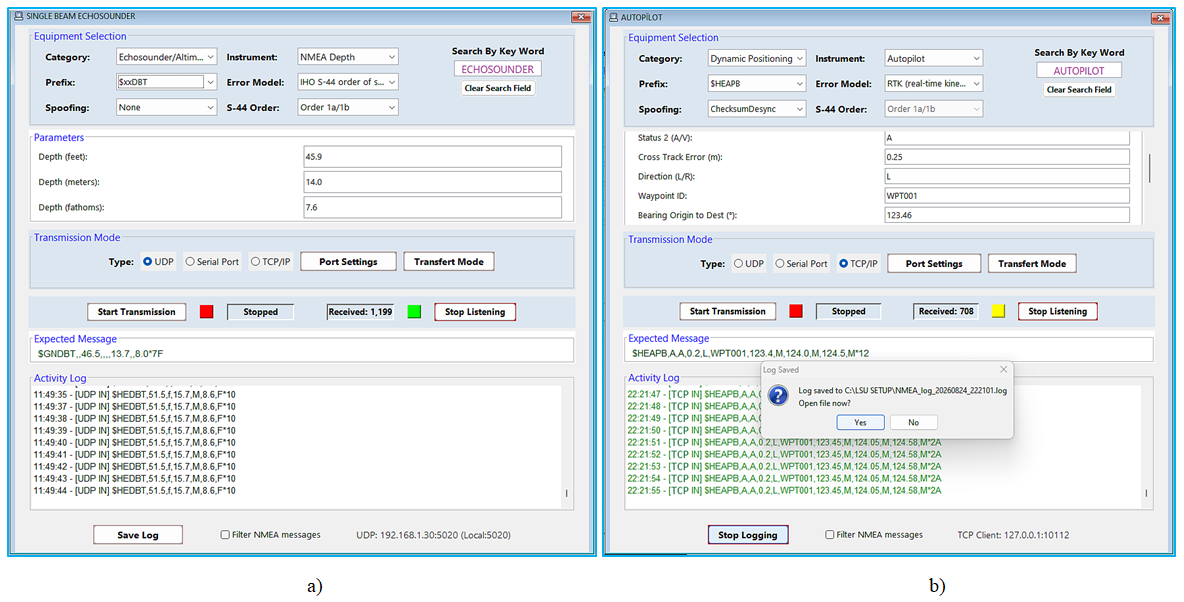 | Figure 13. Reception mode and equipment-output testing. (a) Listening and decoding of an echo sounder on UDP: the expected message format does not match the received one and the stream is displayed in black. (b) An autopilot stream received on TCP, decoded and logged to a time-stamped file: the expected format matches and the strings turn green |
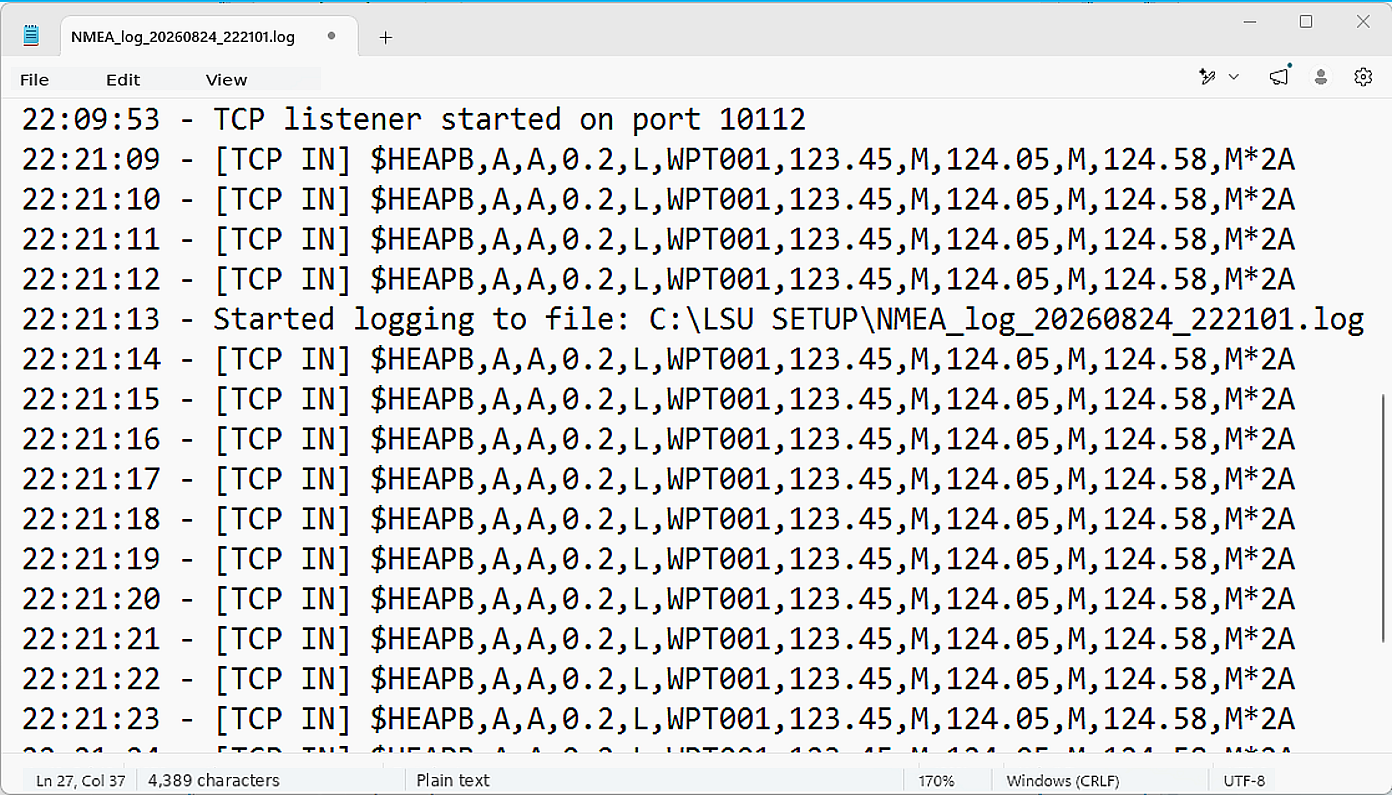 | Figure 14. Autopilot stream decoded reception log written to a time-stamped file and reopened in a text editor |
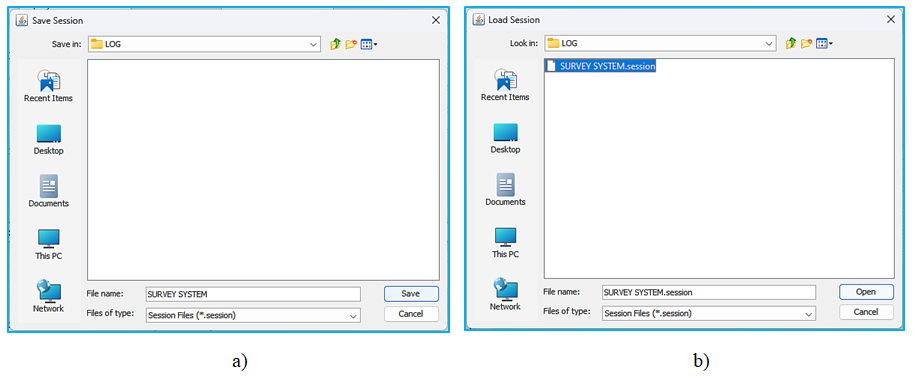 | Figure 15. Session persistence. (a) Saving a complete test bench. (b) Reloading a saved test bench |
4.2. Evaluation against the Design Objectives
- Exhaustiveness. The hierarchy covers the multi-vendor ecosystem of a hydrographic or geophysical survey spread, from fundamental sensors to proprietary hydrographic outputs, a coverage that has no equivalent among publicly available tools. The system is also graceful: a single-beam echo sounder that is not explicitly listed can still be simulated through the echo sounder category and a generic depth prefix, so an unknown instrument does not block a test.Realism. The contextual error model produces streams whose dispersion matches the uncertainty budgets declared by the selected model, in contrast with the ideal sentences of generic simulators. The checksum and the Coordinated Universal Time (UTC) timestamp guarantee the syntactic and temporal validity of the sentences, so that a receiving application accepts them exactly as it would accept the output of a real device.Bidirectionality. The same instance and the same connection serve both emission and the reception-based testing of a real instrument's output port, validated on serial, UDP and TCP links. The received stream is decoded, displayed, counted, and logged, and is automatically checked against the expected sentence at the format level with a live colour indication in the activity log.Concurrency and supervision. The multi-document architecture allows many instruments to run simultaneously, and the resource monitor and the heatmap provide an objective measurement of throughput and load as well as the detection of port conflicts. A representative scenario instantiates a TCP server on a listening port together with a concurrent UDP stream directed at the same local destination, which stresses the robustness of the third-party acquisition software under test.Reproducibility. Session persistence and scripting turn an ad hoc test case into a reproducible and shareable procedure, which is a necessary condition for integration into verification and validation processes and, in due course, into continuous-integration pipelines.Taken together, these five results show that the six criteria of the problem statement are satisfied simultaneously, which is precisely what Table 1 shows no existing family of tools achieves.
4.3. Quantitative Benchmark Evaluation
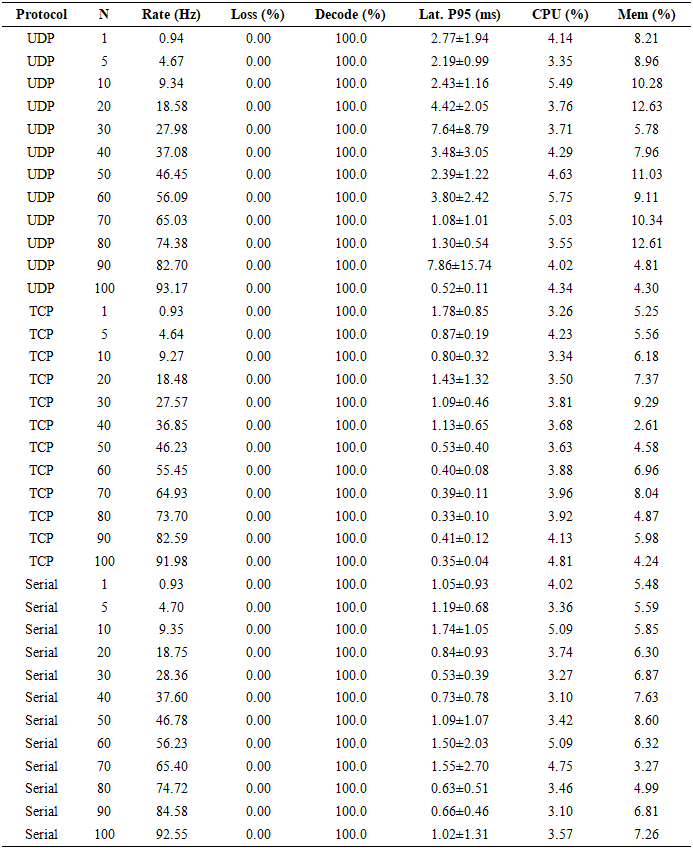
- To complement the walkthrough above with reproducible, measured evidence, a dedicated harness exercised the unmodified production classes (TCPConnection, UDPConnection, VirtualTCPServer, SerialConnection ConnectionConfig, ResourceMonitor, SpoofingStrategy) through their real public application programming interfaces. Each configuration was repeated five times (mean ± standard deviation). Measurements were collected on a Windows 10 laptop (ARM64, Qualcomm 8-core processor, 15.6 GB RAM, Java HotSpot 64-bit VM 1.8.0), reported here for reproducibility since absolute throughput and latency figures are host-dependent. Table 5 reports the generation rate, frame loss, decoding accuracy, 95th-percentile latency and CPU/memory utilization as the number of simultaneous instruments N grows from 1 to 100 in steps of 10 (plus N=1 and N=5), at the default rate (one sentence per second per instrument). Loss remained 0% and decoding accuracy 100% for all three protocols at every N tested, with CPU load confined to a narrow 3.1-5.8% band regardless of N or protocol (Figure 16). This is an evidence that the concurrency model implemented scales, on this host, up to 100 simultaneous instruments without measurable degradation. The highest generation rate observed was 93.17 Hz, reached by UDP at N=100. The 95th-percentile latency (Figure 16b) fluctuates between 0.5 ms and 7.9 ms across repetitions without a systematic trend with N, consistent with scheduling and garbage-collection jitter on a shared host.
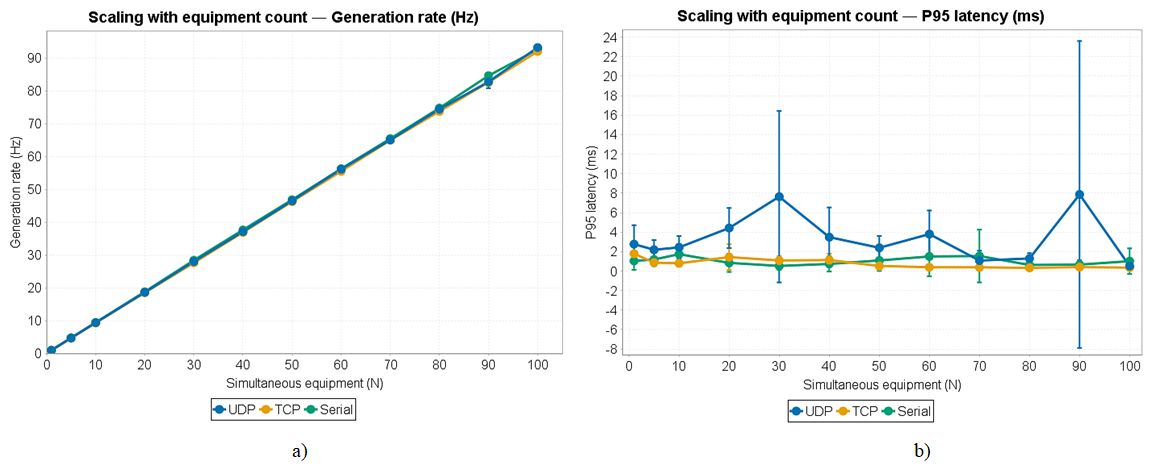 | Figure 16. (a) Aggregate sentence generation rate and (b) 95th-percentile end-to-end latency versus the number of simultaneous instruments (N=1 to 100), for UDP, TCP and Serial. Error bars are one standard deviation over 5 runs |
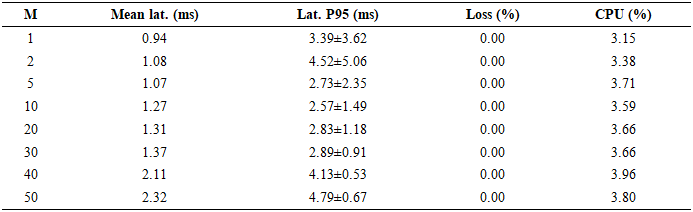
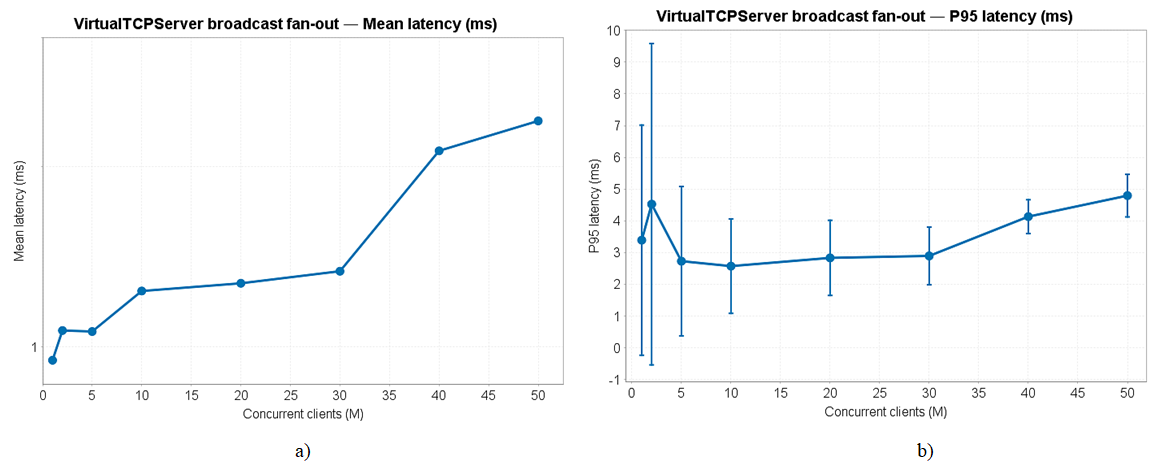 | Figure 17. (a) Mean and (b) 95th-percentile broadcast fan-out latency versus the number of concurrently connected clients (M=1 to 50). Error bars are one standard deviation over 5 runs |
|
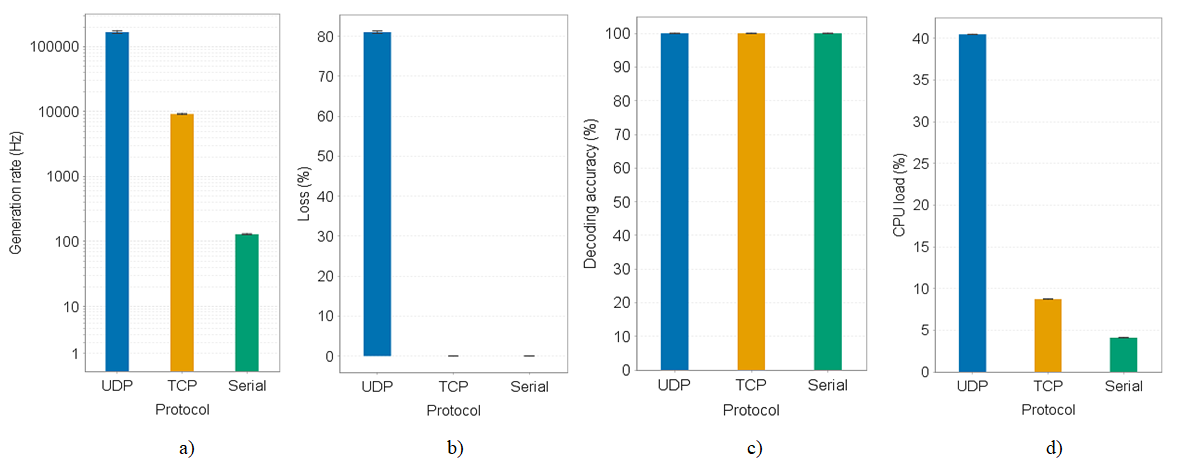 | Figure 18. (a) Generation rate, (b) loss, (c) decoding accuracy and (d) CPU load under unthrottled back-to-back emission, per protocol. The near-zero, oddly scaled axis in (b) for TCP and Serial reflects their exactly 0% measured loss rather than a plotting error |
|

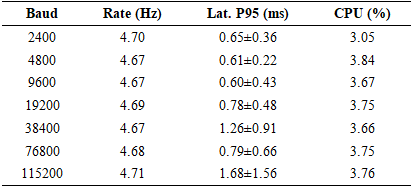
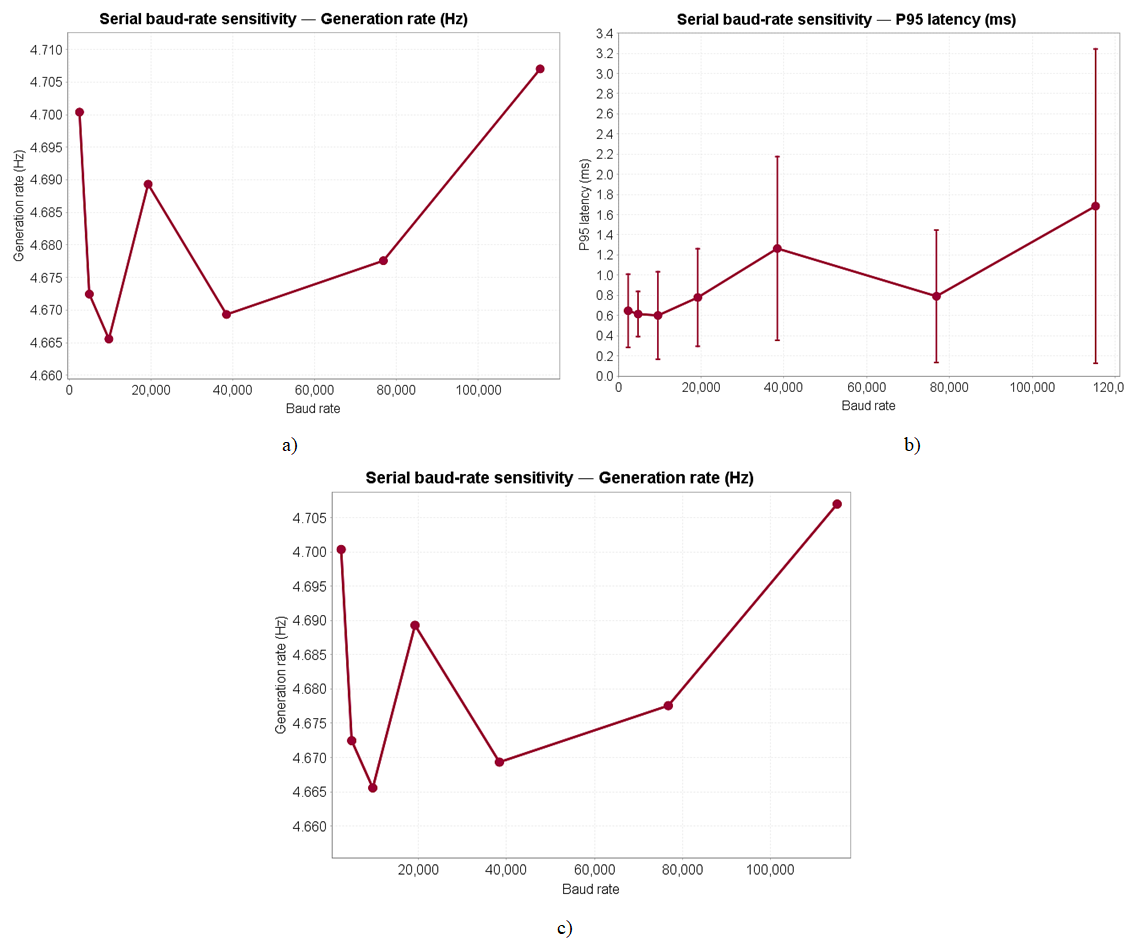 | Figure 19. (a) Generation rate, (b) 95th-percentile latency and (c) CPU load as a function of the configured Serial baud rate, at the default emission delay. Error bars are one standard deviation over 5 runs |
|
|
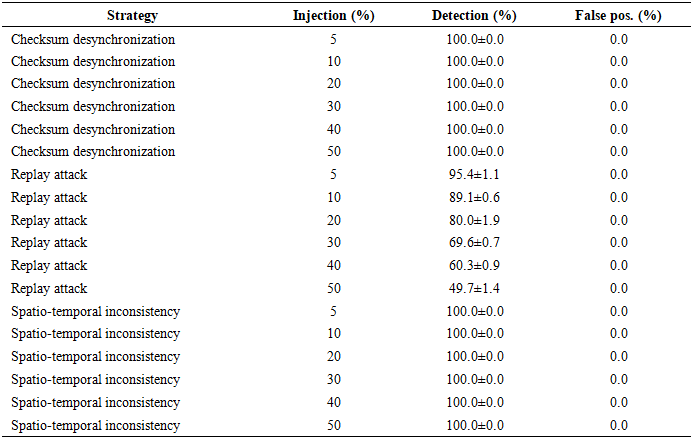
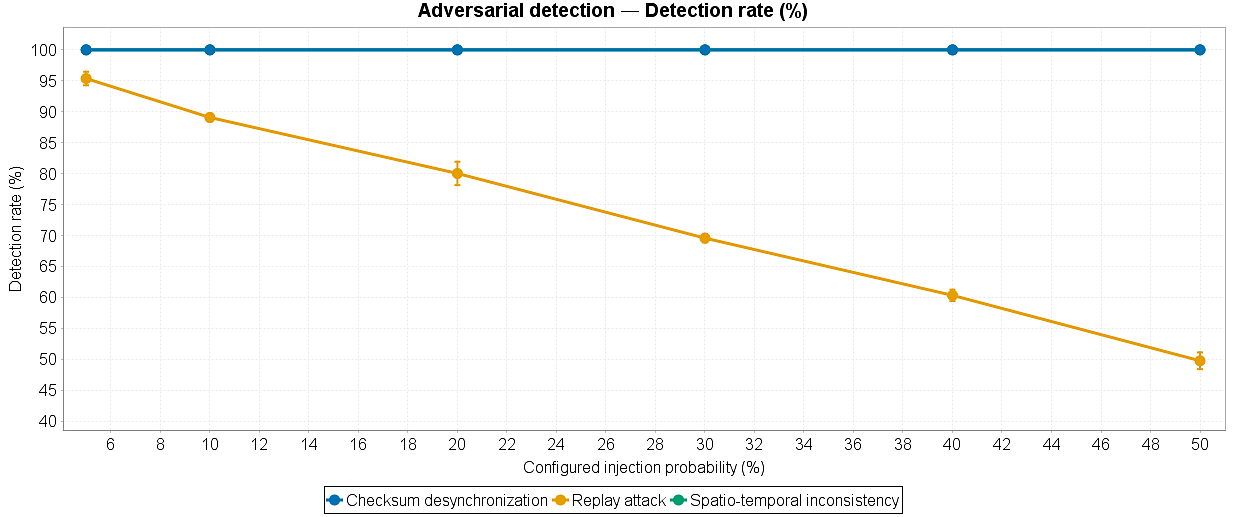 | Figure 20. Measured adversarial detection rate versus the configured injection probability (5% to 50%), for the three SpoofingStrategy implementations (mean ± SD, 5 runs of 5000 sentences) |
|
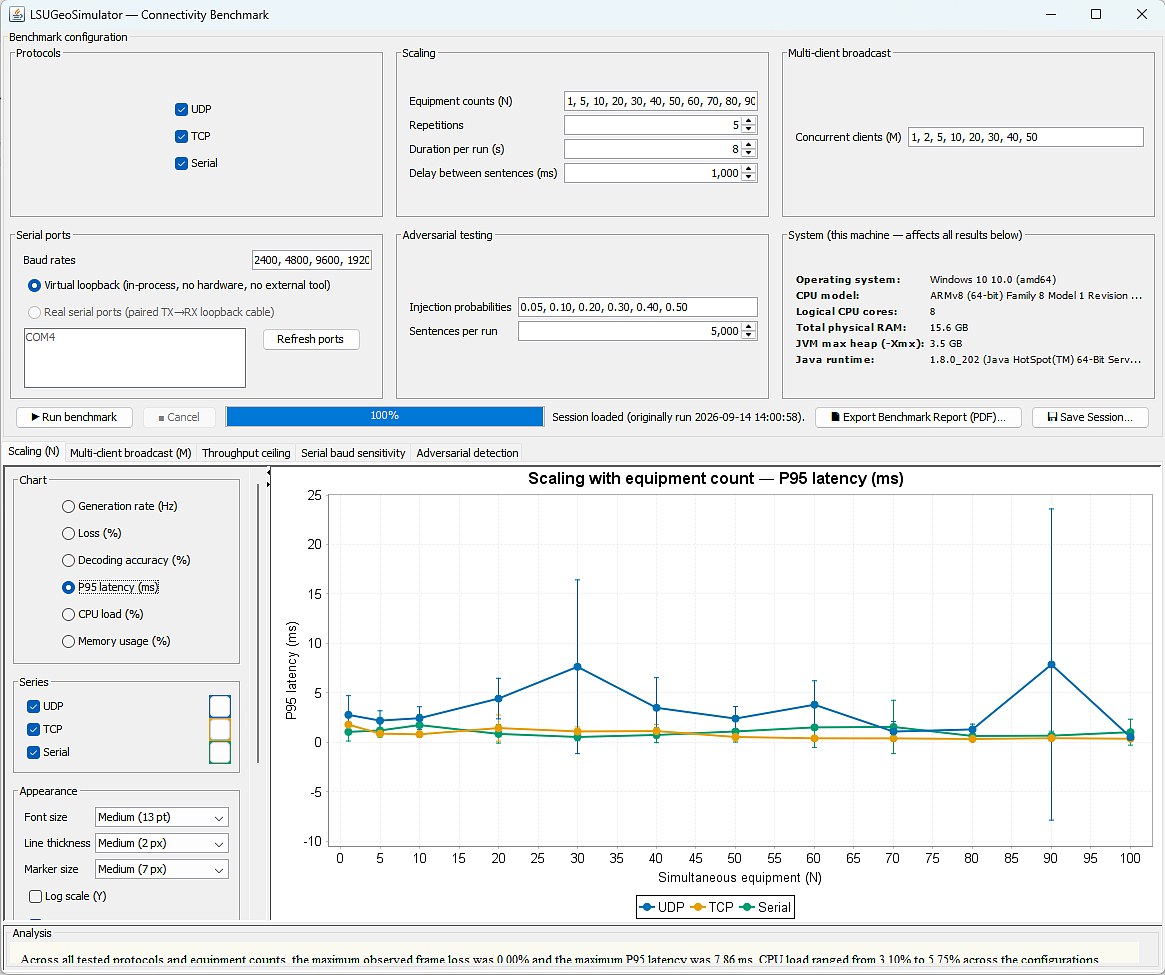 | Figure 21. The Connectivity Benchmark window, showing the fully customizable charting sidebar (font size, line thickness, marker size, per-series colour, log scale) applied to the multi-client broadcast CPU load results of Figure 17 |
4.4. Representative Fault-Detection Case Study
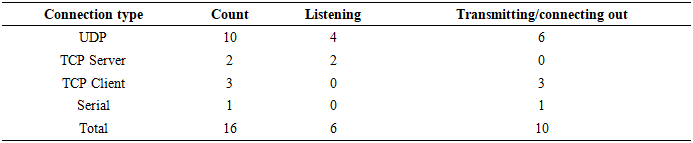
- To ground the adversarial-detection results of Section 4.3 in a concrete acquisition chain rather than an abstract sentence stream, consider the PRIMARY GNSS RECEIVER instance of the representative deployment in Table 10 (UDP, destination 127.0.0.1:10110), configured to emit $GPGGA position fixes at the platform’s default rate. Enabling SpoofingStrategy. ReplayAttack (Section 3.7) on this instance with a 10% injection probability, the exact configuration used to produce the corresponding row of Table 9, causes approximately one in ten emitted position fixes to be silently replaced by a verbatim copy of an earlier fix from the same instrument’s short rolling history, exactly as an attacker rebroadcasting a captured GNSS signal would.Over a 5000-sentence run, this deliberately injects approximately 500 replayed fixes. Feeding the resulting stream through the sequence-continuity detector used throughout Section 4.3, which flags a sentence whenever its declared sequence number has already been observed, correctly identified 89.1±0.6% of them (Table 9), preventing the corresponding stale position fixes from silently reaching a downstream navigation display. The remaining fixes that evaded detection did so for a documented, mechanistic reason: ReplayAttack’s history buffer retains the content it originally generated rather than the content actually placed on the wire, so a fix replayed while an earlier replay of the same fix is still within the detector’s observation window can carry a sequence number the detector has already cleared.This complete chain, instrument configuration, deliberate fault injection, automated detection, and a quantified pass/fail outcome, is exactly the acceptance-style workflow that Section 3.9’s reception mode exposes at the user-interface level for testing a real instrument’s own output port; the case above substitutes a simulated source for concreteness and reproducibility, but the connection abstraction, the perturbation layer and the detection logic are the same production code exercised, throughout this paper. While a rigorous cost/time comparison against a conventional sea trial is beyond the scope of this benchmark and is left for future work, the case above required no vessel time, no physical GNSS receiver, and no weather window. The complete fault-injection-to-detection cycle ran in well under a minute on a laptop-class host (system characteristics reported at the start of Section 4.3). This is a qualitative indication of the workflow-level time savings the platform is intended to provide for routine acquisition-chain verification.
5. Discussion
5.1. Interpretation of the Findings
- The most instructive result of this work is not the number of formats supported but the effect of unifying emission and reception behind a single connection abstraction. Because an instance declares its expected format before it is used, the reception mode inherits, at no additional cost, a reference against which incoming traffic can be judged. Conformance checking, which in a purely receiving tool would require the operator to supply a specification, here emerges as a byproduct of the emission model. This is the architectural reason why the pass-or-fail indication of Section 3.9 could be implemented without adding a specification language to the platform, and it explains why the bidirectional design is more than the juxtaposition of two tools.A second finding concerns instrumentation. The unification of traffic metrics described in Section 3.4 acts as a reminder of practical significance for anyone building a comparable supervisor, that a monitoring subsystem must be validated against the paths that actually carry the load and not only against the path that was instrumented first. Once both paths feed the same counters, the heatmap and the global readout become consistent under every mode of use, which is the condition for using them as an objective measurement rather than as a decorative indicator.A third finding concerns the error model. Making the noise bounds a selectable property rather than a hard-coded constant changes the nature of the generated data. A stream is no longer merely noisy; it is noisy in a way that can be named, declared, and audited. An engineer can state that a given acquisition chain was tested against streams whose dispersion corresponds to Order 1a of the S-44 standard, and that statement is verifiable because the bounds are derived from the published formulation of the standard rather than chosen arbitrarily. This traceability is what allows the platform to be used inside a formal verification and validation process rather than only during exploratory debugging.
5.2. Novelty with Respect to the State of the Art
- Relative to the four families reviewed in Section 2.2, the contribution of the platform can be located precisely. Generic NMEA simulators offer emission of a few ideal formats; the platform extends this to several hundred formats and adds bounded contextual noise and network transports. Vendor suites offer realism within a closed ecosystem; the platform offers comparable realism across vendors and exposes the error model instead of hiding it. Ad hoc scripts offer flexibility for developers; the platform retains that flexibility through its scripting engine while making the common cases accessible to an operator through a graphical interface. Marine robotics simulators such as HoloOcean [9] model the physics of the environment and the perception of a vehicle; the platform models the linguistic and electrical interface of the instruments, which is the layer those simulators assume to exist.The bidirectional principle has, to the authors' knowledge, no equivalent in the reviewed literature. Test benches described in the hardware-in-the-loop studies of Section 2.3 verify the behaviour of a control algorithm fed by simulated data, whereas the reception mode described here verifies the behaviour of a physical device on its own output port. These two verifications are complementary and, in an integration campaign, sequential: the output port must be proven correct before the algorithm consuming it can be meaningfully tested. Providing both in one tool, with one connection abstraction and one interface, shortens that sequence considerably.Table 11 substantiates this positioning against four named, currently available alternatives rather than tool categories alone: a commercial acquisition suite (QPS Qinsy [37]), a commercial NMEA-0183 stress-test generator (NMEAWiz [38]), an open-source single-vessel generator (NMEASimulator [39]), and the bespoke research hardware-in-the-loop testbeds of Section 2.3 [3]-[6]. None combines multi-protocol transport, catalogue breadth, a standard-traceable error model, adversarial testing and scripting in one platform, reinforcing the gap identified in Section 2.7.
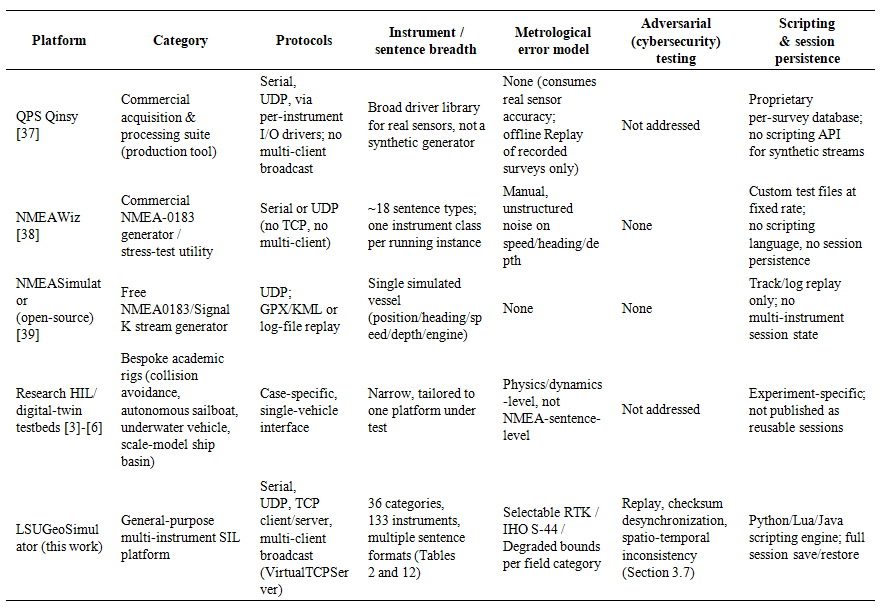 | Table 11. Positioning of LSUGeoSimulator with Respect to Existing Hydrographic/Navigation Acquisition, NMEA-Generation, and Hardware-in-the-Loop/Software-in-the-Loop Testing Solutions |
5.3. Contribution to Maritime Cybersecurity
- Because it fully controls the content of the emitted sentences and can also receive and decode external streams, the platform constitutes both a dataset generator and a monitoring point for security work. As NMEA 0183 carries no authentication, the injection of falsified sentences and the spoofing of GNSS and AIS signals remain established threats to shipborne systems [7], [21], [22]. By producing nominal and corrupted scenarios reproducibly, and by listening to and decoding the actual stream of a device, the tool allows anomaly detectors based on sentence-integrity monitoring to be trained and evaluated [23], complementing the hardware-in-the-loop benches of the literature [3].The spoofing layer of Section 3.7 makes this contribution concrete and gives the cybersecurity tester a first-class anchor at the level of the user interface. Its three modes were chosen to span three distinct detection problems. Replay defeats detectors that examine a single sentence in isolation, because every replayed sentence is individually valid. Checksum desynchronization is trivially detectable by a conforming parser and therefore serves as a control condition and as a test of the parser itself. Spatio-temporal inconsistency targets plausibility checks that cross-compare position, speed and heading, which is the class of detector most likely to be deployed in practice. Generating the three independently, and combining them freely with a declared metrological error model, allows a detector to be characterized on a grid of conditions rather than on a single corrupted capture.
5.4. Limitations
- Several limitations remain and should be stated explicitly. The Swing interface, although functional and familiar to operators, would benefit from modernization. Support for proprietary binary formats is essentially symbolic, being limited to a hexadecimal representation for both emission and reception, and calls for genuine encoding and decoding. More fundamentally, the simulator generates sentences independently of one another: it does not yet model the coherent dynamics of a carrier feeding all sensors synchronously, so a heading emitted by the gyrocompass instance and a course emitted by the GNSS instance are not constrained to agree. Conformance checking in reception is automated at the format level, that is, on the prefix and the field count, but not yet at the field level, so a sentence with the correct structure but a corrupted individual value, an out-of-range checksum or an implausible coordinate is still interpreted as valid; per-field validation against physical bounds is the natural next step. Finally, dynamic Java compilation, although it is one of the more original features of the platform, raises performance and security questions that must be controlled before use in a production environment.Similarly, the spatio-temporal inconsistency perturbation currently appends an explicit marker rather than rewriting the affected coordinates, so the detection rate reported in Section 4.3 characterizes marker-based detection rather than a genuine position-plausibility check. Implementing the latter, together with a content-based replay detector, is a direct extension of the adversarial layer.
6. Conclusions
- The objective of this paper was to design, implement and evaluate a bidirectional software-in-the-loop platform able to emulate the output of marine survey and navigation instruments and, in the same environment, to test the output port of a real instrument. That objective has been met. LSUGeoSimulator organizes 36 categories, 133 instruments and several hundred sentence formats in a three-level hierarchy; it routes all traffic through a single connection abstraction shared by emission and reception over serial, TCP and UDP links; it injects bounded contextual noise whose bounds are traceable either to a real-time kinematic solution, to a declared order of survey of the IHO S-44 standard, or to a degraded scenario; and it adds an independent adversarial layer producing replay, checksum-desynchronization and spatio-temporal-inconsistency streams.The evaluation conducted along the five axes of exhaustiveness, realism, bidirectionality, concurrency and reproducibility confirms the results announced in the abstract. Generated sentences are syntactically valid and temporally consistent, and their dispersion remains within the declared uncertainty budget. Received streams are decoded, counted, logged and automatically compared with the expected sentence at the format level, which yields a live pass-or-fail indication and removes the need for a manual character-by-character comparison. Dozens of instances run concurrently under a bounded thread pool, with throughput and load measured consistently from a single unified source. Session persistence and the scripting engine make a test case reproducible and shareable. By transferring integration risk from the sea to the laboratory, the platform reduces the cost and the lead time of offshore commissioning while improving the reproducibility of the tests.Future work follows directly from the limitations identified in Section 5.4. The first perspective is field-level conformance checking against physical value bounds, extending the format-level check already in place. The second is coupling to a kinematic model of the vessel or of the remotely operated vehicle, so that all sensor streams become mutually consistent, which is the decisive step towards a genuine digital twin [13], [14]. Further perspectives include extended support for binary formats in both directions, a representational state transfer interface and a headless mode for continuous integration, externalization of the equipment hierarchy in an interchange format, a graphical editor for temporal scenarios, and exploitation of the platform as a dataset generator both for cybersecurity research and for the training of autonomous-perception systems [2], [23]. An open-source release could ultimately turn the platform into a reference community resource for the sector.
Appendix. Exhaustive Equipment Catalogue
- The following table lists the complete content of the equipment hierarchy used by the platform, that is, 36 categories and 133 instruments, together with the prefixes and formats attached to each instrument, its typical key fields, and its operational role. It is provided so that the coverage claimed in Section 3.1 and evaluated in Section 4.2 can be verified independently.
 | Table 12. Detailed Catalogue of the Equipment Hierarchy: 36 Categories and 133 Instruments |
References
| [1] | J. Wang, Y. Xiao, T. Li, and C. L. P. Chen, "A survey of technologies for unmanned merchant ships," IEEE Access, vol. 8, pp. 224461-224486, 2020. https://doi.org/10.1109/ACCESS.2020.3044040. |
| [2] | S. Thombre, Z. Zhao, H. Ramm-Schmidt, J. M. Vallet Garcia, T. Malkamäki, S. Nikolskiy, T. Hammarberg, H. Nuortie, M. Z. H. Bhuiyan, S. Särkkä, and V. V. Lehtola, "Sensors and AI techniques for situational awareness in autonomous ships: A review," IEEE Transactions on Intelligent Transportation Systems, vol. 23, no. 1, pp. 64-83, 2022. https://doi.org/10.1109/TITS.2020.3023957. |
| [3] | R. Tornese, E. Polimeno, C. Pascarelli, S. Buccoliero, L. Carlino, E. Sansebastiano, and L. Sebastiani, "Hardware-in-the-loop testing of a maritime autonomous collision avoidance system," in Proceedings of the 30th Mediterranean Conference on Control and Automation (MED), 2022, pp. 514-519. https://doi.org/10.1109/MED54222.2022.9837250. |
| [4] | T. Akiyama, K. Roncin, and J.-F. Bousquet, "A hardware-in-the-loop simulator to optimize autonomous sailboat performance in real ocean conditions," Journal of Marine Science and Engineering, vol. 11, no. 6, art. 1104, 2023. https://doi.org/10.3390/jmse11061104. |
| [5] | E. Potokar, S. Ashford, M. Kaess, and J. G. Mangelson, "HoloOcean: An underwater robotics simulator," in Proceedings of the IEEE International Conference on Robotics and Automation (ICRA), Philadelphia, PA, USA, 2022, pp. 3040-3046. https://doi.org/10.1109/ICRA46639.2022.9812353. |
| [6] | Y. Wang, H. Ren, X. Yang, and D. Wang, "A physics-based simulation of fluid-solid coupling scenarios in an ocean visual system," Journal of Marine Science and Engineering, vol. 13, no. 1, art. 123, 2025. https://doi.org/10.3390/jmse13010123. |
| [7] | National Marine Electronics Association, NMEA 0183 - Standard for Interfacing Marine Electronic Devices, Version 4.30. Severna Park, MD, USA: NMEA, 2023. https://www.nmea.org/nmea-0183.html. |
| [8] | International Hydrographic Organization, S-44 - Standards for Hydrographic Surveys, 6th ed. Monaco: IHO, 2020. https://iho.int/uploads/user/pubs/standards/s-44/S-44_Edition_6.1.0.pdf. |
| [9] | E. Potokar, K. Lay, K. Norman, D. Benham, S. Ashford, R. Peirce, T. B. Neilsen, M. Kaess, and J. G. Mangelson, "HoloOcean: A full-featured marine robotics simulator for perception and autonomy," IEEE Journal of Oceanic Engineering, vol. 49, no. 4, pp. 1322-1336, 2024. https://doi.org/10.1109/JOE.2024.3410290. |
| [10] | R. Sawada, K. Sato, and M. Minami, "Framework of safety evaluation and scenarios for automatic collision avoidance algorithm," Ocean Engineering, vol. 300, art. 117506, 2024. https://doi.org/10.1016/j.oceaneng.2024.117506. |
| [11] | F. Zhu, Y. Niu, M. Wei, Y. Du, and P. Zhai, "A high-risk test scenario adaptive generation algorithm for ship autonomous collision avoidance decision-making based on reinforcement learning," Ocean Engineering, vol. 320, art. 120344, 2025. https://doi.org/10.1016/j.oceaneng.2025.120344. |
| [12] | H. Zhou, M. Zheng, X. Chu, C. Yu, J. Lei, B. Lin, K. Zhang, and W. Hua, "Virtual reality fusion testing-based autonomous collision avoidance of ships in open water: Methods and practices," Journal of Marine Science and Engineering, vol. 12, no. 12, art. 2181, 2024. https://doi.org/10.3390/jmse12122181. |
| [13] | A. Rasheed, O. San, and T. Kvamsdal, "Digital twin: Values, challenges and enablers from a modeling perspective," IEEE Access, vol. 8, pp. 21980-22012, 2020. https://doi.org/10.1109/ACCESS.2020.2970143. |
| [14] | N. S. Madusanka, Y. Fan, S. Yang, and X. Xiang, "Digital twin in the maritime domain: A review and emerging trends," Journal of Marine Science and Engineering, vol. 11, no. 5, art. 1021, 2023. https://doi.org/10.3390/jmse11051021. |
| [15] | B. Li, M. Li, Z. Qi, J. Li, J. Wu, and Q. Wang, "Exploring innovative methods in maritime simulation: A ship path planning system utilizing virtual reality and numerical simulation," Journal of Marine Science and Engineering, vol. 12, no. 9, art. 1587, 2024. https://doi.org/10.3390/jmse12091587. |
| [16] | D. Nguyen and R. Fablet, "A transformer network with sparse augmented data representation and cross entropy loss for AIS-based vessel trajectory prediction," IEEE Access, vol. 12, pp. 21596-21609, 2024. https://doi.org/10.1109/ACCESS.2024.3349957. |
| [17] | C. Alexandris, P. Papageorgas, and D. Piromalis, "Positioning systems for unmanned underwater vehicles: A comprehensive review," Applied Sciences, vol. 14, no. 21, art. 9671, 2024. https://doi.org/10.3390/app14219671. |
| [18] | S. Zhang, Y. Yang, T. Xu, X. Qin, and Y. Liu, "Long-range LBL underwater acoustic navigation considering Earth curvature and Doppler effect," Measurement, vol. 240, art. 115524, 2025. https://doi.org/10.1016/j.measurement.2024.115524. |
| [19] | Y. Zhu and L. Zhou, "Hybrid tightly-coupled SINS/LBL for underwater navigation system," IEEE Access, vol. 12, pp. 31279-31286, 2024. https://doi.org/10.1109/ACCESS.2021.3051398. |
| [20] | P. Wu, W. Nie, Y. Liu, and T. Xu, "Improving the underwater navigation performance of an IMU with acoustic long baseline calibration," Satellite Navigation, vol. 5, art. 7, 2024. https://doi.org/10.1186/s43020-023-00126-1. |
| [21] | E. Duzenli, E. Akyuz, G. Kayisoglu, and P. Bolat, "An integrated risk-based modelling approach for prediction of AIS spoofing attacks on-board ship," Ocean Engineering, vol. 342, art. 122895, 2025. https://doi.org/10.1016/j.oceaneng.2025.122895. |
| [22] | G. Kayisoglu, E. Duzenli, P. Bolat, and A. Bondarenko, "Exploring cyber security threats and security models in cross-border paperless maritime trade system," Computers & Security, vol. 157, 2025. https://doi.org/10.1016/j.cose.2025.104543. |
| [23] | J. Spravil, C. Hemminghaus, M. von Rechenberg, E. Padilla, and J. Bauer, "Detecting maritime GPS spoofing attacks based on NMEA sentence integrity monitoring," Journal of Marine Science and Engineering, vol. 11, no. 5, art. 928, 2023. https://doi.org/10.3390/jmse11050928. |
| [24] | Fazecast, Inc., "jSerialComm: Platform-independent serial port access for Java." [Online]. Available: https://fazecast.github.io/jSerialComm/. |
| [25] | E. Gamma, R. Helm, R. Johnson, and J. Vlissides, Design Patterns: Elements of Reusable Object-Oriented Software. Reading, MA, USA: Addison-Wesley, 1994. |
| [26] | M. Fowler, Patterns of Enterprise Application Architecture. Boston, MA, USA: Addison-Wesley, 2002. |
| [27] | Oracle Corporation, "Java compiler API (javax.tools)," Java SE Documentation, 2023. [Online]. Available: https://docs.oracle.com/en/java/javase/17/docs/api/java.compiler/javax/tools/package-summary.html. |
| [28] | P. D. Groves, Principles of GNSS, Inertial, and Multisensor Integrated Navigation Systems, 2nd ed. Boston, MA, USA: Artech House, 2013. |
| [29] | H.-C. Burmeister and M. Constapel, "Autonomous collision avoidance at sea: A survey," Frontiers in Robotics and AI, vol. 8, art. 739013, 2021. https://doi.org/10.3389/frobt.2021.739013. |
| [30] | G. Chen, Z. Huang, W. Wang, and S. Yang, "A novel dynamically adjusted entropy algorithm for collision avoidance in autonomous ships based on deep reinforcement learning," Journal of Marine Science and Engineering, vol. 12, no. 9, art. 1562, 2024. https://doi.org/10.3390/jmse12091562. |
| [31] | H. Chen, Z. He, J. Wang, X. Zhang, and B. Hou, "A high-precision real-time distance difference localization algorithm based on long baseline measurement," Journal of Marine Science and Engineering, vol. 12, no. 10, art. 1724, 2024. https://doi.org/10.3390/jmse12101724. |
| [32] | H. Li, H. Jiao, and Z. Yang, "Ship trajectory prediction based on machine learning and deep learning: A systematic review and methods analysis," Engineering Applications of Artificial Intelligence, vol. 126, art. 107062, 2023. https://doi.org/10.1016/j.engappai.2023.107062. |
| [33] | H. S. Hwang, T. M. Hwang, and I. H. Youn, "Efficacy evaluation of adaptive collision avoidance systems for autonomous maritime surface ships based on target ships' maneuvering behaviors," Journal of International Maritime Safety, Environmental Affairs, and Shipping, vol. 8, no. 1-2, 2024. https://doi.org/10.1080/25725084.2023.2298250. |
| [34] | D. Nguyen, R. Vadaine, G. Hajduch, R. Garello, and R. Fablet, "GeoTrackNet - A maritime anomaly detector using probabilistic neural network representation of AIS tracks and a contrario detection," IEEE Transactions on Intelligent Transportation Systems, vol. 23, no. 6, pp. 5655-5667, 2022. https://doi.org/10.1109/TITS.2021.3055614. |
| [35] | E. C. Bhatt, O. Viquez, and H. Schmidt, "Under-ice acoustic navigation using real-time model-aided range estimation," The Journal of the Acoustical Society of America, vol. 151, no. 4, pp. 2656-2671, 2022. https://doi.org/10.1121/10.0010260. |
| [36] | Y. Yang, Y. Liu, D. Sun, T. Xu, S. Xue, Y. Han, and A. Zeng, "Seafloor geodetic network establishment and key technologies," Science China Earth Sciences, vol. 63, pp. 1188-1198, 2020. . |
| [37] | QPS, “Qinsy: Survey, navigation and data acquisition software.” [Online]. Available: https://qps.nl/qinsy/. |
| [38] | Chesapeake Technology, Inc., “NMEAWiz: NMEA-0183 message generation and stress-testing tool.” [Online]. Available: https://chesapeaketech.com/products/nmeawiz/. |
| [39] | Panaaj, “NMEASimulator: NMEA / Signal K data stream generator,” GitHub repository. [Online]. Available: https://github.com/panaaj/nmeasimulator. |