-
Paper Information
- Paper Submission
-
Journal Information
- About This Journal
- Editorial Board
- Current Issue
- Archive
- Author Guidelines
- Contact Us
American Journal of Intelligent Systems
p-ISSN: 2165-8978 e-ISSN: 2165-8994
2022; 12(2): 43-50
doi:10.5923/j.ajis.20221202.01
Received: May 14, 2022; Accepted: Jun. 10, 2022; Published: Jun. 23, 2022

Smart Mobile Telecommunication Network Fraud Detection System Using Call Traffic Pattern Analysis and Artificial Neural Network
 Abstract
 Reference
 Full-Text PDF
 Full-text HTML
John C. Daka, Mayumbo Nyirenda
Department of Computer Science, School of Natural Science, University of Zambia, Lusaka, Zambia
Correspondence to: John C. Daka, Department of Computer Science, School of Natural Science, University of Zambia, Lusaka, Zambia.
| Email: |  |
Copyright © 2022 The Author(s). Published by Scientific & Academic Publishing.
This work is licensed under the Creative Commons Attribution International License (CC BY).
http://creativecommons.org/licenses/by/4.0/

Fraud is a major challenge facing telecommunication industry. A huge amount of revenues is lost to fraudsters who have developed different techniques and strategies to defraud the Mobile Telecommunication service providers. Mobile Network Fraud Detection systems used in the telecom industry by Mobile Network Operators (MNO) in Zambia has not explored most out of the Artificial Neural network techniques, analysing the Call Detail Records (CDRs), Call Traffic Pattern Analysis and Machine Learning classification algorithms. This study presents a Sim Box fraud detection model that identifies fraud patterns, it uses Artificial Neural Networks as an enabling tool to classify calls as either fraudulent or legitimate based on the attributes of the call. Actual Call Detail Records (CDR) collected from a Telecommunication company in Zambia was used. Out of a total of 13,398 CDR records, a total of 7,006 unique call records were obtained after sampling using a technique known as sampling without replacement where each sample unit of the call activity had only one chance to be selected in the sample for the study. The data set contained call records from both fraudulent and legitimate callers. Feature selection was performed on the data in order to eliminate redundant variables and select the attributes that would best describe fraudulent behaviour. The data set was partitioned as follows: 70% of the data set was set aside for training, 15% for validation and the remaining 15% was the testing set. The implementation of the Artificial Neural Network was based on the Matlab Neural Network toolbox known as the Neural network pattern recognition tool using Matlab R2018a. The trained network achieved 100% classification performance on the test data set as a result of having a balanced data set for the test. The study established that Artificial Neural Network are a successful technology that can be applied in Sim Box fraud detection since it was able to detect abrupt changes in established calling patterns which may be as a consequence of fraud. The implementation of the fraud detection tool will be a big step towards detection and mitigation of Sim Box fraud for mobile telecommunication companies in Zambia.
Keywords: Call Detail Record (CDR), Artificial Neural Network, Matlab R2018a, Fraud, Sim Box Fraud, etc.
Cite this paper: John C. Daka, Mayumbo Nyirenda, Smart Mobile Telecommunication Network Fraud Detection System Using Call Traffic Pattern Analysis and Artificial Neural Network, American Journal of Intelligent Systems, Vol. 12 No. 2, 2022, pp. 43-50. doi: 10.5923/j.ajis.20221202.01.
Article Outline
1. Introduction
- According to the cyber-telecom crime report 2019, “The annual cost of telecommunications subscription fraud is estimated by some to reach up to more than US$12 billion, while others foresee the actual losses to be far greater, estimating it to be between 3 percent and 10 percent of the operators’ gross revenues” (Cyber-Telecom Crime Report 2019 p.6). Within Zambia, telecommunication companies have broaden ways of carrying out operations from getting into the banking sector (Fintech Industry through mobile Money) and manufacturing, into real estate and find themselves in an unfamiliar territory of unprecedented threats from consumers. In a society with increasing high cost of living, many consumers of the telecom service tend to disregard the traditional values and tend to be under pressure in committing fraud. PwC 2018 Global Economic Crime and Fraud Survey: Zambia Report estimates fraud Committed by the Consumer is the second most prevalent type of economic crime experienced by Zambian organisations after Asset Misappropriation at an incident rate of 39%, This is 10% more than the reported prevalence globally’’ [1]. These figures are a clear indication that fraud is a major problem, which requires serious study by scholars to minimise illegal activities.Telecommunications or telecom has been part of the evolution of modern society. Telecommunication is paramount in the operation of businesses and has become a major industry itself and with the onset of the Covid 19 pandemic and working from home culture, telecommunication has been one of the pivotal tool in this era and a very useful tool to accomplish communication thereby company goals at various aspect levels of the organisations. Deeply integrated even in day-to-day activities, it is an aspect of modern technology that is treated as a constant. However, the reality of its own threats and vulnerabilities exists. Given how critical telecom is, its threat landscape should be explored and understood as telecom technology continues to thrive.Telecommunication fraud can be defined as the misuse of the telecom infrastructure; this includes voice as well as data networks. The fraudsters intentions could be to avoid the services charges that would be charged or reduce that charge to a minimal charge, thereby not fully been charged the actual cost of the service. The intention could also be deeper than that and the fraudster’s aim might be to gain profit by misusing the network of the provider [1]. Losses due to fraud in telecom industry are highly significant. Even though telecommunication industry suffers major losses due to fraud there is no comprehensive published research on this area mainly due to lack of publicly available data to perform experiments on. The data to be used for the experiments contains confidential information of customers and in most cases law and enforcement authorities prohibit exposing the confidential information of customers [2]. On the other hand, any broad research published publicly about fraud detection methods will be utilized by fraudsters to evade from detection [1], [3]. Consequently, huge amount of revenues is lost to fraudsters who have developed different techniques and strategies to defraud the Mobile Telecommunication service providers. Telecommunication Company worldwide suffers from customers who use the provided services without paying. Even though this is a small percentage comparing to the Telecom Operators' revenue, it is still a significant loss. For any service provider to remain in the industry, the expected loss from the activities of these fraudsters should be highly minimized if not eliminated completely. But due to the nature of huge data and millions of subscribers involved, it becomes very difficult to detect this group of people [4].For this purpose, there is a need for a Smart Mobile Telecommunication Network Fraud Detection System model that can capture both the present and past history of the subscribers and classify them accordingly with a very accurate deep learning algorithm and near real time processing system. Toll Bypass fraud is the unlicensed insertion of traffic onto another carrier’s network. In many countries and in Zambia in particular, toll bypass for international call termination is criminal fraud. This scenario requires that the fraudsters obtain network access which makes international calls appear to be cheaper, domestic calls, effectively “bypassing” the normal payment system for international calling. One common technique for perpetrating this Interconnect fraud is GSM Gateway fraud, or SIM Boxing.Neural Networks are promising solutions to this type of problem as they can learn complex patterns and trends within a noisy data. Neural networks have particularly shown better performance results than other techniques in the domain of telecom fraud. Therefore, supervised learning method was applied using Multi-layer perceptron (MLP) as a classifier. The dataset that was used for this study was obtained from a real mobile communication network in Zambia and contains subscriber’s/SIM cards that have been tested and approved by the operator to be Toll bypass fraud and Schemes conducted over the telephone cards as well as normal SIM cards.
2. Related Work
- Today, telecommunication market all over the world is facing a severe loss of revenue due to fraudsters [5]. To overcome such business hazards and to retain the market, operators are forced to look for alternative ways of using artificial neural networks techniques and statistical tools to identify the cause in advance and to take immediate actions in response. This can be possible if the past history of the subscribers were analysed systematically. Fortunately, telecom industries generate and maintain a large volume of data such as Call detail data and Network data [6]. One reason for the non-utilization of this potential is the insufficient knowledge of the Artificial Neural Networks and algorithms to be used on such data.Despite being a relatively new technology that has not fully matured, there are a number of industries such as telecoms, hospitals, schools, banks, insurance companies and retail store that are already using artificial neural networks to drive business insight on the customers and therefore recommend or improve the customers experience. A general neural network model for estimating telecommunications network reliability, Studies on the design of communications networks, reliability has been defined in a number of ways. In this study, a probabilistic measure, all-terminal reliability, was considered (this is sometimes termed overall network reliability). All-terminal reliability is the probability that a set of operational edges provides communication paths between every pair of nodes. A communications network is typically modelled as a graph with nodes, and edges; nodes represent sites (computers), and edges represent communication links. Each node, and each edge has an associated probability of failure, and the reliability of the network is the probability that the network is operational. The definition of reliability thus depends on which components are operational. F. Altiparmak, et al proposed a new method, based on an artificial neural network (ANN), to estimate the reliability of networks with identical link reliability [7].Y. Harkouss et al in the use of artificial neural networks in nonlinear microwave devices and circuits modelling: An Application to Telecommunication System Design. They investigated in detail possible application of neural networks to modelling of large-signal hard-nonlinear behaviour of power transistors for circuit design purpose, and modelling of nonlinear circuits such as power amplifiers for system design purpose. The problem of finding a good model is discussed through solutions offered by neural networks, with particular interest in wavelet networks trained by BFGS algorithms [8].To survive in the fierce competition of telecommunication industry and to retain the existing loyal customers, prediction of potential churn customer has become a crucial task for practitioners and academicians through predictive modelling techniques. The identification of loyal customers can be done through efficient predictive models. By allocation of dedicated resources to the retention of these customers would control the flow of dissatisfied consumers thinking to leave the company. Y. Khan et al proposed artificial neural network approach for prediction of customers intending to switch over to other operators. This model works on multiple attributes like demographic data, billing information and usage patterns from telecom companies’ data set. In contrast with other prediction techniques, the results from Artificial Neural Networks (ANN) based approach can predict the telecom churn with accuracy of 79% in Pakistan. The results from artificial neural network are clearly indicating the churn factors, hence necessary steps can be taken to eliminate the reasons of churn [9]. Much work and research in fraud mitigation has not been around the use of ANN in analysing or finding a pattern in the CDRs due to the fact that CDRs are not readily made available as in most countries this is a violation against the privacy of the subscribers of the service, Hence Therefore, this study intends to study the set of attributes that can be used to detect Toll bypass fraud and Schemes conducted over the telephone fraud as these are the most prevailing type of telecommunication frauds in a developing country like Zambia.
3. Study Design
- This research study used a quantitative based approach. Therefore, the choice of this research method depended upon the underlying philosophy of research, data which was numerical and presentation of results [10]. Our research study did not involve any participatory worldview or participants as the data used was secondary data, thus, no questionnaires, interviews or surveys were formulated. Quantitative based approach was chosen because it emphasizes objective measurements and numerical analysis of data collected by manipulating pre-existing data using computational techniques.This project employed the CRISP-DM process model in the implementation of the fraud detection system particularly the Sim box type of fraud. The CRISP-DM model has been recommended as the best model by various data miners as it encourages best practices and offers organizations the structure needed to realize better, faster results from data mining [11].The CRISP-DM methodology employs six steps as illustrated below. Each of the steps is described in more detail in the section:
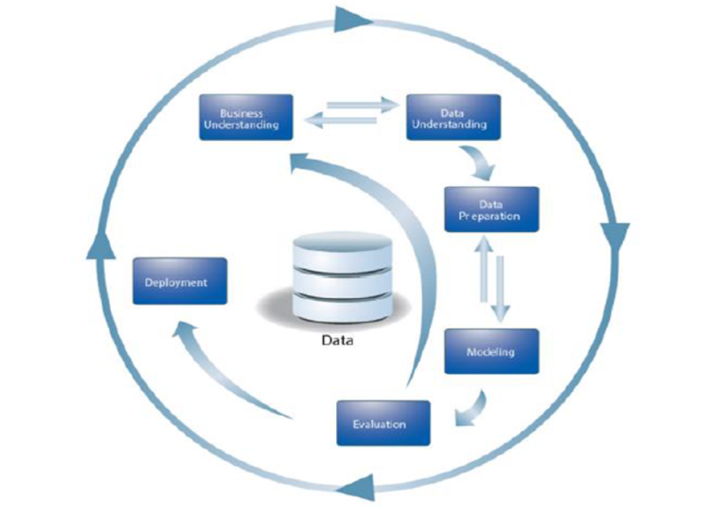 | Figure 3.1. The CRISP-DM Process Model [11] |
3.1. Data Sources and Collection Procedures
- The sources of data used in this study is secondary data. The data collection procedure was conducted through direct data extractions from the database system at Telecom X and this did not involve any human subjects or participants. The identified data source was a database system at Telecom X and discussing the details of the data source system such as system name, version number and operating system platform is out of scope for this study. Historical call records data was extracted covering December 2020 and April 2021 for a specific site and sector under the experiment. Successful data mining projects usually employ the use of large collections of data normally subject oriented, historical and time variant. The goal for successful data mining is always to ensure the data covers all possible phases of change in the subject being investigated. In order to meet this requirement, we aim to use data collected over a specific period of time containing all possible scenarios.For this study, actual Call Detail Records (CDR) collected over five months from a telecommunication company in Zambia the provides telecommunication services to the Zambian local and foreigners customers. The five months’ sampled randomly data provided a total of 13,398 CDR records for a particular site and sector that was under experiment for this project. CDR is a data record that contains information related to a telephone call, such as the origination and destination addresses of the call, the time the call started and ended, the duration of the call, the time of day the call was made and any toll charges that were added through the network or charges for operator services, among other details of the call.The data set contains time series of call records from both fraudulent and legitimate callers and will be used in developing the neural network model. For privacy reasons the results will be presented with masked call data.The data set was partitioned into three parts: training set, validation set and a test set. The training set was used in training the network. The Validation set was used to fine-tune model. Finally, the test set was used in testing the accuracy of the model.Figure below shows a section of the raw CDR data. The first row is a description of the attributes. The actual data begins on the second row.
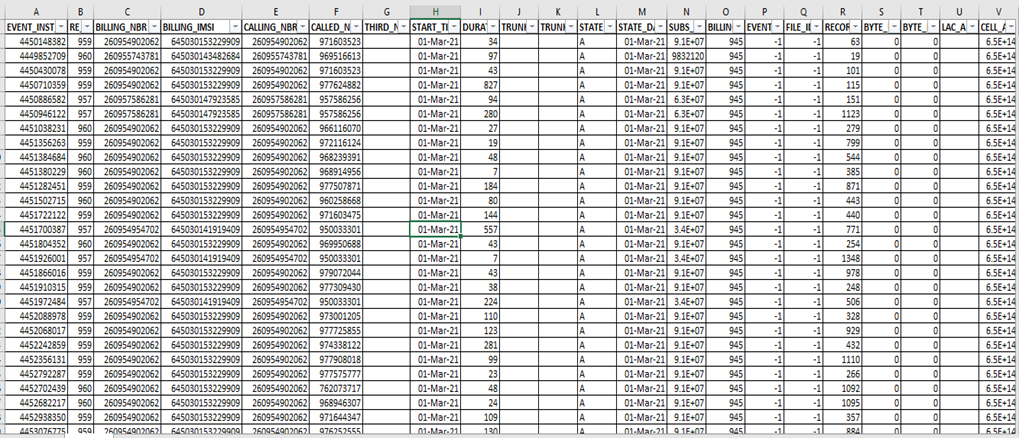 | Table 3.1. CDR File |
|
4. Performance Modeling & Results
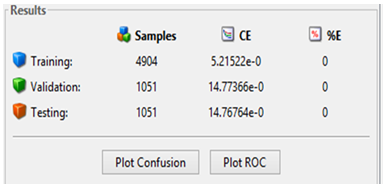
- Network Training Results The neural network training ran for 73 epochs (iterations on the training data set) as shown in Figure 4-1 below;
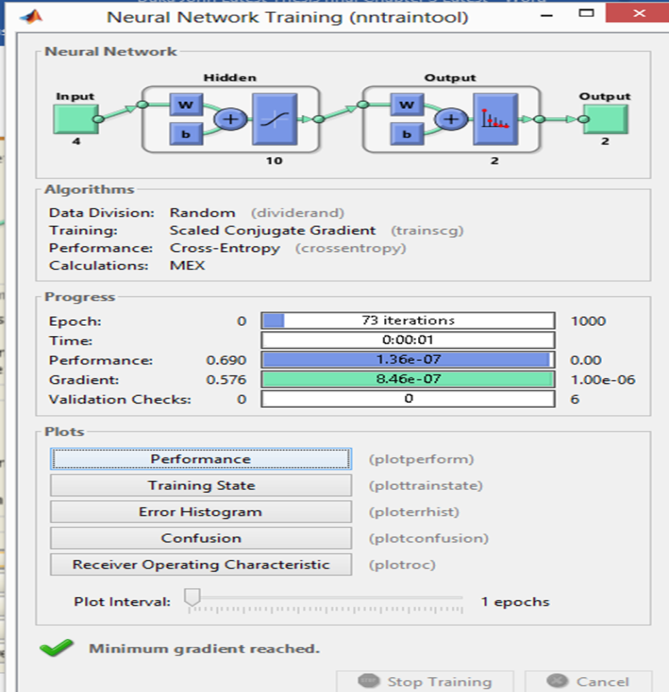 | Figure 4.1. Neural Network training |
|
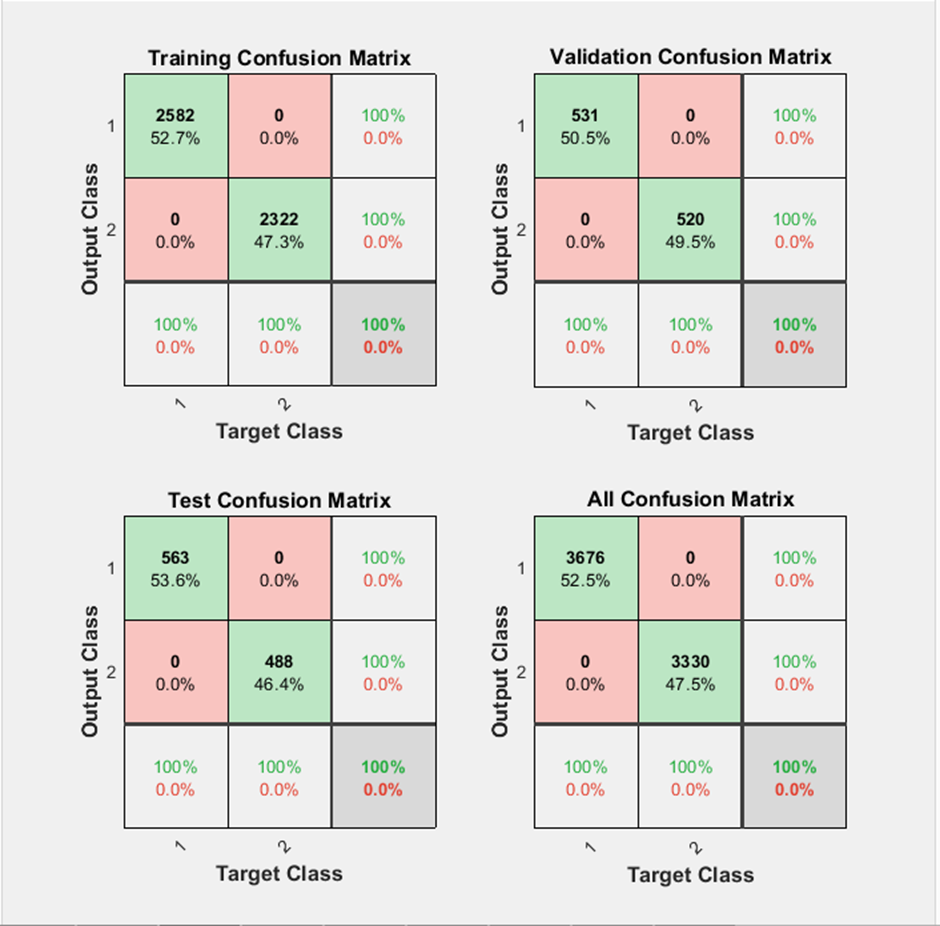 | Figure 4.2. Confusion Matrix |
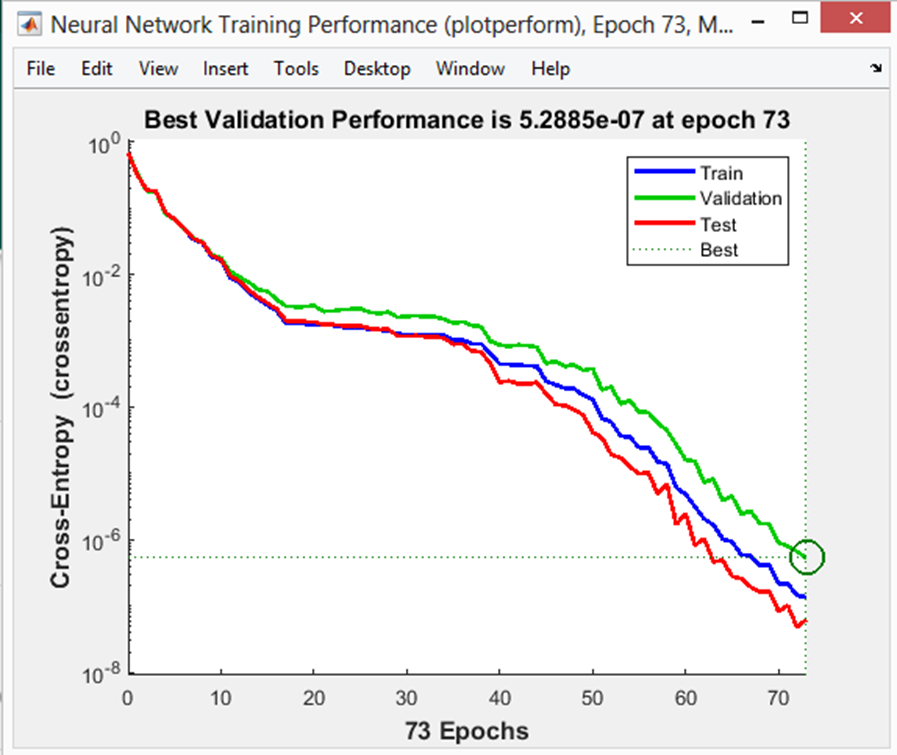 | Figure 4.3. Neural Network Training performance |
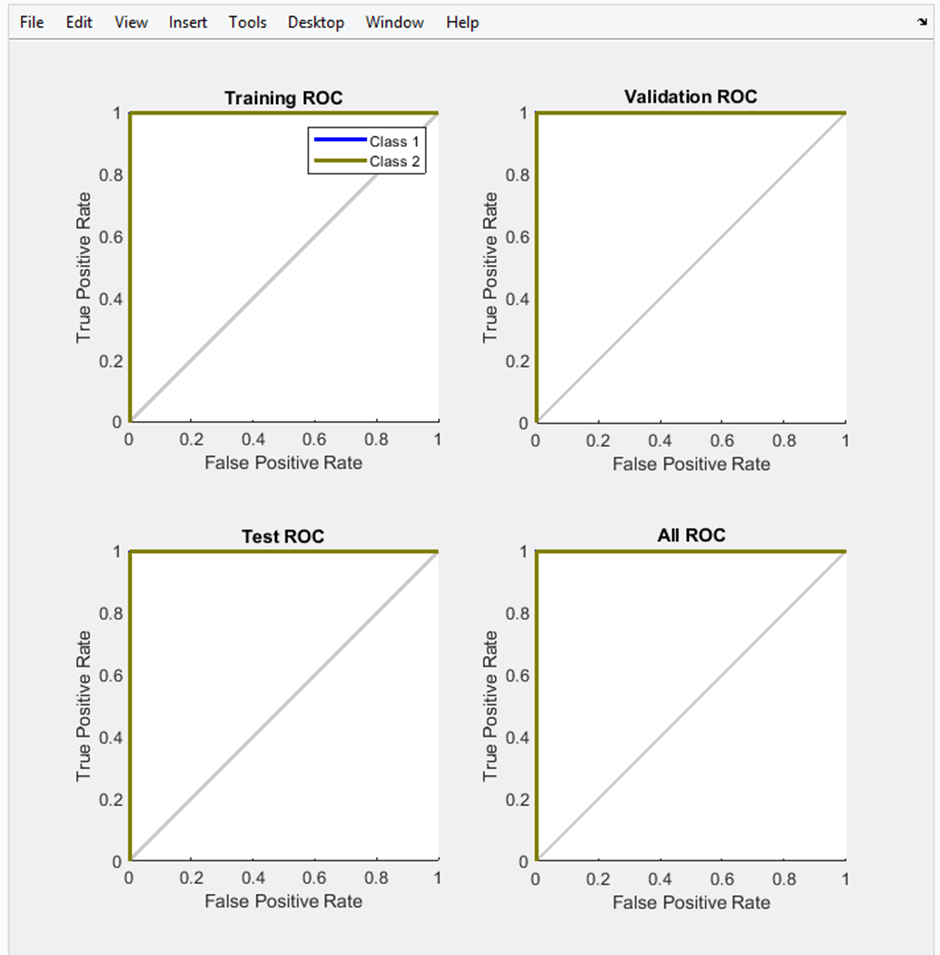 | Figure 4.4. Receiver Operating Characteristic (ROC) Curves |
5. Future Scope and Conclusions
- Fraud detection is one of the major step in mitigating revenue loss by telecom companies that is incurred annually, future work need to be focused on certain months of the year as fraudsters have focused on scamming callers in certain months of the year compared to other months. We also recommend that future research in this area combines different data for data mining and even use more than one model each with different algorithm to mine data. Comparing the results obtained by each model might increase confidence in the results.
ACKNOWLEDGEMENTS
- I would like to thank my supervisor Dr. Mayumbo Nyirenda, Head of Department - Department of Computer Science, School of Natural Sciences at the University of Zambia, Special thanks also go to my wife Hilda, my sons-Taonga and Takondwa Bukata, Mum, Dad in memory, my siblings, and my friends. I love you guys. May God Continue Blessing you!