-
Paper Information
- Paper Submission
-
Journal Information
- About This Journal
- Editorial Board
- Current Issue
- Archive
- Author Guidelines
- Contact Us
American Journal of Intelligent Systems
p-ISSN: 2165-8978 e-ISSN: 2165-8994
2017; 7(2): 39-46
doi:10.5923/j.ajis.20170702.01

Big Data Analytics for Disparate Data
 Abstract
 Reference
 Full-Text PDF
 Full-text HTML
Lidong Wang, Randy Jones
Institute for Systems Engineering Research, Mississippi State University, Vicksburg, USA
Correspondence to: Lidong Wang, Institute for Systems Engineering Research, Mississippi State University, Vicksburg, USA.
| Email: |  |
Copyright © 2017 Scientific & Academic Publishing. All Rights Reserved.
This work is licensed under the Creative Commons Attribution International License (CC BY).
http://creativecommons.org/licenses/by/4.0/

Disparate data is heterogeneous data with variety in data formats, diverse data dimensionality, and low quality. Missing values, inconsistencies, ambiguous records, noise, and high data redundancy contribute to the ‘low quality’ of disparate data. It is a challenge to integrate disparate data from various sources. Big data is often disparate, dynamic, untrustworthy, and inter-related. Big Data analytics can be used to analyze correlation between factors and detect patterns or uncover unknown trends in disparate data. This paper introduces quality problems of disparate data. Some methods and technology progress regarding Big Data analytics for disparate data are presented. Challenges of Big Data analytics in dealing with disparate data are also discussed in this paper.
Keywords: Big Data, Big Data Analytics, Disparate Data, Intelligent Information Systems, Deep Learning, Machine Learning, Data Mining, Artificial Intelligence, Knowledge Discovery
Cite this paper: Lidong Wang, Randy Jones, Big Data Analytics for Disparate Data, American Journal of Intelligent Systems, Vol. 7 No. 2, 2017, pp. 39-46. doi: 10.5923/j.ajis.20170702.01.
Article Outline
1. Introduction
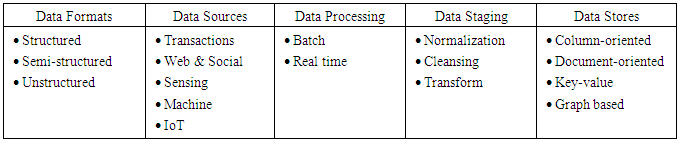
- Many data sets are heterogeneous in type, structure, organization, granularity, semantics, and accessibility, etc. [1]. The high diversity of data sources often leads to data silos, a collection of non-integrated data management systems with heterogeneous schemas, APIs, and query languages [2]. Data types from heterogeneous sources are often required to be unified during pre-processing. Holistic data integration methods for achieving scalability to different sources should be automatic or only require minimal manual interaction [3]. Data integration is a process involving the combination of multiple local sources without putting their data into a central warehouse. It can ensure the interoperation of the sources and access to the up-to-date data [4]. It is important for heterogeneous data sources to be harmonized into a single data framework before they are consolidated and integrated. Efforts are therefore required to develop a system that can map different standards to a common format or to create semantic interoperability between the standards [5].Disparate data is heterogeneous data that is collected from any number of sources. The sources may be known or unknown and include various formats. Disparate data includes a lot of noise and many inaccurate records making it necessary to filter the noise and remove these inaccurate records [6]. Big data is often identified as disparate data when the sources are heterogeneous. Big data was defined as “datasets whose size is beyond the ability of typical database software tools to capture, store, manage, and analyze.” Big data often ranges from a few dozen terabytes (TB: approximately 1012 bytes) to multiple petabytes (PB: approximately 1015 bytes) [7]. Big data is often represented by large amounts of high-dimensional and poorly structured or organized forms when the data is typically generated from heterogeneous sources. It can be either structured (e.g. spreadsheets, relational databases), unstructured (e.g. text, image), and/or semi-structured such as radio frequency identification (RFID) data and extensible markup language (XML) data. Big Data is often selective, incomplete, and erroneous [8, 9]. Characteristics of big data can be categorized into “7 Vs” [10-15] as follows:• Volume: massive amounts of data.• Variety: heterogeneity of data types, representation, and semantic interpretation.• Velocity: data is generated at a rate exceeding those of traditional systems.• Variability: data changes (dynamic) during processing and the lifecycle. • Veracity: accuracy, truthfulness, and reliability. • Valence: connectedness; being connected when two data items are related to each other.• Value: added value brought from the collected data. It is difficult for traditional data models to handle complex data within the framework of big data. There have not been any acknowledged effective and efficient data models to handle big data [9]. Table 1 [16] describes big data in various aspects. Internet of Things (IoT) are items that are identifiable as a part of the Internet. They enable better processes and offer better services when they connect with each other on the Internet. The process of changing data into an appropriate format for analysis is defined as transform. When a store is column-oriented, data is stored in columns and attribute values belonging to the same column are stored contiguously. A document-oriented store supports complex data forms, such as JSON, XML, and binary forms. Key-value helps store and access data with a very large size. A graph database uses graph models with nodes, edges, and properties related to each other through relations [16]. Big Data analytics is powerful in discovering unapparent correlations in the data [17].
|
2. Disparate Data and Big Data
2.1. Data Quality Problems
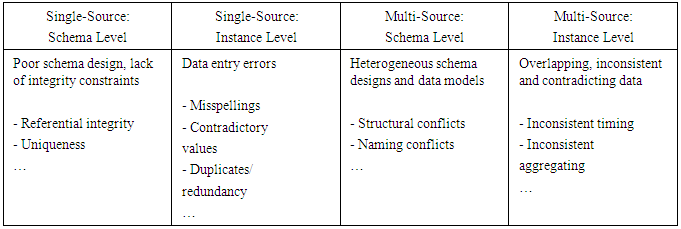
- Data from a single source is often considered clean. However, the nature of data is often “messy” due to its heterogeneity when it’s in its native formats and “dirty” (including missing, mislabeled, incorrect, or possibly spurious data). This makes the data incompatible with other data sources [17]. Table 2 [18] lists data quality (veracity) problems from the single-source and the multi-source, and between the schema level and the instance level, respectively.
|
2.2. Missing Data
- Missing data can be categorized into the following three types [22]: (1) Missing completely at random—The data missing is completely at random (MCAR) if the presence of missing data on a variable is not related to any other observed or unobserved variable.(2) Missing at random—If the presence of missing data on a variable is related to other observed variables but not to its own unobserved value, then the data is missing at random (MAR).(3) Not missing at random—If the missing data for a variable is neither MCAR nor MAR, then it is not missing at random (NMAR).Most methods for handling missing data assume that the data is either MCAR or MAR. In this situation, the mechanism producing the missing data can be ignored and the relationships of interest is modelled after replacing or deleting the missing data [22]. If the number of records with missing values is small, the records can be omitted. However, if there are a large number of variables, even a small proportion of missing data could affect many records [23]. R and its functions can be used to identify missing data in a data set.Missing values can cause troubles for modelers. Some tools handle missing values by ignoring them; otherwise, suitable replacements should be determined [24]. Data imputation is a research area that seeks to impute missing values for producing improved models [9]. Multiple imputation (MI) is often a choice for complex missing values problems. It is based on repeated simulations and provides an approach to handling missing data [22]. The following are common methods for handling missing data: • Discarding instances—deleting all instances where there is at least one missing value and using the remainder. However, the disadvantage of this method is that discarding data may destroy the reliability of the results obtained from the data and this method is generally not recommended although it is possibly worth trying when the proportion of missing data is small [25].• Replacement by the most frequent value or an average value. An effective way for a categorical attribute is using the most frequently occurring (non-missing) value. A swift, simple method of filling in the unknown continuous values is using a central value such as the mean and the median. However, the presence of outliers (extreme values) can distort the calculation of the mean making it unsuitable to use the mean before checking the distribution of the variable. Therefore, for variables with outliers or for skewed distributions of variables, the median is a better choice [25, 26]. Preserving standard deviation. When the mean is used as a central value to fill in the missing value, this method is called preserving mean. Preserving standard deviation is another method. It is better because it provides a less biased estimate of the missing value. The mean is just a measure of centrality. The standard deviation reflects the information about the variability within a variable’s distribution. Therefore, it reflects much more information about a variable than the mean does [24]. Exploring the relationship between variables to fill in missing data. This can be determined with regression, inference-based tools using a Bayesian formalism, or decision tree induction [20, 26].
2.3. Duplicates and Redundancy
- Duplicate instances or observations in a data set are often resulted from heterogeneous systems or sources. Duplicates can have a negative effect on the training process of machine learning [27]. R and its functions can be used to detect and remove duplicates in a data set.An attribute is redundant if it can be “derived” from another attribute or a set of other attributes. A large number of redundant values can slow down or confuse the process of knowledge discovery [28]. For machine learning schemes, redundant attributes or variables can result in less accurate models [20]. Redundant variables reflect a high degree of possible nonlinear correlation. Removing redundant attributes, especially if there are a lot of them, will improve modeling speed [24]. For some algorithms (e.g. regression and logistic regression), redundant data will make them fail. Removing attributes that are strongly correlated to others helps avoid multicollinearity problems that possibly occur in various models (multicollinearity is an issue that two or more predictors share the same linear relationship with the response variable.) [23]. Therefore, steps must be taken to avoid redundancy in addition to data cleaning during the data integration process. Many redundancies can be detected by correlation analysis. Given two variables, correlation analysis can be used to measure how strongly one variable relates to the other based on the available data. For numerical variables, the correlation between two variables can be evaluated through computing the correlation coefficient. A strong (positive or negative) correlation between two variables indicates that the two variables have much overlapping information and one of the two variables should be removed before further analysis [28].Data reduction can reduce data size through eliminating duplicates, removing redundant attributes, aggregating, and clustering. The subset selection of attributes reduces the data set size through removing redundant or irrelevant attributes; therefore, dimension reduction is achieved [28]. One of the huge challenges is how to handle noise in big data when processing big data from open sources. Improving the data quality (i.e., filtering out the big noise in big data) is an important issue [6].
2.4. Variety in Disparate Data
- Structured data results in rapid analysis; however, unstructured data sets (emails, audio and video streams, and social media content) make analysis time-consuming or even very difficult. Unstructured data should be correctly categorized, interpreted, and consistently labelled [17]. A great challenge to high quality and efficient data integration includes a high data volume and heterogeneity caused by the high number of data sources. Nevertheless, high efficiency can be achieved using Big Data analytics and its platforms for parallel processing and blocking-like techniques [3]. Successful data analytics depends upon having access to semantically-rich data which connects all the relevant information of a given analytical task. However, heterogeneous data flows result from different big data sources with various natures, quality levels, and forms (structured, semi-structured, and unstructured). Another important point to note is that sensed data are often at low levels and semantically poor. This makes the data integration process very difficult, which means new methods for the data aggregation and fusion of heterogeneous data sources are needed [29]. Because the integration process is an immense challenge when there is a mix of structured, semi structured, and unstructured data. The following areas are some suggested strategic focuses of Big Data analytics [30]: • Modelling and discovering causality in structured data (well understood from data mining points of view) • Modelling and discovering causality in unstructured data (poorly understood, but progress is being made in machine learning and artificial intelligence, etc.) • Integrating unstructured causality models with structured causality models (not well understood, but progress has been made in complex event processing and system dynamics, etc.)
3. Some Methods, Challenges and Technical Progress in Big Data Analytics for Disparate Data
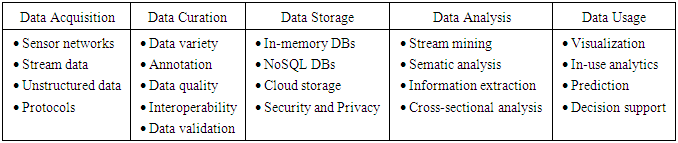
- A complete data value chain starts at data acquisition; followed by curation, storage, analysis, and usage. Activities and technical challenges along the data value chain are listed in Table 3 [31], but this is not an all-inclusive list. Methods that are computationally efficient and able to handle heterogeneous data types (e.g., discrete counts, continuous values, etc.) and complex data structures (e.g., networks, trees, or domain-specific structures) are increasingly necessary. One major challenge is the integration of heterogeneous big data from different sources [32].
|
4. Data Mining and Machine Learning for Disparate Data
4.1. Dimension Reduction
- Principal components analysis (PCA) is an unsupervised method of handling high-dimensional data; a dataset is transformed to a new coordinate system from its original coordinate system. The first axis of the new coordinate system is chosen in the direction of the most variance in the dataset and the second axis is orthogonal to the first axis and in the direction of the second largest variance. This procedure is repeated and it is found that the majority of the variance is contained in the first few axes [38]. PCA is especially effective when the columns of data are strongly correlated and in this situation, the correlated columns can be replaced with a single column, which reduces data dimensionality, reduces data complexity, and identifies the most important features of the data [39].Factor analysis is another method for dimension reduction and it can be assumed in factor analysis that some unobservable latent variables generate the observed data. It is also assumed that the observed data is a linear combination of the latent variables and some noise. The number of the latent variables is usually less than the number of variables in the observed data, which achieves dimension reduction [38]. Exploratory factor analysis (EFA) is a series of methods which are designed to uncover the latent structure in a given set of variables. Both PCA and EFA are based on correlation matrices and it is important to remove or impute missing data before proceeding with analysis [22].Challenges in Big Data analytics arise due to the high dimensionality and the amount of data. High dimensionality can also result in spurious correlations because unrelated features may be correlated simply by chance, which leads to erroneous inferences and false discoveries [8].
4.2. Performance, Evaluation Criteria and Challenges of Data Mining
- Performance issues of data mining include scalability, efficiency, and the parallelization of algorithms, etc. Data mining algorithms need to be scalable and efficient in order to extract information effectively from a large amount of data. In other words, the run time of data mining algorithms should be acceptable and predictable [28]. A lot of research is still needed to overcome the challenges related to accuracy, scalability, heterogeneity, speed, provenance, trust, privacy, and inter-activeness [40]. Provenance is directly related to the trust and accuracy of the source data and the results of data mining. However, provenance information is not always available or recorded. Numerous problems regarding provenance and mining have not been solved because there is a lack of many sources [40]. The data mining speed is strongly related to two main factors: the efficiency of data mining algorithms and the data access time. It is necessary to improve the speed of data mining and big data access by exploiting and identifying potential parallelisms for the data access and data mining algorithms. The original dataset is divided into many small subsets in data parallelism and the same program runs on each of the partitions; the results are then merged to get a final result [40]. The computational complexity of some data mining algorithms, the large data size of many databases, and widely distributed data are motivating factors for developing parallel and distributed data mining algorithms. Such algorithms are used to divide the data into partitions, note that the division process is parallel as well as the parallelism of the computation process of data mining [28]. It is difficult for a single processor system to provide responses and results efficiently for large data mining if parallelism is not performed. There are some versions of parallel clustering (one of parallel data mining methods) such as parallel clustering based on parallel k -means. However, parallel data mining introduces new complexity as it incorporates techniques and algorithms into parallel programming and databases [41].There are numerous challenges in data mining research. Some challenges are as follows [42]: 1) scalability for high speed stream data and high-dimension data, 2) knowledge mining from complex data, 3) mining multi-agent data and distributed data mining, 4) handling unbalanced, non-static, and cost-sensitive data, 5) network data mining, 6) mining time-series data and sequence data, and 7) development of a unified theory of data mining. Big Data analytics and mining has the potential to extract valuable information from big stream data due to its volume, velocity, and variability. Heterogeneous mixture learning is also an advanced technology to be developed for the analysis of heterogeneous data [36].
4.3. Traditional Machine Learning Methods and Deep Learning
- Traditional machine learning (ML) methods have the following limitations [43]:• For distributed data sources, data repositories are physically distributed, often dynamic, and big in volume. It is often not practicable to put all the data into a central location for analysis. Therefore, knowledge acquisition systems are required to perform necessary analyses at data locations so that the results of analyses are transmitted to the needed locations for further process or analysis. The systems are also required to learn from statistical summary of data.• It is often required to reconcile semantic differences from the user’s point of view when heterogeneous sources in a given context are used. For learning purposes, methods are needed to efficiently and dynamically extract and integrate information from distributed and semantically heterogeneous sources according to user-specified ontologies and mappings between ontologies.The following three primary reasons make traditional ML methods unsuitable for solving big data classification problems [44]: firstly, an ML method generally performs training using some class types. There are often many varieties of class types (even new class types) in a dynamically growing dataset, which possibly results in inaccurate classification results. Secondly, an ML method that performs training on a particular data domain or labeled dataset is possibly not suitable for another data domain or dataset; therefore, the classification based on the ML method is probably not robust over different data domains or datasets. Thirdly, an ML method is based on a single learning task and is unsuitable to fulfill the multiple learning tasks and knowledge transfer requirements of Big Data analytics. The support vector machine (SVM) has a good performance among ML methods; however, it works well only for datasets with a moderate size and has limitations for big data applications. In addition to the challenge of handling large volumes of data, Big Data analytics poses some unique challenges for ML. These challenges lie in highly distributed input sources, variety in formats of the raw data, data trustworthiness, high dimension data, un-categorized and unsupervised data, algorithm scalability, limited supervised/labeled data, fast moving stream data, data with noise and in poor quality, and imbalanced input data [45].Deep learning architectures and algorithms are suitable to deal with issues related to the variety and volume of big data. The challenges of deep learning in Big Data analytics for disparate data include handling high-dimension data, distributed computing, learning with stream data, and model scalability [45]. Distributed learning has attracted considerable attention. Among other methods of learning from large datasets, high performance parallel computing is very useful in dealing with distributed data [43].
5. Conclusions
- Necessary and important procedures in handling the disparate data include data cleaning (handling missing data and eliminating erroneous, inconsistent, noisy, and duplicate data, etc.), removing redundant variables, dimension reduction and feature extraction, and data integration (resolving data forms and heterogeneity in semantics). Common methods for dealing with missing data include discarding instances (generally not recommended), replacement by the most frequent value or an average value, preserving standard deviation, and exploring the relationship between variables. R and its functions are powerful in identifying missing data and removing duplicates. Multicollinearity problems can be avoided by removing attributes that are strongly correlated to others. The data lake helps fix problems in data integration and data accessibility; it is also an emerging method for cloud-based big data.PCA is a dimension reduction method as well as an exploratory tool to identify trends in high dimension data. Factor analysis is another dimension reduction method. Performance evaluation criteria of data mining include scalability, efficiency, and the parallelization of algorithms. Traditional data mining and machine learning methods have limitations in dealing with big data. However, deep learning is useful for analyzing large amounts of unsupervised data, which gives it the potential to analyze disparate big data. Some progress in Big Data analytics for disparate big data has made, but there are still many challenges. More fundamental research needs to be conducted to advance core technologies for mining valuable information from disparate big data.
ACKNOWLEDGMENTS
- This paper is based upon work supported by the U.S. Army TACOM Life Cycle Command under Contract No. W56HZV-08-C-0236, through a subcontract with Mississippi State University (MSU), and was completed for the Simulation Based Reliability and Safety (SimBRS) research program at MSU.
DISCLAIMER
- Reference herein to any specific commercial company, product, process, or service by trade name, trademark, manufacturer, or otherwise, does not necessarily constitute or imply its endorsement, recommendation, or favoring by the United States Government or the Department of the Army (DoA). The opinions of the authors expressed herein do not necessarily state or reflect those of the United States Government or the DoA, and shall not be used for advertising or product endorsement purposes.As the author(s) is (are) not a Government employee(s), this document was only reviewed for export controls, and improper Army association or emblem usage considerations. All other legal considerations are the responsibility of the author and his/her/their employer(s).