-
Paper Information
- Paper Submission
-
Journal Information
- About This Journal
- Editorial Board
- Current Issue
- Archive
- Author Guidelines
- Contact Us
American Journal of Intelligent Systems
p-ISSN: 2165-8978 e-ISSN: 2165-8994
2016; 6(2): 42-47
doi:10.5923/j.ajis.20160602.02

Probabilistic Fuzzy Time Series Method Based on Artificial Neural Network
 Abstract
 Reference
 Full-Text PDF
 Full-text HTML
Erol Egrioglu1, Eren Bas1, Cagdas Hakan Aladag2, Ufuk Yolcu3
1Department of Statistics, Giresun University, Giresun, Turkey
2Department of Statistics, Hacettepe University, Ankara, Turkey
3Department of Statistics, Ankara University, Ankara, Turkey
Correspondence to: Erol Egrioglu, Department of Statistics, Giresun University, Giresun, Turkey.
| Email: |  |
Copyright © 2016 Scientific & Academic Publishing. All Rights Reserved.
This work is licensed under the Creative Commons Attribution International License (CC BY).
http://creativecommons.org/licenses/by/4.0/

Many of forecasting methods have been proposed in the literature. There are various classifications of forecasting methods. Non-probabilistic forecasting methods such as artificial neural network, fuzzy inference systems and fuzzy time series methods have been commonly used in recent years. As a consequent of this, forecasting methods can be classified into two groups as probabilistic and non-probabilistic. Fuzzy time series methods are non-probabilistic forecasting methods. In the literature, many of fuzzy time series methods have been proposed but their distributions could not be obtained for forecasts in these methods. In this study, a new probabilistic fuzzy time series method is proposed firstly. The proposed method is based on moving block bootstrap method. It is possible to obtain distributions of forecasts by using the proposed method proposed in this study. The proposed method was applied to three real world time series data and also the performance of the proposed method was examined and compared with other forecasting methods.
Keywords: Fuzzy time series, Probabilistic methods, Moving block bootstrap method, Particle swarm optimization
Cite this paper: Erol Egrioglu, Eren Bas, Cagdas Hakan Aladag, Ufuk Yolcu, Probabilistic Fuzzy Time Series Method Based on Artificial Neural Network, American Journal of Intelligent Systems, Vol. 6 No. 2, 2016, pp. 42-47. doi: 10.5923/j.ajis.20160602.02.
Article Outline
1. Introduction
- Fuzzy time series methods are known as important forecasting methods in the literature. In recent years, many of new fuzzy time series methods have been proposed. Fuzzy time series methods are based on fuzzy set theory. There are two kind of fuzzy time series approaches as time variant and time invariant methods. In the literature, the number of papers about time invariant approaches is more than the number of papers about time variant approaches. There are some other classifications of fuzzy time series methods. These are univariate and multivariate fuzzy time series methods, fuzzy time series methods based on first order and high order forecasting methods. [1] presented a good review of fuzzy time series approaches. Artificial neural networks have been employed to define fuzzy relations in the literature. [2-9] used artificial neural networks to define fuzzy relations. Multilayer perceptron artificial neural networks are generally preferred in fuzzy time series methods except a study. In the study of [9], multiplicative neuron model neural network was preferred. Because, multiplicative neuron model neural network has only one neuron, it is simpler than multilayer perceptron and it leads successful forecasting results in fuzzy time series methods. Because of human’s incapability, the randomness is a good remedy for uncertainty. Probabilistic methods employ random variables and the values of estimators are randomly changed sample by sample. Because of this, non-probabilistic methods contain randomness like probabilistic methods. However, non-probabilistic methods do not use estimators as random variables. In fuzzy methods, fuzziness is employed as a remedy for uncertainty but these methods do not use randomness. Like randomness, fuzziness can be used for all data sets because the variables can be clustered by using fuzzy clustering methods. It is well known that fuzzy clustering can be preferred to other clustering methods for real world data. The randomness and fuzziness can be used in a forecasting method, together. In this study, a probabilistic fuzzy time series approach was introduced. In the proposed method, fuzzification and determining of fuzzy relations were performed by using fuzzy c-means and multiplicative neuron model artificial neural networks, respectively. The moving block bootstrap method was used to determine the distributions of forecasts. In the second section, the techniques used in the proposed method are introduced. In the third section the prosed method is introduced. Application results obtained from our proposed method and some other methods proposed in the literature are given in section four. Finally, in section five discussions and conclusions are presented.
2. Techniques which use in Probabilistic Fuzzy Time Series Methods
- In the presence of multicollinearity, there are several remedies recommended for avoiding from its undesirable effects on the probabilistic fuzzy time series method uses fuzzy c-means, multiplicative neuron model artificial neural network, particle swarm optimization and moving lock bootstrap techniques. In following sections, these methods are given briefly.
2.1. Fuzzy C-Means
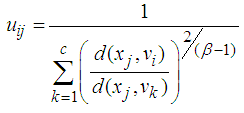
- This technique is a fuzzy clustering technique. It was proposed by [10]. In this method, the data is partitioned into fuzzy sets by minimizing sum of square error for groups.Let uij, vi and n represent the membership value, cluster center and the number of variables, respectively. Thus, the forms of the objective function to be minimized given by Equation 1.
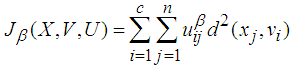 | (1) |
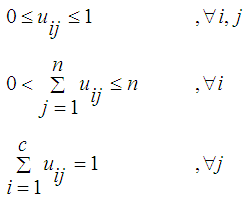 | (2) |
 | (3) |
 | (4) |
2.2. Multiplicative Neuron Model Artificial Neural Network
- Multiplicative neuron model neural networks were proposed by [11]. This neural network does not have a hidden layer and it has only one neuron. The multiplicative neuron model artificial neural network can be preferred to the other artificial neural networks because of its simple architecture. This network uses multiplicative aggregation function instead of additive function. Multiplications of inputs provide an advantage to obtain good training results in multiplicative neuron model artificial neural network.
2.3. Particle Swarm Optimization
- Particle swarm optimization (PSO) is a stochastic and artificial intelligence optimization technique. PSO technique was firstly proposed by [12]. There are many of modifications of PSO in the literature. It is well known that PSO with time varying social, cognitive coefficients and inertia weight can produce better optimization results than standard PSO. The most important feature of PSO algorithm is to reach the optimum point from several different points simultaneously in the search space. It can avoid from local optimum traps because of its feature. Each particle in the search space has a position and velocity representing the results for the optimization problem and search direction. And also, the velocities and the positions of the particles are updated by using some equations. Those who want more information can look the study of [12].
2.4. Moving Block Bootstrap
- Bootstrap techniques can be used to obtain distributions of parameters in parametric or nonparametric statistical models. In the literature, moving block bootstrap method was developed for time series data or time-dependent data. Moving block bootstrap can be applied to time series data by choosing proper block length. Determining of block length can be effective of the results. In this study, random moving block bootstrap (RMBB) technique proposed by [13] is employed. In RMBB method, block length and starting point of a block are randomly chosen by using some distributions.
3. The Proposed Method
- Fuzzy time series methods are based on fuzzy set theory. In fuzzy time series methods, linguistics was employed by using fuzzification techniques. Fuzziness is an important uncertainty type and it can be handled by using fuzzy techniques. Randomness is an important uncertainty type but it is not employed in fuzzy time series methods. Fuzzy time series methods work with data samples. The results will be changed when the data sample is changed. The data sample can be obtained randomly from population so the results will be changed randomly. As a result of this fact, forecasts of fuzzy time series methods will be randomly changed. In the statistical theory, inferences can be easily obtained for linear models. The statistical inference for distribution of parameters and forecasts in fuzzy methods are not easy because of high degree of nonlinear model structures. Bootstrap methods can be employed to obtain distribution from all statistical methods. In this study, a new probabilistic fuzzy time series method is proposed. The distributions of forecasts are obtained by using RMBB approach. The algorithm of the proposed method is given below:Algorithm 1: Main algorithm for the proposed methodStep 1 Number of fuzzy sets (nfs), length of the test set and model order (p) are determined.Step 2 FCM method is applied for training data and the fuzzy time series are obtained. Fuzzy time series is a series and its elements are index numbers of fuzzy sets. After applying FCM method, the highest membership value is determined for each observation than fuzzy time series are consisted by using index number of fuzzy set which has highest membership value for the observation.Step 3 Block length and starting point are selected randomly. Then bootstrap sample is taken from the training data of fuzzy time series according to determined block length and starting point.Step 4 The multiplicative neuron model neural network is trained by using training data and PSO method. The inputs of the network are lagged variables of fuzzy time series
 , output of the network is fuzzy time series (F(t)).Step 5 The forecasts are obtained for test data and they are kept.Step 6 Steps 3-5 are repeated until it is reached to possible bootstrap sample number.Step 7 The distributions of the forecasts and arithmetic means of bootstrap samples of forecasts are obtained. The results of forecasts of the method are arithmetic means of bootstrap samples of forecasts. Algorithm 2: Training algorithm for the multiplicative neuron model artificial neural networkStep 1 Initial velocity and position vectors of the particles are generated randomly. All initial positions of the particles are generated randomly from (0, 1) interval. On the other hand, velocities are generated randomly from (-vmaps, vmaps) interval according to the pre-determined vmaps limit value.Step 2 Fitness function value for each particle is calculated. By using outputs calculated from the network for learning samples as fitness function, root-mean squared error (RMSE) value is obtained by using Equation 5.
  | (5) |
 is the output of the network,
  is the target value and
  is the number of training examples. For the calculation of RMSE value for each particle, outputs of the network
  are calculated.Step 3
  are updated. If the fitness value of
  is under a certain value of
  , or it is reached to the maximum number of iterations, the process is stopped. Otherwise, moves to Step 4.Step 4 Velocity values of the positions and positions are updated and return to Step 2. Formulas given in Equations (6) and (7) are used.
 | (6) |
 | (7) |
4. Implementation
- For the evaluation of the forecasting performance of the proposed method, three real world time series data were analyzed. These time series include daily data 2010, 2011 and 2012 Istanbul Stock Exchange Market BIST100 index. Series 1: BIST100 index values with 104 observations observed between 01.04.2010 and 05.31.2010 (Figure 1)Series 2: BIST100 index values with 106 observations observed between 01.03.2011 and 05.31.2011 (Figure 2)Series 3: BIST100 index values with 106 observations observed between 01.02.2012 and 05.31.2012 (Figure 3)
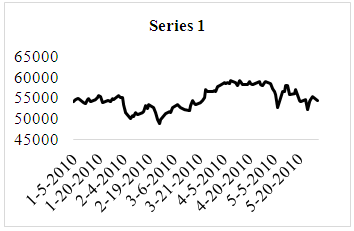 | Figure 1. Time series graph of Series 1 |
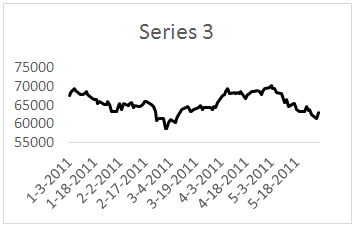 | Figure 2. Time series graph of Series 2 |
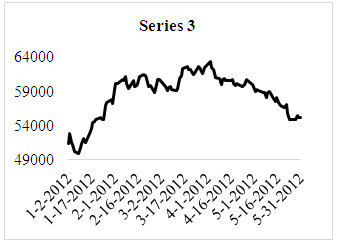 | Figure 3. Time series graph of Series 3 |
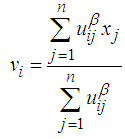
 | (4) |
 was varied between 1 and 5; the number of fuzzy sets in the proposed method was varied between 5 and 15 and bootstrap iteration number was taken as 100. Best-case results were obtained in all possible situations mentioned above. In the implementation of PSO,
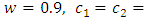
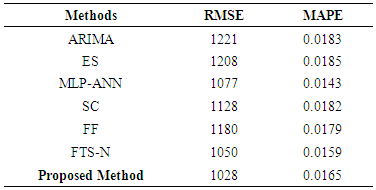
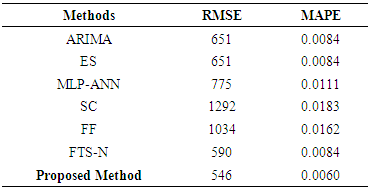
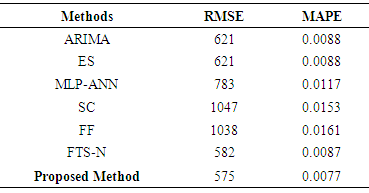
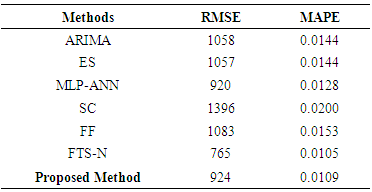
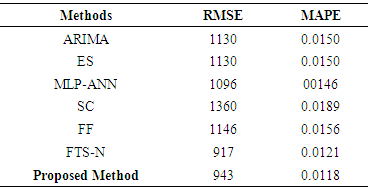
 and the maximum number of iterations was taken as 200.Tables 1 and 2 summarize the results obtained from test set for Series 1 in terms of RMSE and MAPE criteria when the length of test set
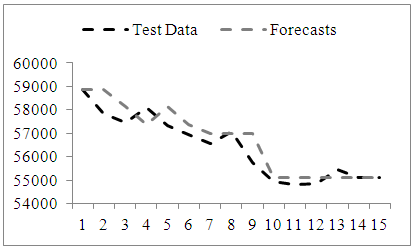
  is 7 and 15, respectively.In Table 1, the best result of the proposed method was obtained from third-order model when the number of fuzzy sets was 13. In Table 2, the best forecasting performance was obtained when the model order is 3 and the number of fuzzy set is 14. Analysis of Tables 1 and 2 reveals that the proposed method exhibits more successful and superior forecasting performance when compared with other methods in terms of MAPE and RMSE performance measures. The graphs of actual values of the test set and forecasts of the proposed method were given in Figures 4 and 5, respectively when the length of the test set is 7 and 15 for Series 1.
|
|
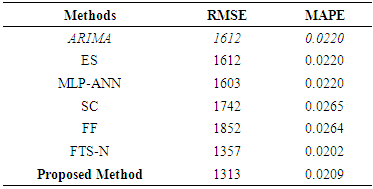
 | Figure 4. Time series graph of test data (ntest=7) and forecasts obtained from proposed method for Series 1 |
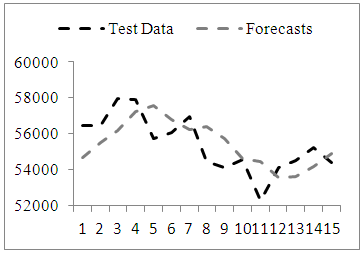 | Figure 5. Time series graph of test data (ntest=15 and forecasts obtained from proposed method for Series 1 |
|
|
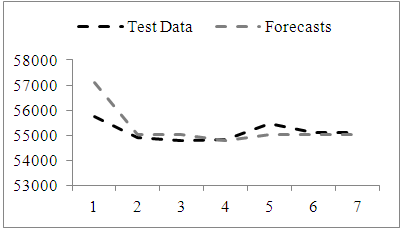 | Figure 6. Time series graph of test data (ntest=7) and forecasts obtained from proposed method for Series 2 |
 | Figure 7. Time series graph of test data (ntest=15 and forecasts obtained from proposed method for Series 2 |
|
|
|
5. Discussions and Conclusions
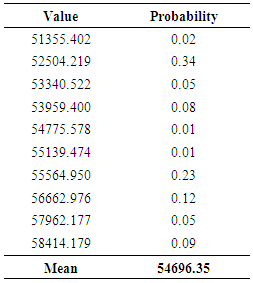
- In this paper, a probabilistic fuzzy time series method was introduced. The proposed method was applied for Istanbul stock exchange BIST100 data by using three different time series selected from the entire data. According to findings, the new method can produce better forecasts than other methods. The empirical probability distributions can be estimated for forecasts in the proposed method. The proposed fuzzy time series method is the first method which produces probabilities for the forecasts in the literature. It can be said that there is a weakness of the method about computation time. Nevertheless, the proposed method can complete to forecast a time series in a suitable time. Besides, one of the most important properties of the proposed method is to produce probabilistic results.