Cem Kocak1, Erol Egrioglu2, Ufuk Yolcu3, Cagdas Hakan Aladag4
1Department of Nursing, School of Health, Çorum, Turkey
2Department of Statistics, Marmara University, Istanbul, Turkey
3Department of Statistics, Ankara University, Ankara, Postcode, Turkey
4Department of Statistics, Hacettepe University, Ankara, Turkey
Correspondence to: Erol Egrioglu, Department of Statistics, Marmara University, Istanbul, Turkey.
| Email: |  |
Copyright © 2014 Scientific & Academic Publishing. All Rights Reserved.
Abstract
The concept of reliability statistically pertains to the data obtained. Therefore, reliability of the attitude scales and satisfaction questionnaires should be expressed as the accuracy degree of the data obtained. Accuracy is depending on whether the answers of the individuals who participate in the questionnaire reflect their real thoughts. However, individuals might not give the answers that reflect their real thoughts due to a great number of psychological factors for the attitude scales and questionnaires which have the Likert-type questions. Since the people think fuzzy during their daily life, it would be a more realistic way to take the answer of each question asked to the individuals as an interval number rather than a single value in order to acquire fuzzy data. This study has revealed that the fuzzy data obtained with a fuzzy satisfaction questionnaire for which the items (questions) are answered as an interval number is statistically more accurate than the data obtained with a classical satisfaction questionnaire for which the items are answered as a single value. Since the data obtained with a fuzzy satisfaction questionnaire is fuzzy, the reliability value of this data has been calculated as a fuzzy Cronbach Alpha reliability coefficient which is a new method of calculation. It has been demonstrated that the data obtained for the minimum and maximum values of Fuzzy Cronbach Alpha has the statistical assumptions on a large scale compared to the data obtained from a Classical Questionnaire and it has been suggested that the data obtained for the maximum value of Cronbach Alpha is the most realistic data. Thus, the proposed method has allowed for obtaining highly reliable data without need to exclude some items from the questionnaire, increase the number of samples, and perform a great number of applications for the purpose of improving the reliability.
Keywords:
Fuzzy cronbach alpha, Reliability coefficient, Interval number, Fuzzy data
Cite this paper: Cem Kocak, Erol Egrioglu, Ufuk Yolcu, Cagdas Hakan Aladag, Computing Cronbach Alpha Reliability Coefficient for Fuzzy Survey Data, American Journal of Intelligent Systems, Vol. 4 No. 5, 2014, pp. 204-213. doi: 10.5923/j.ajis.20140405.03.
1. Introduction
Crocker and Algina [1] defined Reliability as “the repeatability of measurements for a qualification carried out on the same individuals under the similar conditions”. However, with respect to the measurements in education or psychology, it is almost impossible to make repeated measurements under the same conditions [2]. So, if a low reliability value is obtained as a result of a questionnaire, attitude scale or psychological test assessment, it would be very difficult to make measurement under the same conditions after a while. Since reliability is defined as the degree of purification from random error, the measurement results are as reliable as the extent to which the results include less random errors [3]. According to the aforementioned definition, the reliability of the scores received from a test is affected by many factors including the number of items and application conditions of the test [1]. With respect to the achievement and Psychological tests, reliability can be improved by making suitable these factors. If a low reliability degree is due to the limited number of items, reliability can be increased by determining how many items should be added to the test. However, since the purpose of the satisfaction questionnaires is to determine the general satisfaction level, while the questionnaire questions are prepared, all of the items that can help determination of the general satisfaction are determined by the experts in the related subject before conducting the questionnaire. So, since addition of new items to the questionnaire in order to increase the low reliability value of a questionnaire can cause recurrence of same questions, it may not be an efficient method for improving the reliability. It also can be tried to improve reliability by deleting item/items which has/have a negative impact on reliability. Since the achievement tests contain many items that measure the same behaviour, deletion of certain items from the test would be an efficient way for attempting to improve reliability. Reliability may also be improved by deleting an item from the questionnaire in the studies intended for determination of the general satisfaction about a matter. However, in such studies, if the item deleted from the questionnaire represents an important variable that could determine satisfaction, since this variable will be excluded from the scope of the study, it is obvious that the content validity of the questionnaire will decrease even if the reliability becomes higher. So, with respect to the questionnaires intended for measuring the general satisfaction level or an attitude, all of the satisfaction questions related to the subject matter should be determined at the beginning, and no significant item should be deleted from the questionnaire for the purpose of improving the reliability. The aforementioned methods of improving the reliability by increasing or decreasing the number of items and making repeated measurements are based on the fact that the concept of reliability is addressed by its association with the content and formal content of the questionnaire or scale used. Statistically, the concept of reliability pertains to the data of the test or scale used for a specific purpose instead of its verbal or formal content. Although it has several definitions, it has been explained that the reliability pertains only to the data collected from the group tested [1, 4, 5]. So, reliability should be defined as an estimated value related to the accuracy degree of the measurement of attitudes. The Reliability Index  which is the measure of proximity of the true scores to the observed scores is defined as follows [6]:
 | (1) |
Whereas,  is the true score variance and
  is the observed score variance. The reliability index as given in (1) is a theoretical expression, and it is not calculated numerically. Therefore, it can be said that many reliability coefficient formulas developed are estimations of the Reliability Index [7]. If so, the Reliability Index can also be considered as the precision degree. Precision means that the measurement results are real. Therefore, proximity of the reliability coefficient to (1) can be considered as the proximity of the obtained results to the precision. Considering that the concept of reliability is related to the data obtained from the group subjected to the measurement, it can be said that the base cause of a low reliability is the fact that the individual subjected to the test is not always the same in terms of the measured feature. Many of the measured features are also not stable when measuring the attitudes or satisfaction level for a subject matter; and they can vary day by day, even hour by hour [2]. Therefore, it would be more realistic to take the answers from the individuals as an interval number to obtain fuzzy data rather than requiring them to answer with a single value. For example; when it is requested to answer a question such as “What point would you be give for the course content prepared by the faculty members in your department and their lecturing skills?” with a point between 0 and 100, a student may remember a faculty member who has a positive effect on that student in terms of the faculty member’s course and lecturing style and express his/her satisfaction by giving 90 points. If, at that moment, the same student thinks of the worst course and the teacher whose lecturing style is the worst according to him/her, he/she can express his/her dissatisfaction by giving 30 points. In such a case, it is most likely that the student will not state his/her actual opinion when answering that question. But, if the question is revised as follows: “What would be the minimum and maximum points given by you for the course content prepared by the faculty members in your department and their lecturing skills?”, the student will think of the most precision incompetent and most competent teachers according to him/her, and answer the question with an interval number such as [30, 90]. It is obvious that the actual opinion of the student for this question is a point within that interval number. When a satisfaction question is put to an individual having no opinion about the subject matter of that question, he/she will not give any random point stating that he/she have no idea about the question with the interval number [0, 100]; and if he/she is certain about any other question, he/she will be able to state this certainty with the interval number [50, 50]. The student’s answer [30, 90] expressing his/her satisfaction degree can be converted into a triangular fuzzy number such as (30,60,90). The statistical results to be obtained from data consisting of the fuzzy numbers will also be fuzzy numbers. So, the items included in the questionnaire can be named as fuzzy items. A fuzzy satisfaction questionnaire is defined as a questionnaire in which “the points given by the participants for each question are fuzzy numbers”. Since the people think fuzzy during their daily life, it would be a more realistic way of obtaining the results which are closest to precision if the satisfaction level is measured by conducting a fuzzy satisfaction questionnaire. A reliability coefficient to be calculated using the data obtained from a fuzzy satisfaction questionnaire will also indicate a fuzzy number in the form of
  . With the value
  is the centre of the fuzzy reliability, the values
  and
and  will be the reliability coefficients representing the minimum and maximum reliability levels, respectively. As a result of this, a broad range of data with various reliability values would be acquired by means of a single application. In this study, Cronbach Alpha and measure the standard error formula of the measurement have been given and the suggested fuzzy Cronbach Alpha Method has been introduced. The encountered problems because of the application of classical satisfaction questionnaire have been discussed and the application of fuzzy satisfaction questionnaire are argued. Finally, the study is ended by the conclusion and discussion part.
2. Cronbach Alpha Coefficient
The Cronbach Alpha reliability coefficient is defined as follows [2, 8, 9].  | (2) |
Whereas, k is the number of items included in the scale;  is the variance of the item i for
  ; and
; and  represents the variance of the total sum of all points (the variance of whole test). The standard error of the measurement [6] can be indicated as follows:
  | (3) |
Whether the reliability coefficient to be calculated for a questionnaire will prove to be low or high is also depending on whether the group subjected to the said questionnaire is homogeneous or heterogeneous in terms of the feature measured [1]. It has been emphasized that it is important to use continuous quantitative data with normality assumption in estimation of the Cronbach Alpha [10]. On the other hand, Yuan and Bentler [11] stated that it is not always possible to ensure that the items in the attitude scales have a normal distribution. When considering the Cronbach formula given in (2); the reliability of the test will increase if each item shows a distribution close to the homogeneous (with sufficiently small item variances) normal distribution within a heterogeneous (with a sufficiently high Total Score variance) group close to the normal distribution in terms of the feature measured by the test. Another criterion of testing with high reliability is high correlation between the item scores and Total Score [8, 12-14].
3. Proposed Method: Fuzzy Cronbach Alpha
This study proposes a calculation method named as the Fuzzy Cronbach Alpha Reliability Coefficient for the case in which the satisfactions scores are obtained as an interval number from the questionnaires. Below, the proposed method is described in steps:Step 1. Firstly, the satisfaction scores obtained as an interval number from the questionnaires are transform into the triangular fuzzy numbers.For example, assuming that a participant has given minimum 30 and maximum 70 (interval number is [30, 70]) for the faculty members’ ability to lecture (Item 1). In this case, the satisfaction score given by that individual would be a triangular fuzzy number as follows: (30, (30+70)/2, 70) = (30,50,70) Step 2. The h-sections of the fuzzy numbers are formed according to a predetermined h value, and while the satisfaction scores are at the closed intervals consisting of the h-sections, the minimum and maximum values for the Cronbach Alpha coefficient are obtained using the multivariate constrained optimization technique. The optimization is formulated below: 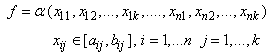 | (4) |
İn here,  is the Cronbach Alpha function that described in (2). Decision variables for this optimization problem represent satisfaction scores that answerers give in the questionnaires.
  is the score that i’th answerer gives to j’th subject. Each decision variable is limited to the h-section obtained from the fuzzy number, namely the closed interval. aij is the lower limit of the h-section of the fuzzy number obtained from the answer given by the participant i for the item j. bij is the upper limit of the h-section of the fuzzy number obtained from the answer given by the participant i for the item j.The minimum and maximum values of the objective function are obtained by means of any multivariate constrained optimization method. This study has used the built-in function called “fmincon” of the Matlab package program for optimization.Step 3. The Fuzzy Cronbach Alpha is obtained according to the result of the optimization.The minimum and maximum values of the objective function constitute the left and right ends of the triangular fuzzy number of the Fuzzy Cronbach Alpha, respectively. The average of the maximum value and minimum value is taken as the centre of the Fuzzy Cronbach Alpha. The obtained Fuzzy Cronbach Alpha is indicated as follows.
 | (5) |
In this study, the values of the decision variables corresponding to the maximum Cronbach Alpha ( ) value obtained are accepted as the most accurate data. It is recommended to use the data with the maximum reliability value (
 ) when evaluating the questionnaire results.
4. Application
4.1. Application of a Classical Satisfaction Questionnaire and Encountered Problems
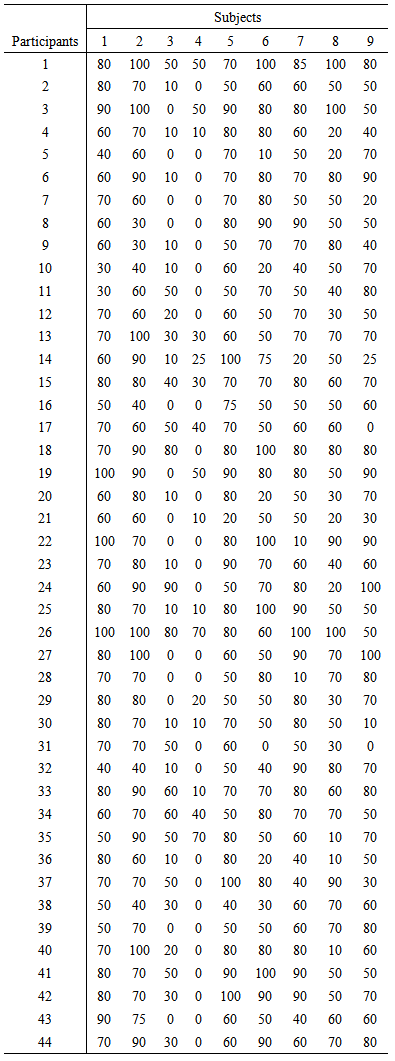
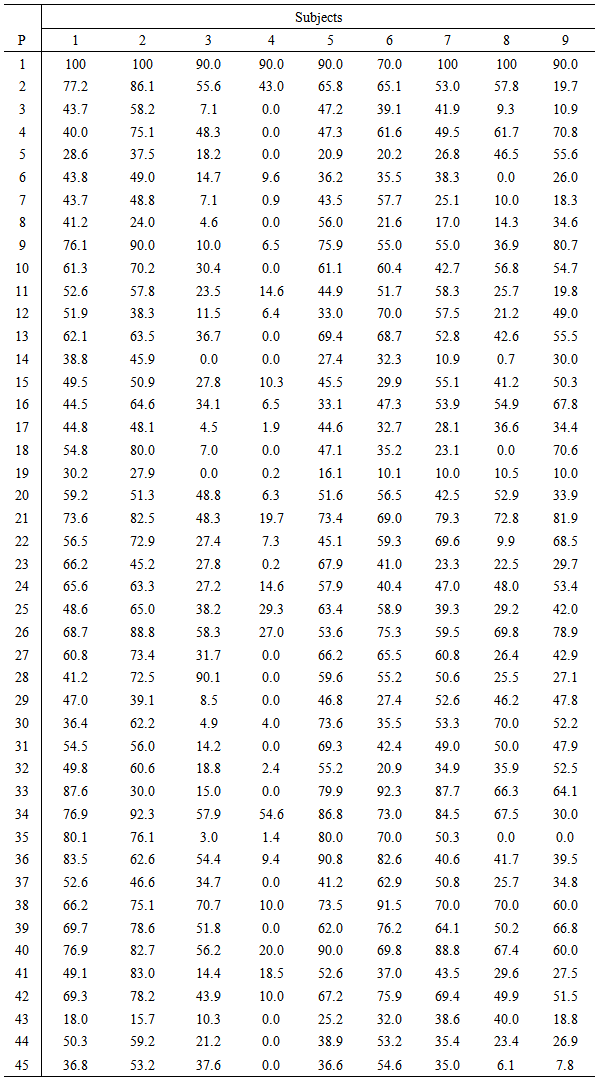
In order to determine the satisfaction level of 51 students at Class 3 of the School of Nursing, Hitit University; 9 subjects of satisfaction were determined, namely the lecturing skills of the Faculty Members, their relations with the students, the department’s computer facilities, laboratory facilities, course contents, library facilities, scientific activities, social activities, and sports activities. The Table 1 below shows the satisfaction points given by 44 students between 0 and 100 for the 9 items during the classical questionnaire application.Table 1. Satisfaction Points given by 44 Students
 |
| |
|
The Cronbach Alpha reliability coefficient of the item scores given in the Table 1 has been calculated as 0.685. Considering that many authors state that a reliability coefficient calculated should be minimum 0.70 [15] and, it can be said that the reliability (0,685) of the obtained data is low. The changes in Cronbach Alpha when any item is deleted from the questionnaire have been examined, and it has been seen that all items except for the Item 9 (Satisfaction from sports activities) have reliability improving effects. The reliability value calculated following deletion of the Item 9 from the questionnaire is 0.705 (0.705 > 0.685). So, it is possible to improve reliability by deleting the Item 9 from the questionnaire. However, it is obvious that the satisfaction levels of the students with respect to the sports activities organized by the department will not be determined if the Item 9 is deleted from the questionnaire.According to the results of the one-sample Kolmogrov-Simirnov Test, the items other than the Item 5 (8 ones of 9 items) have no normal distribution. Since a normal distribution of the Items and Total Score would positively affect the reliability, it is possible to improve reliability by increasing the number of participants. However, the number of participants cannot be increased since the related population consists of 51 individuals. So, for the purpose of improving the reliability, it can be considered to apply the same satisfaction questionnaire to the students after a while and obtain more reliable data. But, this method is impractical, and achieving to obtain a high reliability value is not exact with a new application. Average of the correlation values between each item and total score has been found 0.540. Another reason for this low reliability is the fact that the correlation values between the item scores are small.
4.2. Application of a Fuzzy Satisfaction Questionnaire
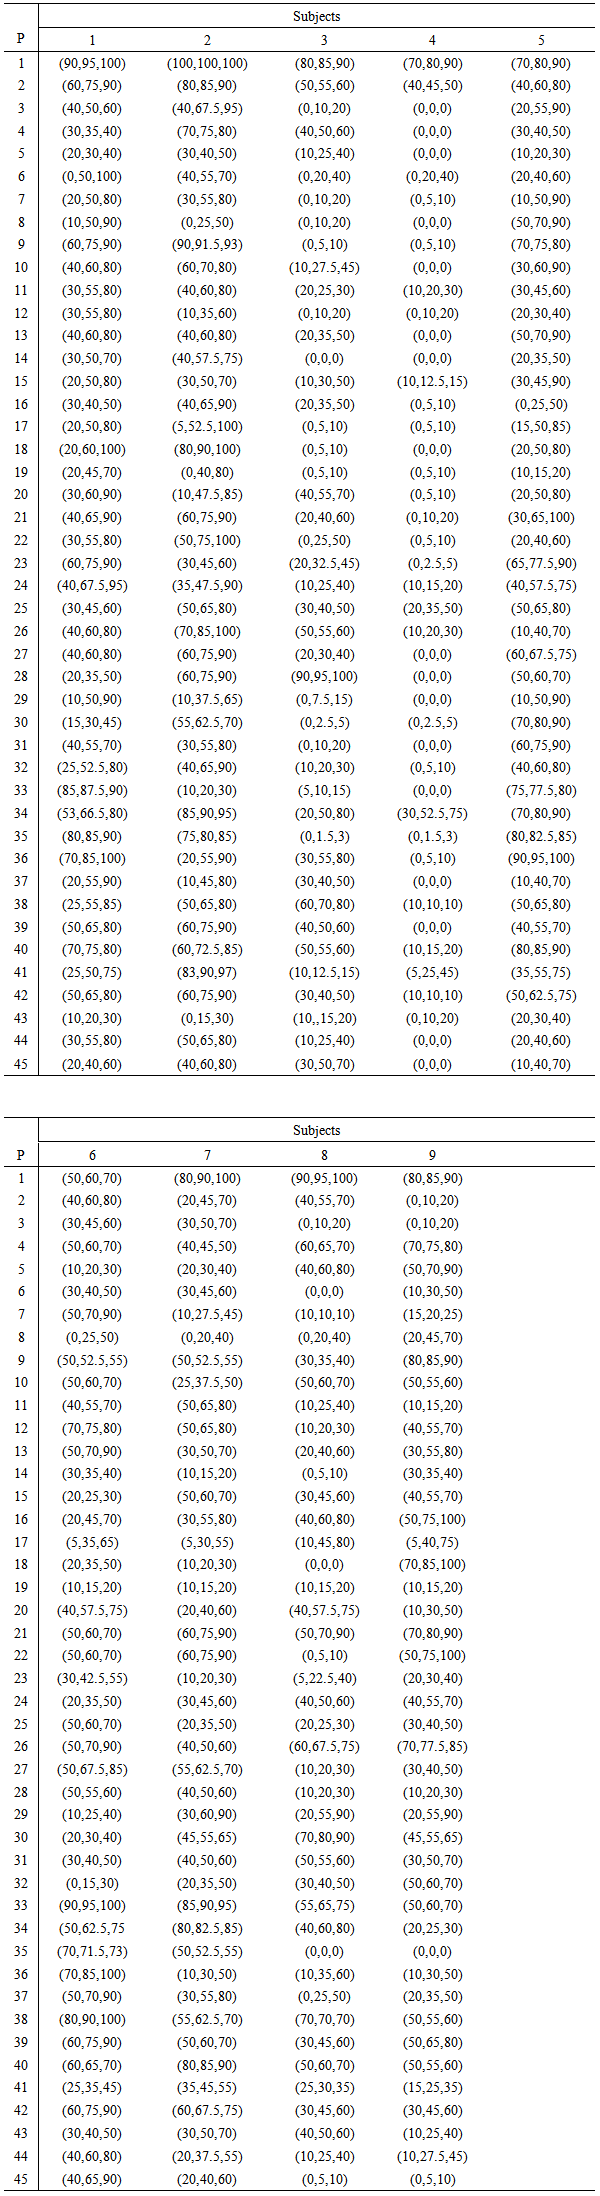
A fuzzy satisfaction questionnaire is applied to 45 students of the same 51 students who participated in the Classical Satisfaction Questionnaire a week ago as mentioned above.. In this new questionnaire, the questions were revised (i.e. Item 1: “What would be the minimum and maximum points given by you for the competence and lecturing skills of the faculty members in the related fields in your department?”), and the answers for the items have been obtained as triangular fuzzy numbers between 0 and 100. The Fuzzy Satisfaction Scores obtained are shown in the Table 2 below.As can be seen in the Table 2, the satisfaction levels of the individuals are expressed as the fuzzy values, instead of net values. The Fuzzy Cronbach Alpha value has been found (0.7370, 0.8218, 0.9066) by the optimization method given in (4) using the fuzzy data. In other words, the fuzzy data obtained as shown in the Table 2 has the fuzzy reliability (0.7370, 0.8218, 0.9066). Even the minimum value of fuzzy reliability 0.7370 is higher than 0.685 which was calculated from 51-observation data obtained by the classical questionnaire application. So, it can be considered that the individuals give more realistic answers when fuzzy satisfaction Questionnaire is applied to participants. Table 2. Fuzzy Satisfaction Scores Given by 45 Students
 |
| |
|
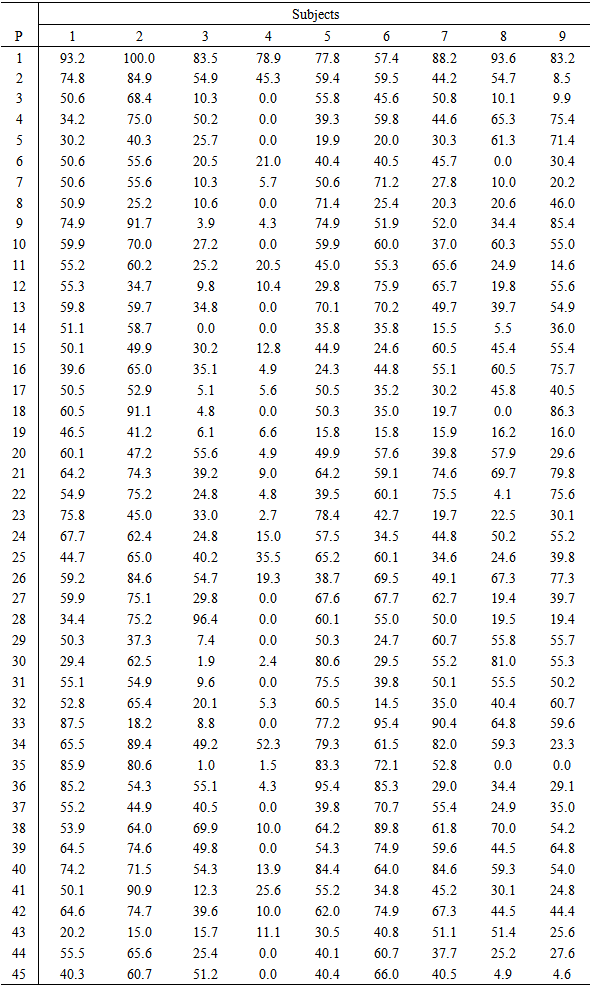
The data giving the minimum value of fuzzy reliability (0.7370) has been obtained from the fuzzy data given in the Table 2 by the optimization method as shown in the Table 3. As a result of the analysis performed on the data in the Table 3, the Cronbach Alpha value recalculated after deletion of the Item 9 from the questionnaire is 0.754, and again, it has remained the satisfaction question that should be deleted from the questionnaire (0.754 > 0.737). While only 2 variables have an approximately normal distribution with respect to the application of the classical satisfaction questionnaire, the 8 variables (including the Total Item Score) except for the Item 1 and Item 4 have a normal distribution for the data with a reliability level of 0.737. Average of the correlation values between each item and Total score has been found 0.575, and this is slightly greater than the value 0.540 calculated for the classical questionnaire application. Consequently, the data obtained even for the minimum value of the Fuzzy Cronbach Alpha has a higher reliability, and the statistical features for the data have been achieved to a large extent in comparison with the data obtained from the Classical questionnaire application.Table 3. Satisfaction Scores with Reliability Level of 0.7370 as Given by 45 Students
 |
| |
|
The data giving the maximum value (0.9066) of fuzzy reliability has been obtained from the fuzzy data given in the Table 2 by the optimization method as shown in the Table 4.Table 4. Satisfaction Scores with Reliability Level of 0.9066 as Given by 45 Students
 |
| |
|
With respect to the data with a reliability level of 0.9066, only the Item 4 has no normal distribution, but all other variables have an approximately normal distribution. Since the Cronbach Alpha value (0.909) increases only by 0.002 when the Item 9 is deleted from the questionnaire, it can be said that the negative effect of the Item 9 on reliability is statistically insignificant. Therefore, it is not necessary to delete any item from the questionnaire. The data shown in the Table 4 is related to the data with a high reliability value of 0.9066, for which the total core and all items except for one have a normal distribution. Average of the correlation values between each item and total score is 0.7614, and the obtained data shows great correlations between the items. So, it is seen that the data obtained for the maximum value of Fuzzy Cronbach Alpha is the data closest to the precision compared to the data acquired by the classical questionnaire application or obtained for the minimum value of Fuzzy Cronbach Alpha.
5. Conclusions
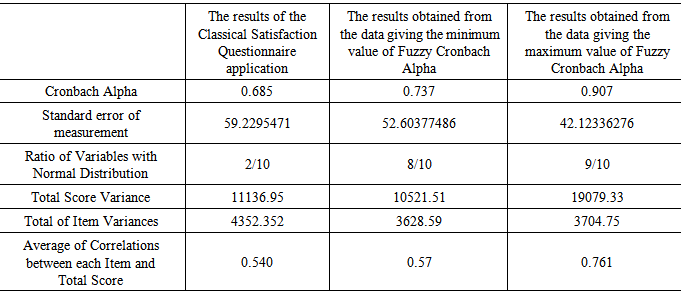
All of the statistical results obtained as a result of 3 applications are given in the Table 5. When analyzing the Table 5, it can be seen that the results obtained for the minimum value of Fuzzy Cronbach Alpha have significantly better statistical features compared to the results obtained as a result of the classical questionnaire application, and the best statistical features are achieved for the maximum value of the Fuzzy Cronbach Alpha. The data obtained for the maximum value of the Fuzzy Cronbach Alpha is the data with the highest reliability and highest degree of relevance to a normal distribution as well as the greatest heterogeneity of total item scores and greatest correlations between each item and the total score as compared with the data obtained in other application. Furthermore, the standard error of measurement for the data obtained for the maximum value of the Fuzzy Cronbach Alpha is significantly small compared to the other applications, and the homogeneity assumption for the items has been substantially satisfied compared to the classical questionnaire application. So, this study demonstrates that the data obtained for the maximum value of the Fuzzy Cronbach Alpha is data closest to the precision. Based on this, the data given in the Table 4 is the data with highest reliability and closest to the precision, for which almost all of the statistical assumptions are satisfied.Table 5. Comparison of the Results
 |
| |
|
No item is needed to be deleted from the questionnaire when the data obtained for the maximum value of the Fuzzy Cronbach Alpha is used. In addition, the maximum reliability value and the data giving this maximum reliability have been obtained with only 45 samples and a single application. The data obtained for the minimum value of the Fuzzy Cronbach Alpha has also a high reliability value, and the statistical features for the data have been achieved to a large extent. Therefore, receiving the answers of a satisfaction questionnaire as fuzzy numbers is a more realistic method since this allows us to obtain more accurate results.The advantages of the proposed fuzzy satisfaction questionnaire and Fuzzy Cronbach Alpha calculation can be listed as follows:• Since the people think fuzzy about many things in the daily life [16], determination of the satisfaction levels as fuzzy numbers is a more realistic method. When fuzzy questionnaires and fuzzy attitute scales applied to individuals, they can answer questions more correctly according to the classical questionnaires or scales applications and more reliable statistics are obtained. And so, the closest results to the real results can be obtained by researches. • It is not necessary to delete any item from the questionnaire in order to improve reliability. Because, the results which have the content validity can be obtained via applications of the fuzzy satisfaction questionnaire in comparison with applications of the classical questionnaire. • There is no need that the number of the samples is high. It is also possible to be able to be obtained highly reliable data by using small samples.• It is not necessary to make repeated measurements in order to improve reliability. Thus, the difficulties of performing a great number of applications will be eliminated.Moreover, the statistical advantages of the data obtained for the maximum value of fuzzy reliability in comparison with data obtained from a classical questionnaire can be listed as follow:• Since the maximum value of reliability can be determined, the most accurate data would be obtained;• The item scores to be obtained would be more homogeneous and closer to the normal distribution in accordance with statistical assumptions of the reliability analysis,• The total scores to be obtained would be more heterogeneous and have a normal distribution in accordance with statistical assumptions of the reliability analysis.• The correlation value between each item and Total Score would be greater in accordance with statistical assumptions of the reliability analysis.
References
| [1] | L. Crocker and J. Algina, Introduction to classical and modern test theory, Fort Worth: Holt, Rinehart and Winston, 1986. |
| [2] | Y. Baykul, Classical test theory and application, Ankara: OSYM Publications, 2000. |
| [3] | Cronbach, L.J., 1951, Coefficient alpha and the internal structure of tests., Psychometrika, 16(3), 297-334. |
| [4] | N.E. Gronlund and R.L. Linn, Measurement and Evaluation in Teaching, 6nd ed., New York: Macmillan, 1990. |
| [5] | Meier, S.T., and Davis, S.R., 1990, Trends in reporting psychometric properties of scales used in counseling psychology research., Journal of Counseling Psychology, 37(1), 113-115. |
| [6] | K. Murpy and C. Davidshofer, Psychological testing: Principles and Applications. Englewood Cliffs, NJ: Prentice Hall, 1988. |
| [7] | R.P. McDonald, Test theory: A unified treatment. Mahwah, New Jersey: Lawrence Erlbaum, 1999. |
| [8] | Cortina, J.M., 1993, What is coefficient alpha? An examination of theory and applications., Journal of Applied Psychology, 78(1), 98–104. |
| [9] | Yuan, K., and Bentler, P.M., 2002, On robustness of the normal-theory cased asymptotic distributions of three reliability coefficient estimates., Psychometrika, 67(2), 251–259. |
| [10] | Jöreskog, K., 1990, New Developments in LISREL. Analysis of Ordinal Variables using Polychoric Correlations and Weighted Least Squares., Quality and Quantity, 24(4), 387-404. |
| [11] | Yuan, K.H., and Bentler, P.M., 2000, Inferences on correlation coefficients in some classes of nonnormal distributions., Journal of Multivariate Analysis, 72(2), 230-248. |
| [12] | H.Sencan, Reliability and validity in the social and behaviorual Measurement, Ankara: Seckin Publications, 2005. |
| [13] | C. Yildirim, Measurement and avaluation in education, Ankara: OSYM Publications, 1999. |
| [14] | A.A. Tezbasaran, Guide of devoloping the Likert type scale, Ankara: TPD Publications, 1996. |
| [15] | R.M. Kaplan and D.P. Saccuzzo, Psychological Testing: Principles, Applications, and Issues, Monterey: Brooks/Cole, 1982. |
| [16] | Zadeh, L.A., 1965, Fuzzy Sets., Inform and Control, 8(3), 338-353. |
 Abstract
 Reference
 Full-Text PDF
 Full-text HTML