-
Paper Information
- Paper Submission
-
Journal Information
- About This Journal
- Editorial Board
- Current Issue
- Archive
- Author Guidelines
- Contact Us
American Journal of Intelligent Systems
p-ISSN: 2165-8978 e-ISSN: 2165-8994
2014; 4(4): 131-134
doi:10.5923/j.ajis.20140404.01
Automatic Brown Spot and Frog Eye Detection from the Image Captured in the Field
 Abstract
 Reference
 Full-Text PDF
 Full-text HTML
Sourabh Shrivastava , Dhara Singh Hooda
Jaypee University of Engineering and Technology, Guna-473 226 (M.P.), India
Correspondence to: Sourabh Shrivastava , Jaypee University of Engineering and Technology, Guna-473 226 (M.P.), India.
| Email: |  |
Copyright © 2014 Scientific & Academic Publishing. All Rights Reserved.
In this research paper, we introduce a practical application of Digital image processing in agriculture for detecting and classifying Brown Spot and frog eye. The image is captured by mobile phone in the field and applies the digital image processing method for detection and classification the both diseases. We extract the shape feature vector by digital image processing and this feature vector helps to use a K-NN classifier for disease classification. The results of this study recommended that: shape discriminators have good features for classifying the disease and quite satisfactory method for classification.
Keywords: Frog's eye, Brown spot, Image processing, Classification and shape identification
Cite this paper: Sourabh Shrivastava , Dhara Singh Hooda , Automatic Brown Spot and Frog Eye Detection from the Image Captured in the Field, American Journal of Intelligent Systems, Vol. 4 No. 4, 2014, pp. 131-134. doi: 10.5923/j.ajis.20140404.01.
Article Outline
1. Introduction
- Soybean cultivation is one of the most crucial agriculture, natural process in developing agricultural countries. Soybean cultivation is still endangered by various factors that make soybean production become less fertile. It contributes to scarcely accomplish the target of 10 tonnes per hectare for the Indian national needs. Soybean diseases are quickly recognized by their symptoms related seeable changes in the plant. There are several of soybean disease types, but this research concentrates on two soybean diseases that have the same symptoms, which are Brown Spot Disease (BSD), and Frog eye Disease (FED). BSD is caused by the fungus Pyricularia grisea. This fungus disease is calculated to induce production losses of US$55 million each year in India and Southeast Asia [1, 2]. The losings are even more eminent in East Asia and other more moderate soybean growing regions around the world [3]. The disease is visually exposed by knowing the growers who have the capability to identify dramatic changes in plant and disease color or slight droop curls of plant leaves. Although soybean farmers are being educated by agricultural people to distinguish soybean diseases in order to assure that early prevention is taken, but faults might happen in order to influence the type of diseases and control. However, this method acting is gruelling and long, and it is unimaginable to accurately calculate the tainted areas and severity in large scale farming. The era of computer engineering bids great possibility to automatism the process. Digital Image processing is very proficient in the agricultural industry. The shape of the soybean disease objects constituted in images is one of the most substantial features used in sorting and recognition performance. This is especially due to the reality that shape is perceptually very similar in order to identify the objects. In approximately considerations shape contains more intrinsically information about the presented object than color, texture or other features. The shape based recognition aims to calculate geometric properties of an object to be used for separating, equalizing, and distinguishing objects. There are many techniques available for shape theatrical performance that are resumed in [4], such as Fourier descriptors among others. The study in [4] relegates the shape feature description into boundary based and region based methods. In this study first we find out the disease lesion of two most dangerous diseases of soybean after that found out the feature and shape of the disease region and classify by different attributes. The different attributes are shape, size and area of the infected region in the soybean plant leaves. [12-15]. Very few methods are available in disease detection in this filed [16].Disease Description Indications of brown spot come out first on the cotyledons and unifoliate leaves early in the starting season. Angular, red to brown spots that variegate in shape and size from large molecules to 1/4 inch diameter can be seen on the both sides of leaf surfaces. The frog eye can be identified by small, circular gray spots with reddish-brown and purple borders on the upper leaves in the late season of soybean cultivation. These spots ultimately elaborate to a diameter of about 1.4 inches. Rain slopping on the remainder will carry reproductive structure to young leaves. It takes 7 to 12 days after vaccination for indication exploitation reckoning on the temperature [5, 6]. In this study the image is captured by mobile in the field of soybean. The rest of the research paper is prepared as follows. In section II, the methodology used is introduced that includes image pre-processing and feature extraction, Section III is shaping classification. Section IV is computational results are discussed Section V gives our conclusion and future work.
2. Methodology
- The methodological analysis of diagnosis soybean diseases can be presented as Fig. 1. This process necessitates various tasks, such as image pre-processing, image segmentation and shape feature extraction and soybean disease classification based on lesion type of two diseases.
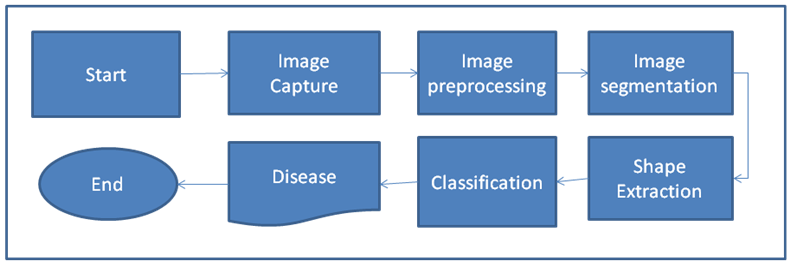 | Figure 1. Block Diagram |
2.1. Image Acquisition
- In this procedure, it is a planning process to obtain soybean leaf images. The RGB color digital images of soybean are clicked using a Samsung mobile model GT-S3770 digital camera, with the pixel resolution 1600x1200. The digitized images are about 125 KB size each. There have captured about 100 data samples in the soybean field near Guna district India. It consists of two types of soybean diseases, namely soybean brown spot and frog eye as shown in Fig. 2. Images are saved and stored in JPG format.
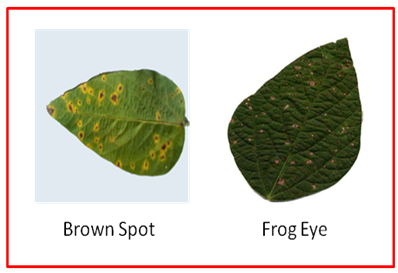 | Figure 2. Infected Disease images |
2.2. Image Segmentation and Pre-Processing
- The pre-processing and segmentation task is the initial stage of the soybean image before the image is used for the next process. The main aim of this procedure is to obtain the binary image with noise free. In order to accomplish more exactness, appropriate, interpret should be obtained. The RGB image is converted into background separated image with the help of morphological operation [10]. When we found the background separated image we apply the threshold method [11], to find out the infected region.
2.3. Infected Lesion Detection
- When we get the background separated image we apply the threshold method in leaflet image only. The threshold method is applied on the basis of pixel value of the infected region. Analysis of the pixel value of the infected region OT brown spot and frog eye lesion both are in a reddish color. With the help of immortal command of the Matlab 2012 we realize the infected pixel values of red is always greater than the pixel value of green and blue. So apply the threshold procedure and finally get the binary image. We can say in simple words the threshold is applied to the red channel and get the infected area in the white pixel which is shown in figure no-3. White represents for infected area and black represents the healthy area.
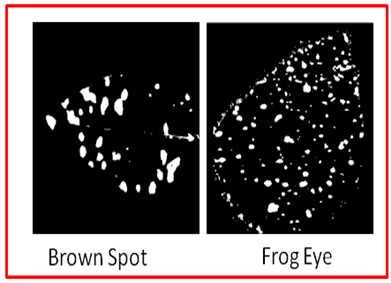 | Figure 3. Infected Lesions |
2.4. Feature Extraction
- Texture and Shape is a significant parametric quantity of a digital image. People frequently realize and differentiate an object by its shape. The texture and shape descriptor objectives to calculate the geometric features of an object to be used for sorting, matching, identifying and recognizing objects. There are various processes and techniques for shape representation that are summarized in [7]. Normally shape descriptors such as the number of the area of an object, no of objects, centroid of object, perimeter, width and length of the object are important characteristics to describe its shape. Those features are used to extract features from the infected diseased lesion. Some of the features are calculated and the image shows a figure-4. All these parameters are used to extract the infected disease lesion in the soybean leaf. Blob Analysis is also used in this analysis of diseased lesion in the soybean leaves to get no. of the object for labelled lesion in a noise free binary image. The object is a diseased, infected lesion on the soybean leaf. Normally, there are a number of objects on a soybean leaf image. If we analysis the literature so we had compared the lesion of both disease and found the disease lesion of brown spot is bigger than the frog eye lesion and the number of objects appearing in the frog eye are greater than brown spot. Now this analysis also comes and true by this research. After we have found the diseased shape descriptors of infected lesion of both diseases we focused on the classification of the disease and use all the different parameter which is extracted on this section.
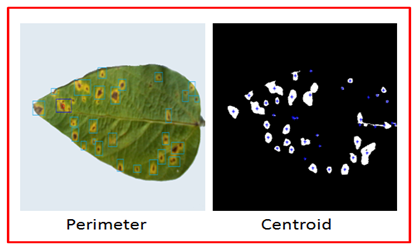 | Figure 4. Shape Features |
2.5. K-NN Classifier
- One mutual process is k-Nearest Neighbors (KNN) [8], which, given a feature descriptor and vector for an example to be sorting and classifying, find the k nearest feature descriptors from the labelled training set, and specifies to the exercise the most similar among the k labels [9]. The measure k acts as a fine-tuning parameter, and higher values of k will bear more noise in the training set. In the case of k = 1 (1-NN) this is combining weight to allotting the label of the closest training example. The presumption of KNN is that resemblance amongst examples is presented exactly by Euclidean distance is the feature vectors, for which we shape descriptors are assigned for KNN a sensible selection as a basic autonomous classier.
3. Result and Discussion
- In this experiment we use the data set of 50 infected leaves of both diseases as a training data set and we tested overall 22 images of each data set. With the help of a KNN classifier we can easily differentiate on the basis of feature vectors. The classification and average classification result is shown in table no 1 which is quite reliable to classify two diseases. When we analysis the object area and number of objects in the infected image are also classifying feature in the shape analysis. On the behalf of above sentence we also classify the soybean disease and results are also shown in fig no-5. In this figure we easily identify and classify the result of soybean infected leaves. In that analysis frog eye lesions are sever than the brown spot lesion. Area of the brown spot lesion is greater than the frog eye lesion it is easily represents by graph in figure 5. The classification rate of brown spot is 70% and frog eye is 80%. Number of lesion indicates the infected region in the soybean leaf.
|
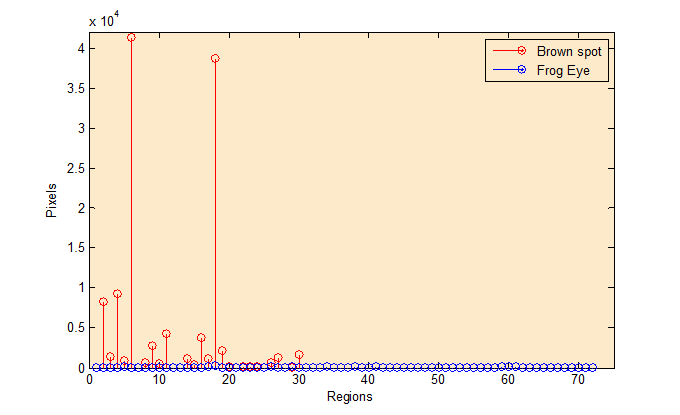 | Figure 5. Comparison Graph |
4. Conclusions and Future Scope
- With theoretical and experimental calculation, analysis and adding a rendering module and classifier, the result about the pose feature extraction and infant disease detection and classification can be developed. Hence, our suggested methodology gives the best result regarding soybean disease detection and classification on the basis of shape descriptors in all criteria. We are presently working on ameliorating the detection, classification accuracy and determine the classification of more disease on the basis of shape color and texture analysis.