-
Paper Information
- Next Paper
- Paper Submission
-
Journal Information
- About This Journal
- Editorial Board
- Current Issue
- Archive
- Author Guidelines
- Contact Us
American Journal of Intelligent Systems
p-ISSN: 2165-8978 e-ISSN: 2165-8994
2014; 4(1): 9-14
doi:10.5923/j.ajis.20140401.02
A Study of Support Vector Machine Algorithm for Liver Disease Diagnosis
 Abstract
 Reference
 Full-Text PDF
 Full-text HTML
Esraa M. Hashem, Mai S. Mabrouk
Biomedical Engineering, Misr University for Science and Technology (MUST University), 6th of October, Egypt
Correspondence to: Mai S. Mabrouk, Biomedical Engineering, Misr University for Science and Technology (MUST University), 6th of October, Egypt.
| Email: |  |
Copyright © 2012 Scientific & Academic Publishing. All Rights Reserved.
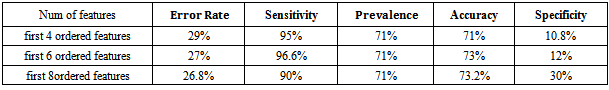
Patients with liver disease have been continuously increasing because of excessive consumption of alcohol, inhale of harmful gases, intake of contaminated food, pickles and drugs. The liver has many essential functions, and liver disease presents a number of concerns for the delivery of medical care. Chronic liver disease (CLD) is common long-term conditions in the developed and developing world. Classification techniques are very popular in various automatic medical diagnosis tools. Early identification of the cancer has been often vital for the survival of the patients. Support vector machine (SVM) is supervised learning model with associated learning algorithms that analyze data and recognize patterns. In this work, Support vector machine is used for classifying liver disease using two liver patients datasetswith different features combinations such as SGOT, SGPT and Alkaline Phosphates,evaluating a support vector machine classifier by measuring its performance based on: accuracy, error rate, sensitivity, prevalence and specificity. Results show that the accuracy, error rate, sensitivity and prevalence at first 6ordered features are the best for ILPD dataset compared to BUPA dataset. This can be attributed to a number of useful attributes like Total bilirubin, direct bilirubin, Albumin, Gender, Age and Total proteins are available in the ILPD liver dataset compared to the BUPA dataset which can help in diagnosis of liver disease.
Keywords: Chronic Liver Disease (CLD) and Support Vector Machine (SVM)
Cite this paper: Esraa M. Hashem, Mai S. Mabrouk, A Study of Support Vector Machine Algorithm for Liver Disease Diagnosis, American Journal of Intelligent Systems, Vol. 4 No. 1, 2014, pp. 9-14. doi: 10.5923/j.ajis.20140401.02.
Article Outline
1. Introduction
- The liver is an essential body organ that forms an important barrier between the gastrointestinal blood, which contains large amounts of toxins and antigens in the body. The liver produces a large amount of hormones, enzymes, and performs several functions essential to life. It is also the organ responsible for cleansing of toxins from the bloodstream, by turning them into removable substances. Liver diseaserefers to many diseases and disorders that may cause impaired liver function that can make liver decrease of its functions. The dysfunction may be primary, but the liver is often secondarily affected by disorders of other organ systems, since it is involved in many metabolic and detoxifying processes.Hepatic fibrosis and its end stage cirrhosis are an increasing worldwide concern. Cirrhosis is the irreversible end result of fibrosis scarring and normal hepatic architecture is replaced by interconnecting bands of fibrosis tissue. The most common etiological factors resulting in cirrhosis are hepatitis B, hepatitis C, and excessive alcohol consumption [1].Chronic HCV infection is normally a slow, progressive disease that may produce few or no symptoms for many years after infection. Some patients develop chronic infection and suffer no significant liver damage, while others progress quickly to liver cirrhosis and may develop hepatocellular carcinoma[2]. Patients with chronic liver diseases belong to a high-risk group for hepatocellular carcinoma and should be followed up regularly for early diagnosis.Chronic HCV infection is the major cause of cirrhosis and hepatocellular carcinoma (HCC). In this condition, alpha fetoprotein levels may be elevated. The incidence of hepatocellular carcinoma is rising, and this trend is expected to continue for years[3]. Figure 1, show that liver cancer is the most cause of death in Egypt among other types of cancer.According to the current studies, the majority of HCC patients contracted the disease from the accumulation of genetic abnormalities, probably induced by exterior etiological factors especially HBV and HCV infections[4]. These risk factors can induce mutations and damage in DNA sequences, such as p53 mutation induced by aflatoxin and DNA damage induced by the intrusion of the HBV genome[5]. The important thing in preventing liver cancer is to prevent hepatitis virus infection and eliminate hepatitis virus in chronic hepatitis patients. Automatic classification tools may reduce the burden on doctors. Data classification is a two phase process in which first step is the training phase where the classifier algorithm builds a classifier with the training set of dataset the second phase is classification phase where the model is used for classification and its performance is analyzed with the testing set of datasets[6].Existing feature selection methods broadly fall into two categories, filter methods and wrapper methods. Filter methods select features based on some discriminate criteria that rely on the characteristics of data and are independent of any classification algorithms[7]. Wrapper methods use the predictive accuracy of predetermined classification algorithms as the criteria to determine the goodness of a subset of features[8, 9].Most wrapper methods adopt sophisticated multivariate machine learning tools such as SVMs that take the combinatorial effects of features into account. These have been shown in many experiments to be more powerful in terms of classification accuracy than the filter methods[10]. Support Vector Machines proved to be effective for a lot of classifications problems. For binary-class classification, SVM constructs an optimal separating hyper plane between the positive and negative classes with the maximal margin. It can be formulated as a quadratic programming problem involving inequality constraints[11, 12].SVMs are one of the most promising machine learning algorithms and there are many examples, where SVMs are used successfully, e.g. text classification, face recognition, and Bioinformatics. On these data sets SVMs perform very well and often outperform other traditional techniques[13]. SVMs have gained an enormous popularity in statistics, learning theory, and engineering[14, 15], and the many references therein. With a few exceptions most support vector learning algorithms have been designed for binary problems. A few attempts have been made to generalize SVM to multiclass problems[16].In this work, a support vector machine is used as a classification algorithm in order to compare its performance with different features combinations such as aspartate aminotransferase (SGOT), glutamic pyruvic transaminase (SGPT), andalkaline phosphatase (Alkphos) using two datasets. The first one is BUPA Liver Disorders datasets taken from the University of California at Irvine (UCI) Machine Learning Repository, and the second one is from ILPD (Indian Liver Patient Dataset), it was collected from north east of Andhra Pradesh, India.
2. Materials and Methods
- The liver is one of the major targets for insulin and its count regulatory hormones, such as glucagon. HCC patients who abuse alcohol are more likely to develop cirrhosis than those who do not. The most common cause of liver disease is non-alcoholic fatty liver disease. Cirrhosis is the end-result of many liver conditions and involves severe scarring of the liver. It is associated with a progressive decline in liver function resulting in liver failure. Hepatocellular carcinoma is the most common primary cancer of the liver. There are factors that may impact progression include age, gender, chronic alcohol abuse, and quantity of virus of exposure. The disease appears to be more aggressive in patients that acquire HCV after age 40 and may be more progressive in men than women[2]. In this paper SVM classification algorithm has been applied to: BUPA liver disorders dataset and Indian Liver Patient Dataset for evaluating SVM performance with different features.
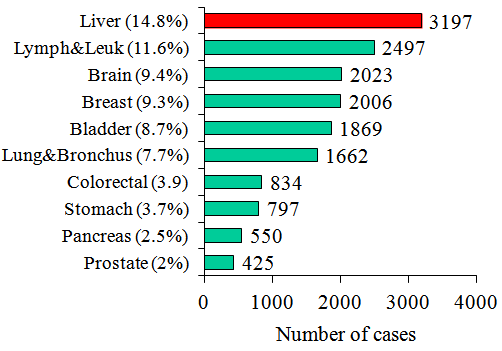 | Figure 1. Egypt Mortality Statistics, Most common sites (The Cancer Database, 2001) |
3. Dataset
3.1. BUPA Liver Disorders
- BUPA liver disordershas 6 numeric Attributes, 345 Instances. Relevant information: The first 5 variables are all blood tests which are thought to be sensitive to liver disorders that might arise fromexcessive alcohol consumption, each line in the BUPA. Data file constitutes the record of a single male individual. It appears that drinks>5 is some sort of a selector on this dataset. University of California at Irvine (UCI) machine learning repository (WWW.UCI.Com).
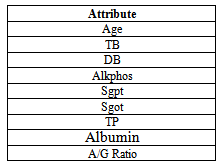
3.2. Indian Liver Patient Dataset (ILPD)
- Indian Liver Patient Dataset (ILPD) has 9 attribute, 483 Instances. The data set was collected from north east of Andhra Pradesh, India. Selector is a class label used to divide into groups (liver patient or not). This data set contains 441 male patient records and 142 female patient records .this data downloaded from (WWW.UCI.Com).
4. Support Vector Machine (SVM)
- Classification algorithms are widely used in various medical applications. Classification aims to build an effective model for predicting class labels of unknown data. The model is built on the training data, which consists of data points chosen from input data space and their class labels. A Support Vector Machine (SVM) separates the data into two categories of performing classification and constructing an N-dimensional hyper plane. These models are closely related to classical multilayer perceptron neural networks.A support vector machine constructs a hyper plane or set of hyper planes in a high- or infinite-dimensional space. A good separation is achieved by the hyper plane that has the largest distance to the nearest training data point of any class (so-called functional margin), since in general the larger the margin the lower the generalization error of the classifier.There are an alternative training method for polynomial, radial basis function and multi-layer perceptron classifiers in which the weights of the network are found by solving a quadratic programming problem with linear constraints, rather than by solving a non-convex, the unconstrained minimization problem as in standard neural network training[17], There are many possible kernel functions and the most common kernel are: Linear, polynomial, sigmoid and radial basis function (RBF). In this paper we use linear kernel function shows in equation .1:
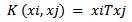 | (1) |
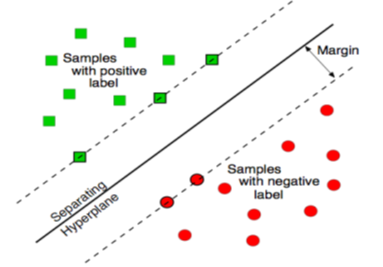 | Figure 2. Maximum margin, the vectors on the dashed line are the support vectors[20] |
5. Evaluation
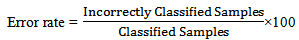
- To evaluate performance of SVM, accuracy, error rate, sensitivity, prevalence and specificity are calculated for each dataset. They are defined as follows:− Error rate: The error rate of a classifier is the percentage of the test set that are incorrectly classified by the classifier.
 − Sensitivity: Sensitivity is referred as True positive rate.
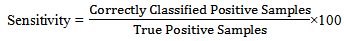 − Prevalence: Prevalence is defined as the proportion of the true positives against the entire samples results.
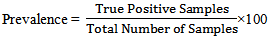 − Specificity: Specificity is the correctly negative rate that is the proportion of true negative samples[20].
 − Accuracy: Accuracy is the percent of correct classifications.Accuracy = 1 - Error rateFeature ranking is useful to gain knowledge of data and identify relevant features, also it helps reduce the number of features a learner has to examine and reduce errors from irrelevant features. Figure 3 summarize overall the process of this work.
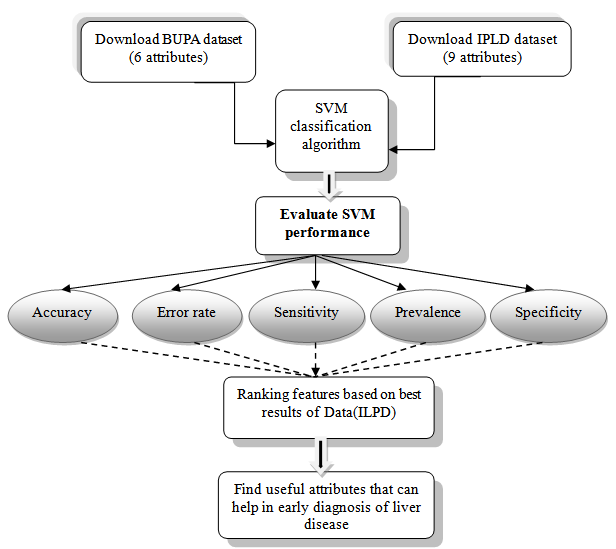 | Figure 3. The overall process |
6. Implementation
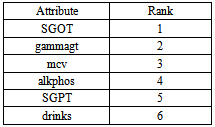
- SVM is a new promising non-linear, non-parametric classification technique, which already showed good results in the medical diagnostics, optical character recognition, electric load forecasting and other fields. The SVM algorithm is written and implemented using MATLAB and it is also tested on the WINDOWS platform using MATLAB version 7.0 with its powerful Bioinformatics and statistics for machine learning Toolbox. The Accuracy, Prevalence, Sensitivity, Error rate and Specificity are calculated for classifying BUPA liver patient’s dataset and ILPD Liver dataset using support vector machine classification algorithm.The features are ranked based on priority using the ranking algorithm available in MATLAB for each dataset.
7. Result and Discussion
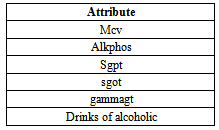
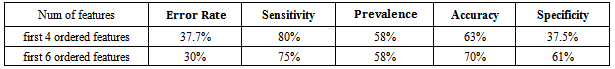
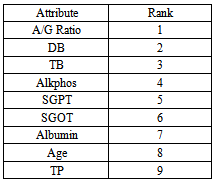
- Liver tumors are divided into two categories: benign and malignant. HCC is a malignant tumor derived from hepatocytes that belong to primary malignant epithelial tumors of the liver. An early diagnosis of liver problems will increase the patient’s survival rate. Performance of Support vector machine classification algorithm is tested and evaluated using two datasets (BUPA liver disorders, ILPD Indian Liver Dataset) as shown in table 1, and table 2. Table 1show the attributes of BUPA liver disordersand table 2 show the attributes of ILPD IndianLiver Patient datasets.
|
|
|
|
|
|
8. Conclusions
- Problems with liver patients are not easily discovered in an early stage as it will be functioning normally even when it is partially damaged. An important task in cancer research is to separate healthy patients from cancer patients and to distinguish patients of different cancer subtypes, based on their cytogenetic profiles. This is known as the classification problem. These tasks help successful cancer diagnosis and treatment. Machine learning is about designing algorithms that allow a computer to learn. Support vector machine has proved to be a powerful approach for classifier design. It has become an increasingly popular tool for machine learning tasks involving classification, regression or novelty detection. The key idea of SVM is to find a hyper plane that maximizes the margin separating the two classes of instances. In this study, the SVM classification algorithm were considered in evaluating its classification performance in terms of Accuracy, Prevalence, Sensitivity, Error rate and Specificity in classifying BUPA liver patient dataset and ILPDIndian Liver dataset. The Specificity at first 6 ordered features are best for BUPA dataset compared to ILPD dataset. The Sensitivity, Error rate, Accuracy and Prevalence at first 6 ordered features are best for ILPD Liver dataset compared to BUPA dataset, so the three common attributes (SGOT, SGPT, Alkphos) are important in diagnosis of liver diseases. This conclusion can be attributed to more number of useful attributes like Total bilirubin, direct bilirubin, Albumin, Gender, Age and Total proteins are available in the ILPD liver dataset compared to the BUPA dataset. So as to increase the number of features it improves the performance in classification algorithm that can help in early diagnosis and treatment of liver cancer.