-
Paper Information
- Next Paper
- Paper Submission
-
Journal Information
- About This Journal
- Editorial Board
- Current Issue
- Archive
- Author Guidelines
- Contact Us
American Journal of Intelligent Systems
p-ISSN: 2165-8978 e-ISSN: 2165-8994
2013; 3(1): 28-32
doi:10.5923/j.ajis.20130301.04
Automated Instrument Cluster Testing Using Image Processing
 Abstract
 Reference
 Full-Text PDF
 Full-text HTML
T. L. Narayana1, S. Venkat Rao1, K. Ganesan2
1M. Tech Automotive Electronics, VIT University, Vellore, India
2TIFAC-CORE in Automotive Electronics, VIT University, Vellore, 632014, Tamilnadu, India
Correspondence to: K. Ganesan, TIFAC-CORE in Automotive Electronics, VIT University, Vellore, 632014, Tamilnadu, India.
| Email: |  |
Copyright © 2012 Scientific & Academic Publishing. All Rights Reserved.
The present work aims at developing a hardware system to read the data displayed by an instrument cluster using image processing in LabVIEW. Test signals are generated using NI LabVIEW software and sent to the instrument cluster using CAN. A camera is used to capture an image of the cluster. This image is processed using LabVIEW to extract the reading of the cluster. The value as indicated by the image of the cluster is compared to the test signal sent to the cluster. Depending on the difference between the test signal and the output, the cluster’s error value is calculated, thus categorizing it as perfect or defective. The scope of present work is also to develop control software in NI LabVIEW along with Test Stand that controls the simulator to capture various signals, execute the tests and generate test reports.
Keywords: CAN, Instrument Cluster, ECU, OCR
Cite this paper: T. L. Narayana, S. Venkat Rao, K. Ganesan, Automated Instrument Cluster Testing Using Image Processing, American Journal of Intelligent Systems, Vol. 3 No. 1, 2013, pp. 28-32. doi: 10.5923/j.ajis.20130301.04.
Article Outline
1. Introduction
- Automotive Industry is one of the fastest growing industries of the 21st century. Advancements have moved from higher speed and efficient engines towards automated systems and electronic controls. Automobiles these days are equipped with electronic devices which provide the user with a number of additional inputs. In earlier days, the dash board was limited to a few basic indictors such as speedometer, fuel gauge etc. With development of newer technology, more information is available for the driver to assist him in better driving. Features like Parking Assist, Mileage and Remaining Kilo meter indicators, all are new add-ons to assist the driver. While there is more user friendly development, the task of engineers becomes more critical. These advancements cannot compromise on any safety aspect of an automobile. Thorough testing of each and every electronic feature is essential before its deployment into the vehicle.Thus, due to the vast increase in electronically controlled features on cars, the automotive industry is facing an extreme challenge in the flawless delivery of electronics and software systems within restricted development timescales. This work aims to increase confidence in the design and implementation of complex automotive electrical systems. A need was identified for machine vision to facilitate the automated development testing of driver information systems, principally instrument clusters and infotainment displays[1].The Instrument Cluster (IC) Electronic Control Unit (ECU) is one of the most complex electronic embedded control systems in modern vehicles. The functionality is distributed among many ECUs providing the customers with information such as driving conditions, fault diagnostics, warning signals (messages) and infotainment. As more and more of the controls are performed automatically to increase driver convenience, these functionalities are becoming increasingly complicated. The Instrument Cluster software therefore requires a rigorous and thorough testing of its functionality[2]. However, validation testing for these functionalities is difficult and extremely labor intensive.The major challenge with Instrument Cluster function validation compared with other automotive ECUs is that most of its functionality can’t be proven just by monitoring hardware communication lines (CAN/LIN). For instance if a command is received to turn on the indicator light then the only way to insure that the Instrument Cluster meets its specification is by manual observation of the indicator light on the screen. This becomes more complicated when the main message centre on the Instrument Cluster ECU is under test, again monitoring hardware I/O or communication lines would not tell whether the Instrument Cluster functions as expected.This system simulates the vehicle network in a real-time basis, and dynamically provides various signals to the instrument cluster under test. The machine vision system with image processing algorithms is designed to perform the test by detecting gauges, warning lights/telltales, patterns and text displays. A closed loop test system is implemented to perform a fully automated test process.
1.1. Basic Block Diagram
- The figure below depicts the basic block diagram of the proposed the system. The sequence of steps is shown in Figure 1. The GUI on LabVIEW is used to select a test. The corresponding test signals are then sent over the CAN bus using a simulator to the instrument cluster[3]. The instrument cluster responds to the test signals and its response is captured by the web camera. The web camera sends the captured imaged to LabVIEW via USB port. LabVIEW software checks whether the response of the cluster is appropriate.
 | Figure 1. Basic block diagram |
2. Pattern Matching and OCR
- In order for the automated test environment to work properly, it must have the ability to see what is happening on the instrument cluster during testing. This requires a camera along with a software to analyse the images taken by the camera. The software to extract relevant information from the image and, the software has to recognize patterns in the image to know what it is looking at. The pattern recognition will be done by matching parts of the image to pre-stored patterns. For example a warning telltale might be pre-stored as a triangle with an exclamation mark inside it. This pattern can then be compared to different parts of the image taken by the camera. By doing so, the system can determine what information the instrument cluster is presenting at a given time.A special kind of pattern matching is where text characters from a document needs to be identified and converted to an equivalent text string. This process is called optical character recognition (OCR) and is an area where a lot of research has been done, resulting in several patents (the first being in 1933). OCR is widely used today but the technique is not without problems. Errors do occur in the translation process from image to digitalised text. For example, similar characters can sometimes not be distinguished from each other. The technology on clearly printed documents can get accuracies of over 99 %.
2.1. Machine Vision Systems
- The whole process can be viewed in Figure 2 below. One of the first modules needed is test execution software which will execute the tests and then evaluates the response. This software will run on a standard computer.The test execution software interacts with some type of communication hardware, depending on which solution is chosen. This equipment is used as a connection between the test execution software and the Instrument Cluster. The communication hardware utilizes the CAN-protocol to communicate with the Instrument Cluster[4].To be able to observe the instrument cluster, the solution will need to use at least one digital camera. The camera sends the image to an image processing software, located either in the camera itself or in another component. This software extracts the relevant areas of the image and prepares it for the next stage. The image information extraction module gets the processed image and compares it to predefined patterns representing the information that can be presented on the instrument panel. The image information extraction module converts this information to a value or a string and returns it to the test execution software where it can be used for testing.
 | Figure 2. Automated camera based test system |
2.2. Camera
- The automated test environment is dependent on a functional camera. Without good images, image processing and pattern matching will not provide a sufficient result. A colour camera would be needed if, for example, a single area can be shown in different colours, as is the case with the Instrument Cluster. A very important property of the camera is the resolution, as it sets the limitations of what the smallest object that can be identified by the camera can be. Since the Instrument Cluster is significantly wider than it is high,t the width of the resolution is a key factor for the camera. The dimension 320mm by 167mm of the Instrument Cluster gives an aspect ratio of 320/ 167≈1.9, and is broader than a widescreen in comparison.If the resolution is unnecessarily high then the image processing execution time gets longer this can ultimately slow down the entire test process. Colour cameras with one digital image sensor mostly use the so called Bayer filter for capturing colour in the sensor. This is because the digital photosensitive sensor can only capture images in monochrome. Each pixel in the sensor has an individual filter in front of the pixel for capturing only one colour. The pixel filter distribution is 50% green, 25% red and 25% blue pixels. This distribution is due to the fact that the human eye is most receptive to green colour and less to red and blue. Some industrial cameras, primarily used in production, include an embedded system for image processing and pattern matching. The image processing software will then only be used when programming the camera and there is no need for a computer to run any image handling software during testing. Such cameras are often referred to as ―smart cameras.
3. System Architecture
- The entire system architecture shown in Fig. 3 below consists of a PC and LabVIEW software installed on it. The Instrument Cluster is controlled by an automotive controller which is embedded in it. LabVIEW software generates test signals which are sent as CAN messages with the help of an embedded device to the instrument cluster[5]. The cluster responds to the test signals. Once it responds, the camera takes real time input being displayed on the Instrument cluster and sends the image to LabVIEW software via USB port. This image is processed and LabVIEW software checks whether the image shows the response appropriate to the test signal which it sent to the cluster. If the appropriate response is observed, the cluster is said to have ‘Passed’ the test. The whole process involved is shown in Fig. 4 below. Let us consider one of the tests namely speed detection and see how it can be implemented
 | Figure 3. System Architecture |
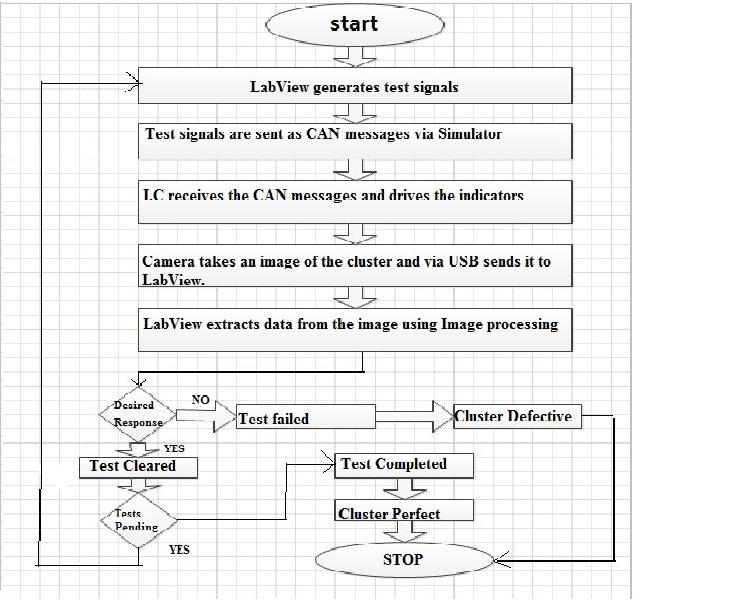 | Figure 4. System Flowchart |
3.1. Speed Detection
- Identification process for the speed as indicated by the needle of the speedometer is dealt here. When the message for the test is received by the cluster, a real time input is taken by the USB Camera[6]. This image is captured and loaded on to the VI. An annular search region is drawn on the image with the ends of the region coinciding with the extremes of the speedometer and then the edge of the needle is detected using edge detection. Measure the angle swept by the straight line from starting of the annular ROI. This angle helps to determine the original speed indicating in the meter as shown in Fig. 5.
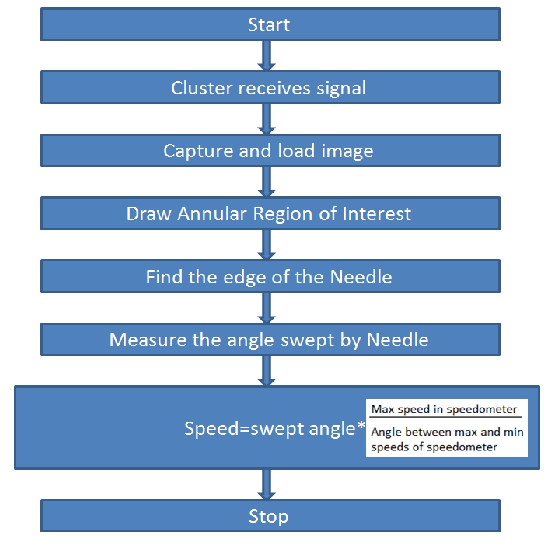 | Figure 5. Flow Chart for speed Test |
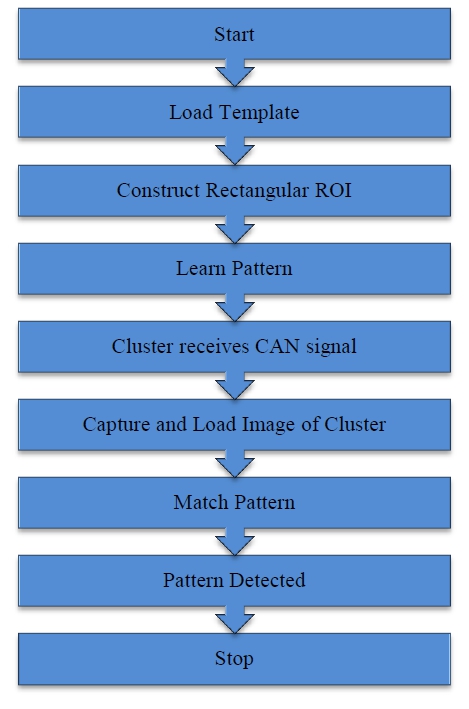 | Figure 6. Flow Chart for pattern matching Test |
3.2. Pattern Matching
- There are various tell-tale indicators on the instrument cluster such as power steering, seatbelt warning, low fuel indicator etc. These light up or glow depending upon the state of the hardware of the vehicle. While the state of on or off can be detected using the algorithm to detect the difference between the telltale indicators, pattern matching is required. To run this test, a template of the indicator is loaded from the memory and learnt by the VI. The real-time input image of the cluster is then captured and loaded onto the VI. The image is then scanned for the learnt pattern and an ROI is created around the pattern once it is detected as shown in Fig. 6 below[7].
4. Conclusions
- A closed loop system to automate the testing of instrument clusters in the automotive industry was developed in LabVIEW using Image Processing and CAN. The system is capable of generating test signals and driving the instrument cluster. The corresponding response of the cluster is then captured by the camera and sent via USB to LabVIEW. The image is processed using LabVIEW and data is extracted from it. The cluster output is read and LabVIEW checks if the cluster response was appropriate[8,9]. This automation of the testing is carried out in the prototype phase of cluster development. The tedious, labor intensive and time consuming task of manual testing can be made easier using this system.The system is flexible and can be used on a wide range of clusters just by tweaking system parameters, while reference images of telltale indicators allow the system to adapt to new additions of such indicators in instrument clusters. The real time ROI selection tool also makes it independent of the positioning of various indicators and blurring caused by movement of the camera or the cluster. Instrument clusters contribute significantly into ensuring safe and informed driving. Thus, the thorough testing of instrument clusters is vital before deployment onto the vehicle. There are hundreds of test signals which need to be run on instrument clusters and suppliers intend to slowly automate the entire testing process by incorporating more test signals and test sequences into the current program. Various combinations of signals that drive indicators and gauges are to be sent together to ensure accurate response under all conditions.
ACKNOWLEDGEMENTS
- This work frames part of the Research and Development activities of the Delphi-VIT Research Lab located at TIFAC-CORE in Automotive Infotronics at VIT University, Vellore. The authors T.L. Narayana and S.Venkat Rao would like to thank Delphi TCI for providing an opportunity to work on this interesting domain and providing timely help.